Determine which side one point is to another, given a slope or angle
Source:R/jam_plot_sedesign.R
point_handedness.RdDetermine which side one point is to another, given a slope or angle
Usage
point_handedness(
  pt1,
  pt2,
  slope = NULL,
  angle = NULL,
  do_plot = FALSE,
  verbose = FALSE,
  ...
)
Arguments
- pt1
numericmatrix of 2 columns, with x and y coordinates.- pt2
numericmatrix of 2 columns, with x and y coordinates.- slope
numericslope for each point in pt1 and pt2.- do_plot
logicalindicating whether to plot the result.- ...
additional arguments are ignored.
Value
character vector equal to the number of points, nrow(pt1):
"right"indicatespt1is on the right side ofpt2"left"indicatespt1is on the left side ofpt2
Details
The result describes the position of the first line relative
to the second line, assuming both lines are parallel with identical slope.
For example "left" indicates that line 1 is on the left side of line 2.
Note that the angle is a more accurate measure of directionality,
otherwise slope is always assumed to desribe an angle moving to the right.
When both lines are exactly overlapping, the result may be unstable, however the result tends to favor "right" by default.
See also
Other jamses utilities:
choose_annotation_colnames(),
contrast2comp_dev(),
fold_to_log2fold(),
intercalate(),
list2im_opt(),
log2fold_to_fold(),
make_block_arrow_polygon(),
mark_stat_hits(),
matrix_normalize(),
point_slope_intercept(),
shortest_unique_abbreviation(),
shrinkDataFrame(),
shrink_df(),
shrink_matrix(),
sort_samples(),
strsplitOrdered(),
sub_split_vector(),
update_function_params(),
update_list_elements()
Examples
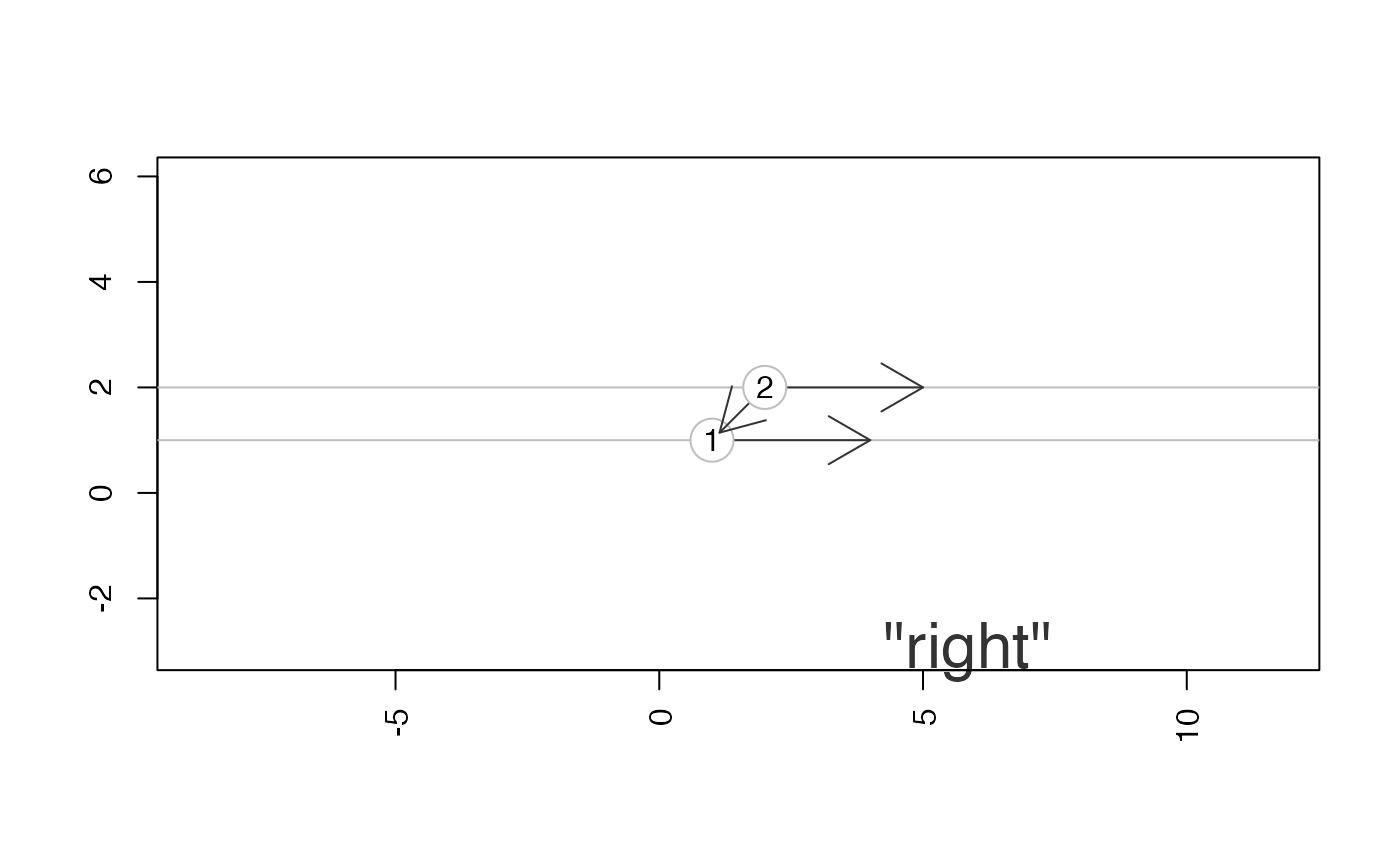
pt1 <- matrix(ncol=2, c(1, 1))
pt2 <- matrix(ncol=2, c(2, 2))
point_handedness(pt1, pt2, angle=0, do_plot=TRUE)
#> [,1] [,2]
#> [1,] 1 1
#> [1] ""
#> [1] "right"
point_handedness(pt1=c(1, 1), pt2=c(2, 2), angle=0, do_plot=TRUE)
 #> [,1] [,2]
#> [1,] 1 1
#> [1] ""
#> [1] "right"
pt1 <- matrix(ncol=2, c(1, 1))
pt2 <- matrix(ncol=2, c(0, 1))
point_handedness(pt1, pt2, angle=45, do_plot=TRUE)
#> [,1] [,2]
#> [1,] 1 1
#> [1] ""
#> [1] "right"
pt1 <- matrix(ncol=2, c(1, 1))
pt2 <- matrix(ncol=2, c(0, 1))
point_handedness(pt1, pt2, angle=45, do_plot=TRUE)
 #> [,1] [,2]
#> [1,] 1 1
#> [1] ""
#> [1] "right"
point_handedness(pt2, pt1, angle=45, do_plot=TRUE)
#> [,1] [,2]
#> [1,] 1 1
#> [1] ""
#> [1] "right"
point_handedness(pt2, pt1, angle=45, do_plot=TRUE)
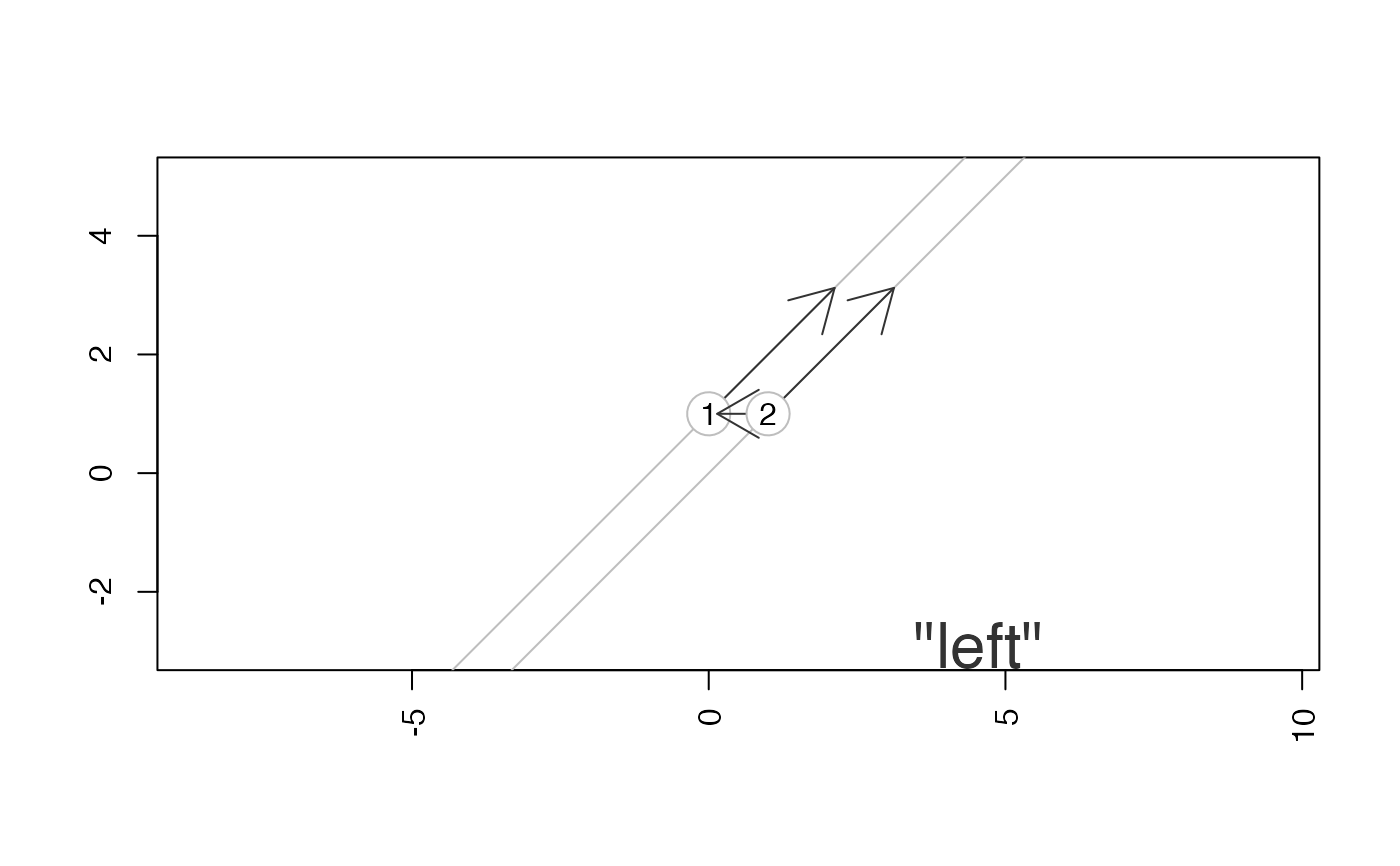 #> [,1] [,2]
#> [1,] 0 1
#> [1] ""
#> [1] "left"
point_handedness(rbind(pt2, pt2-1), rbind(pt1, pt1-1),
angle=c(45, 45+180), do_plot=TRUE)
#> [,1] [,2]
#> [1,] 0 1
#> [1] ""
#> [1] "left"
point_handedness(rbind(pt2, pt2-1), rbind(pt1, pt1-1),
angle=c(45, 45+180), do_plot=TRUE)
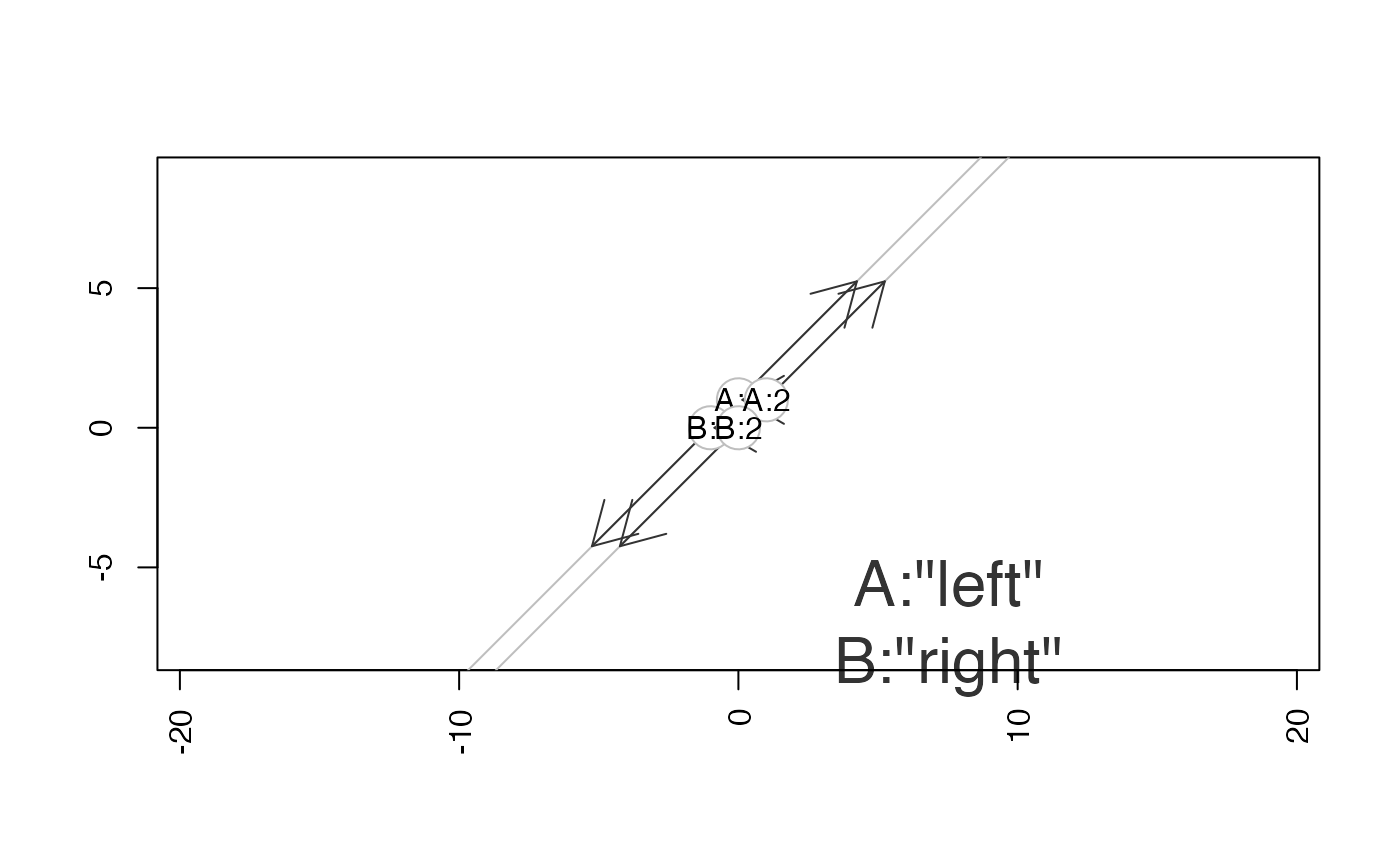 #> [,1] [,2]
#> [1,] 0 1
#> [2,] -1 0
#> [1] "A:" "B:"
#> [1] "left" "right"
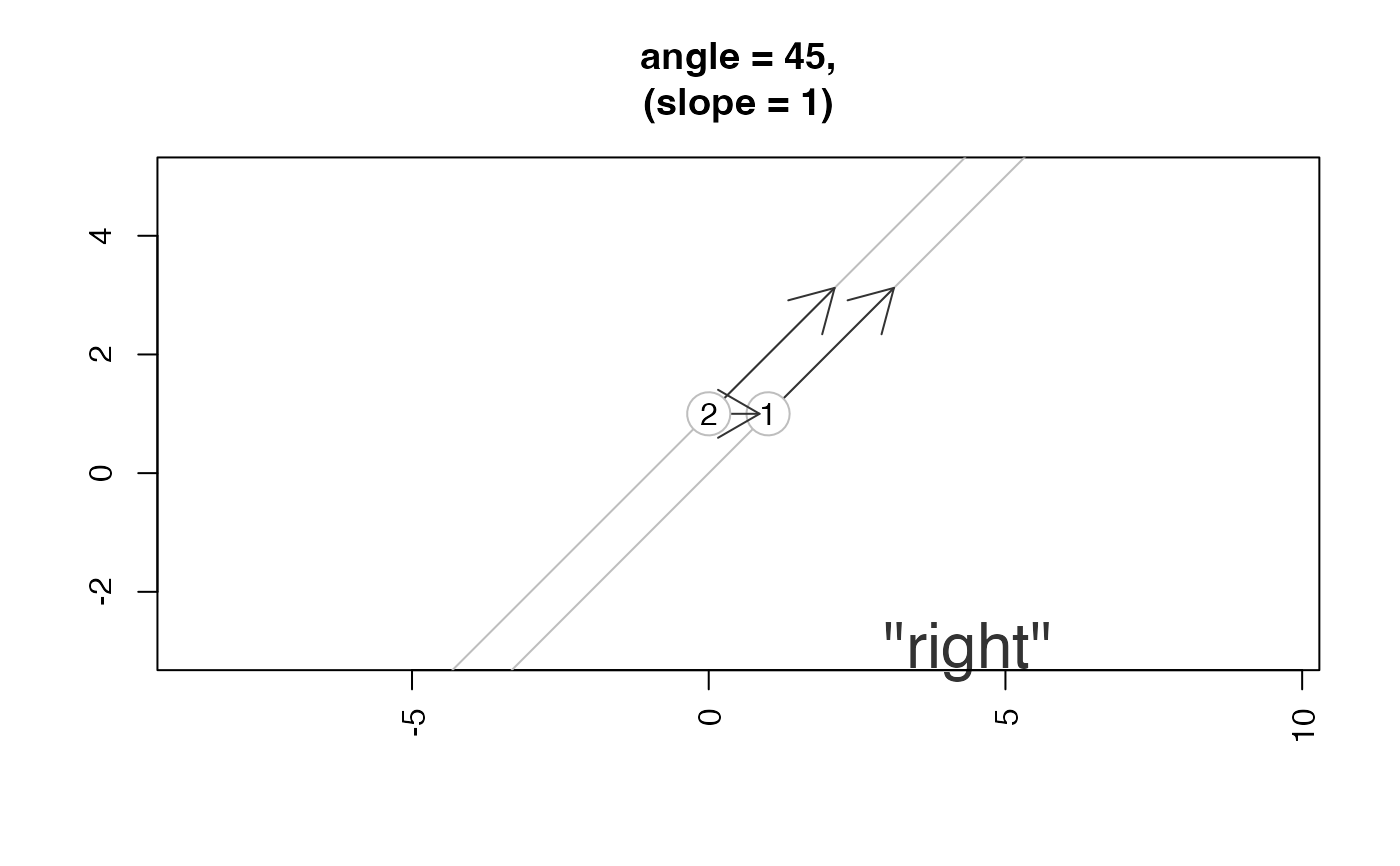
point_handedness(pt1, pt2, angle=45, do_plot=TRUE)
#> [,1] [,2]
#> [1,] 1 1
#> [1] ""
#> [1] "right"
title(main="angle = 45,\n(slope = 1)")
#> [,1] [,2]
#> [1,] 0 1
#> [2,] -1 0
#> [1] "A:" "B:"
#> [1] "left" "right"
point_handedness(pt1, pt2, angle=45, do_plot=TRUE)
#> [,1] [,2]
#> [1,] 1 1
#> [1] ""
#> [1] "right"
title(main="angle = 45,\n(slope = 1)")
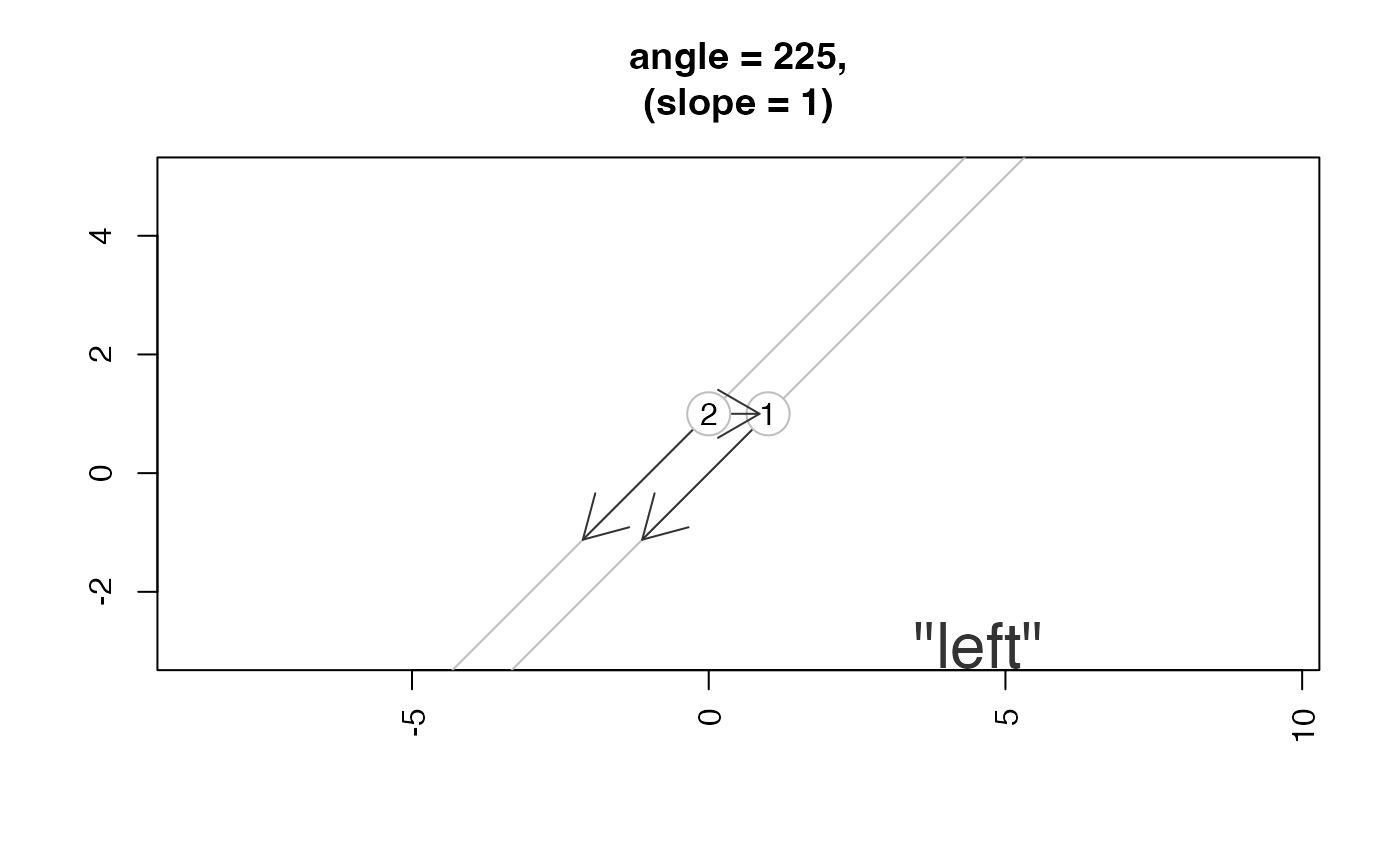
 point_handedness(pt1, pt2, angle=45 + 180, do_plot=TRUE)
#> [,1] [,2]
#> [1,] 1 1
#> [1] ""
#> [1] "left"
title(main="angle = 225,\n(slope = 1)")
point_handedness(pt1, pt2, angle=45 + 180, do_plot=TRUE)
#> [,1] [,2]
#> [1,] 1 1
#> [1] ""
#> [1] "left"
title(main="angle = 225,\n(slope = 1)")
 point_handedness(pt1, pt2, slope=Inf, do_plot=TRUE)
#> [,1] [,2]
#> [1,] 1 1
#> [1] ""
#> [1] "right"
title(main="slope = Inf")
point_handedness(pt1, pt2, slope=Inf, do_plot=TRUE)
#> [,1] [,2]
#> [1,] 1 1
#> [1] ""
#> [1] "right"
title(main="slope = Inf")
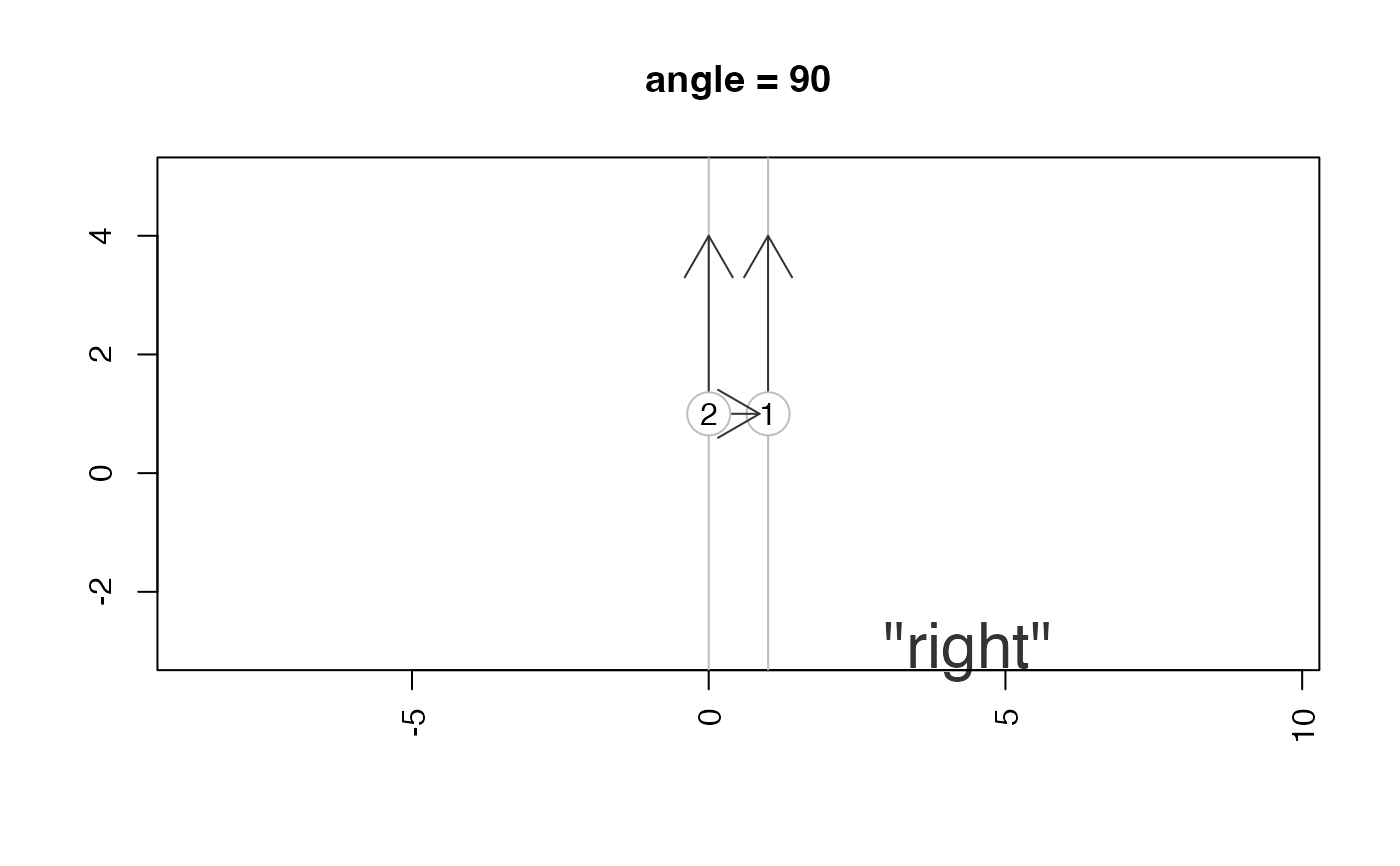
 point_handedness(pt1, pt2, angle=90, do_plot=TRUE)
#> [,1] [,2]
#> [1,] 1 1
#> [1] ""
#> [1] "right"
title(main="angle = 90")
point_handedness(pt1, pt2, angle=90, do_plot=TRUE)
#> [,1] [,2]
#> [1,] 1 1
#> [1] ""
#> [1] "right"
title(main="angle = 90")
 point_handedness(pt2, pt1, slope=-Inf, do_plot=TRUE)
#> [,1] [,2]
#> [1,] 0 1
#> [1] ""
#> [1] "right"
title(main="slope = -Inf")
point_handedness(pt2, pt1, slope=-Inf, do_plot=TRUE)
#> [,1] [,2]
#> [1,] 0 1
#> [1] ""
#> [1] "right"
title(main="slope = -Inf")
 point_handedness(pt2, pt1, angle = 270, do_plot=TRUE)
#> [,1] [,2]
#> [1,] 0 1
#> [1] ""
#> [1] "right"
title(main="angle = 270")
point_handedness(pt2, pt1, angle = 270, do_plot=TRUE)
#> [,1] [,2]
#> [1,] 0 1
#> [1] ""
#> [1] "right"
title(main="angle = 270")
 point_handedness(pt1, pt2, slope=0, do_plot=TRUE)
 #> [,1] [,2]
#> [1,] 1 1
#> [1] ""
#> [1] "right"
point_handedness(pt2, pt1, slope=0, do_plot=TRUE)
#> [,1] [,2]
#> [1,] 1 1
#> [1] ""
#> [1] "right"
point_handedness(pt2, pt1, slope=0, do_plot=TRUE)
 #> [,1] [,2]
#> [1,] 0 1
#> [1] ""
#> [1] "right"
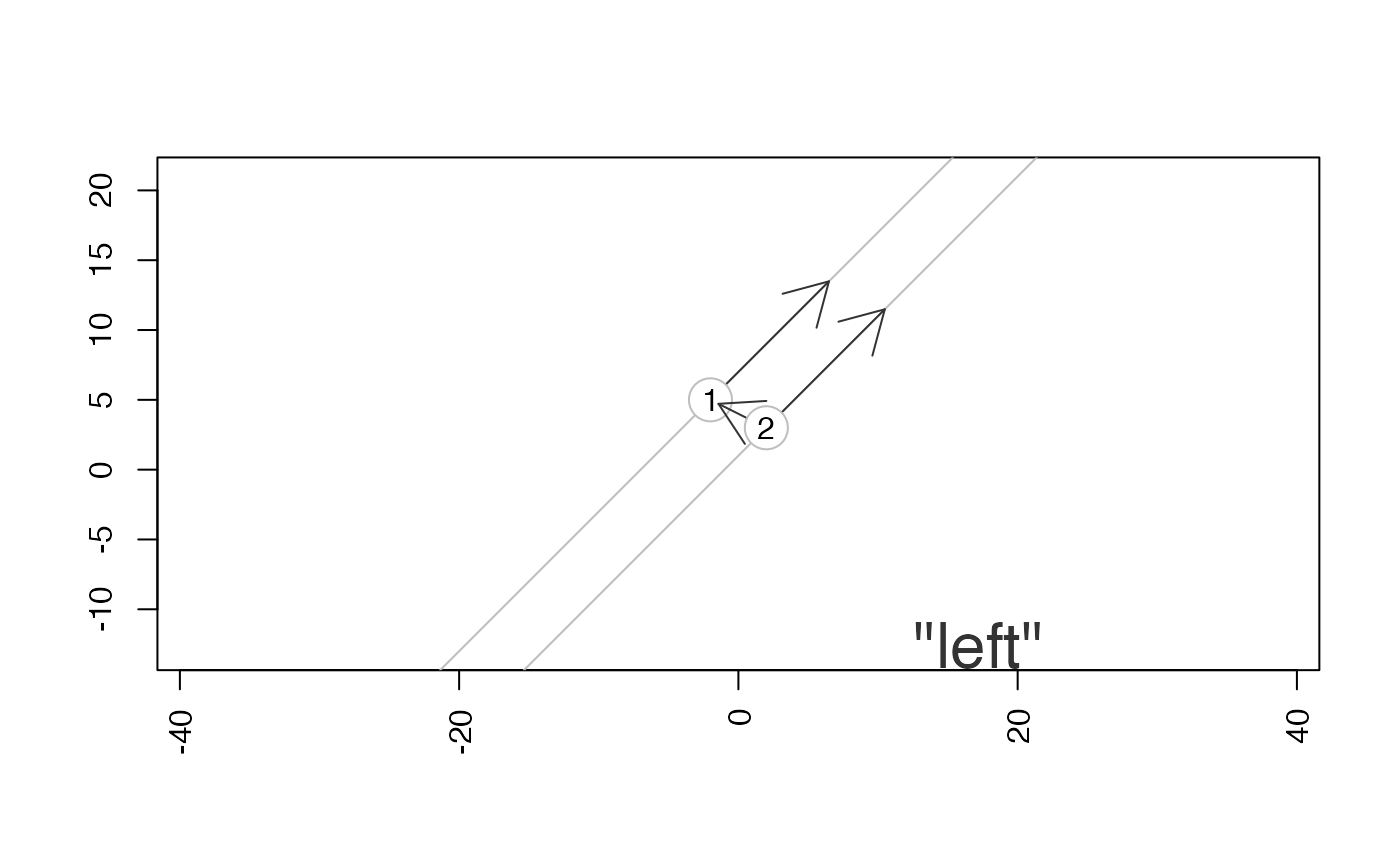
pt1 <- matrix(ncol=2, c(-2, 5))
pt2 <- matrix(ncol=2, c(2, 3))
point_handedness(pt1, pt2, slope=1, do_plot=TRUE)
#> [,1] [,2]
#> [1,] 0 1
#> [1] ""
#> [1] "right"
pt1 <- matrix(ncol=2, c(-2, 5))
pt2 <- matrix(ncol=2, c(2, 3))
point_handedness(pt1, pt2, slope=1, do_plot=TRUE)
 #> [,1] [,2]
#> [1,] -2 5
#> [1] ""
#> [1] "left"
point_handedness(pt1, pt2, slope=-1, do_plot=TRUE)
#> [,1] [,2]
#> [1,] -2 5
#> [1] ""
#> [1] "left"
point_handedness(pt1, pt2, slope=-1, do_plot=TRUE)
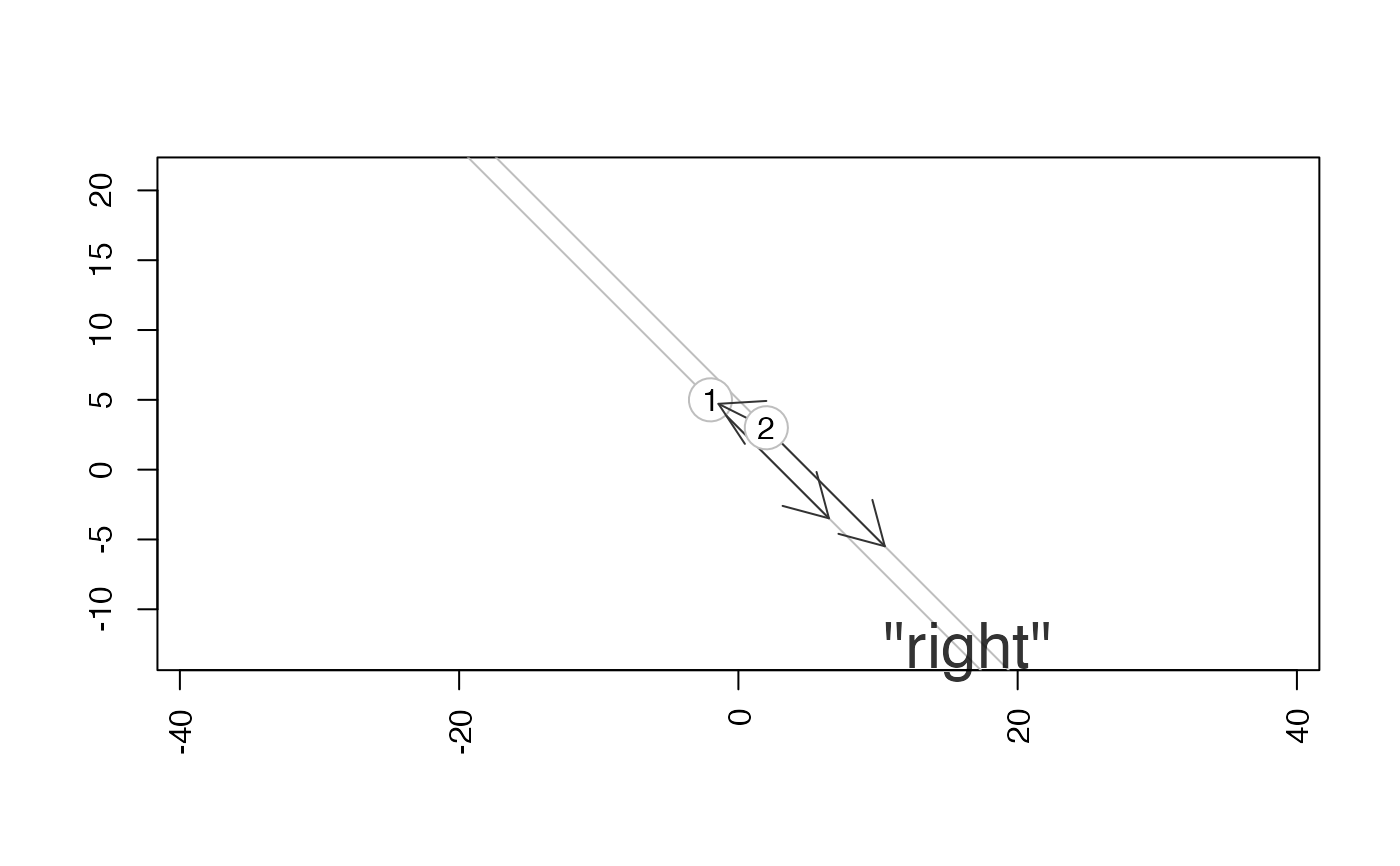 #> [,1] [,2]
#> [1,] -2 5
#> [1] ""
#> [1] "right"
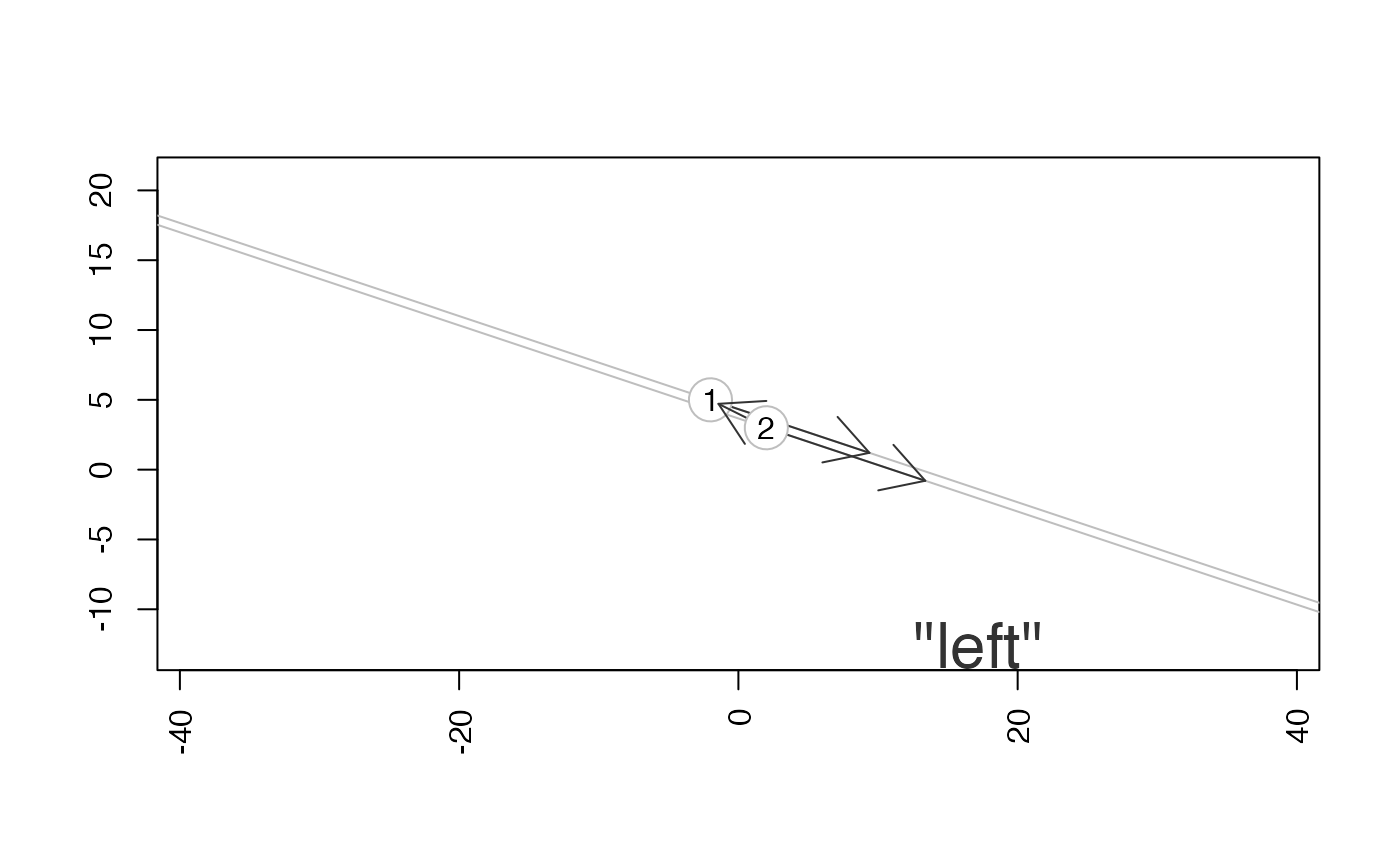
point_handedness(pt1, pt2, slope=-1/3, do_plot=TRUE)
#> [,1] [,2]
#> [1,] -2 5
#> [1] ""
#> [1] "right"
point_handedness(pt1, pt2, slope=-1/3, do_plot=TRUE)
 #> [,1] [,2]
#> [1,] -2 5
#> [1] ""
#> [1] "left"
point_handedness(pt1, pt2, slope=-1/3, do_plot=TRUE)
#> [,1] [,2]
#> [1,] -2 5
#> [1] ""
#> [1] "left"
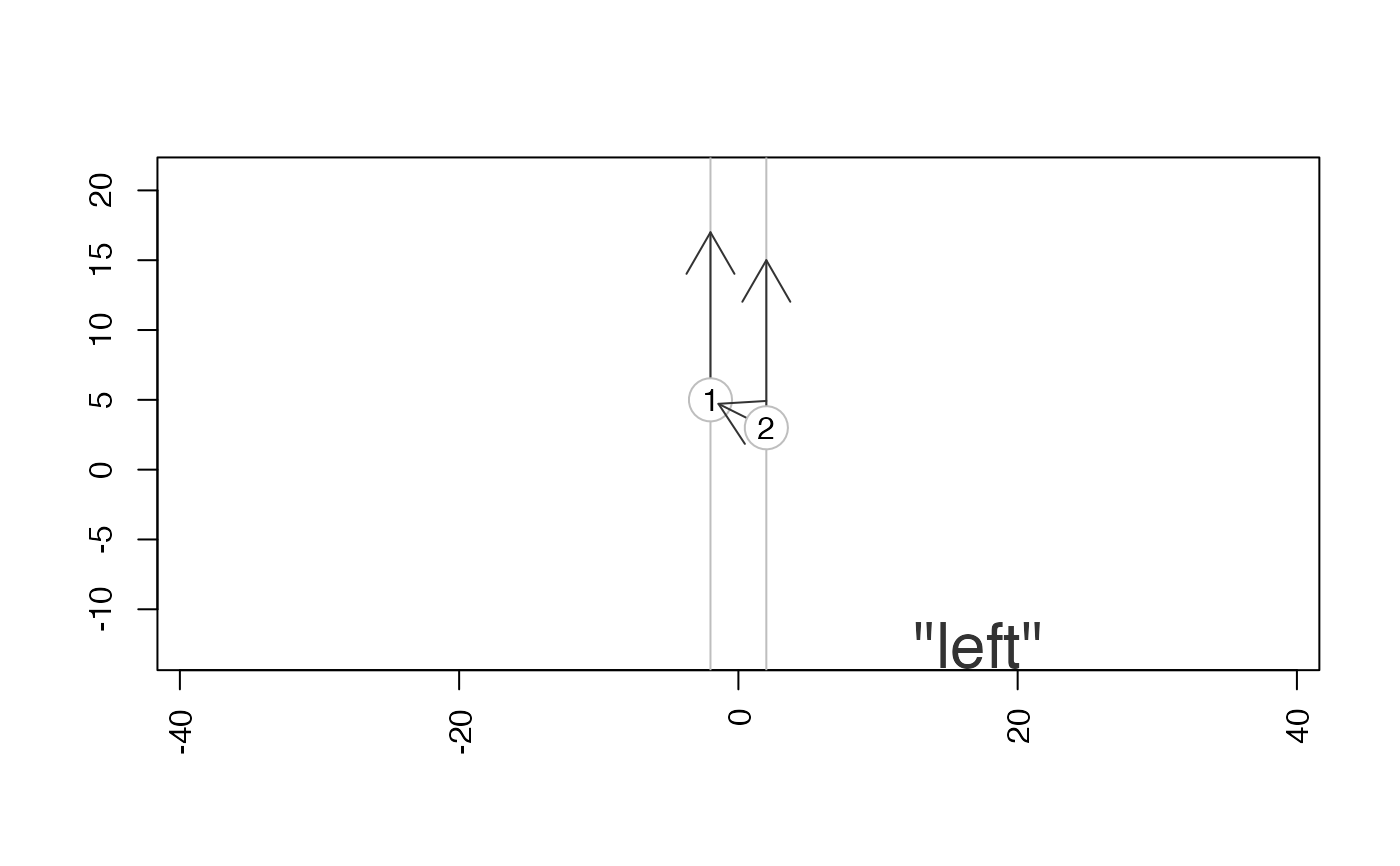
point_handedness(pt1, pt2, slope=Inf, do_plot=TRUE)
#> [,1] [,2]
#> [1,] -2 5
#> [1] ""
#> [1] "left"
point_handedness(pt1, pt2, slope=-1/3, do_plot=TRUE)
#> [,1] [,2]
#> [1,] -2 5
#> [1] ""
#> [1] "left"
point_handedness(pt1, pt2, slope=Inf, do_plot=TRUE)
 #> [,1] [,2]
#> [1,] -2 5
#> [1] ""
#> [1] "left"
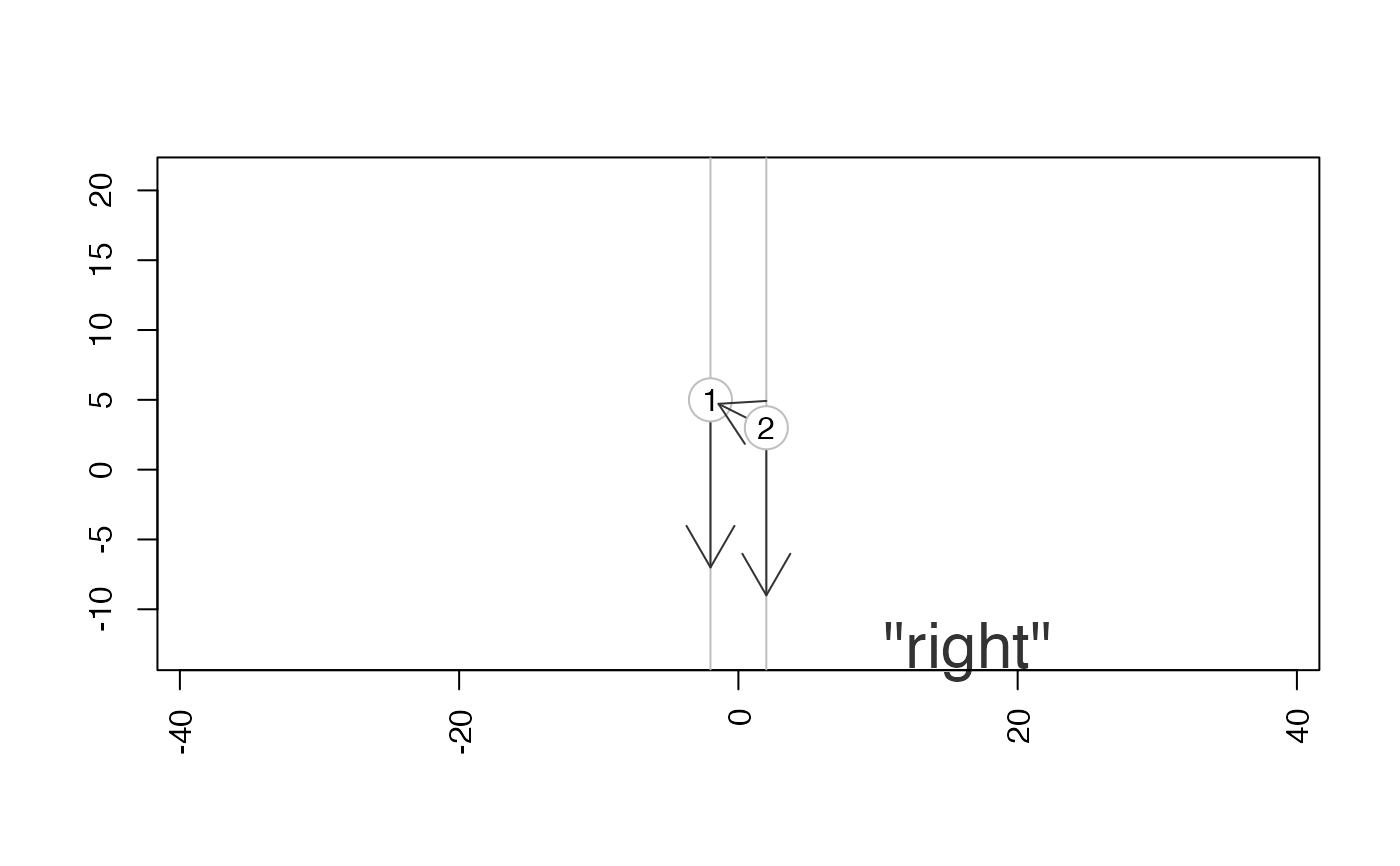
point_handedness(pt1, pt2, slope=-Inf, do_plot=TRUE)
#> [,1] [,2]
#> [1,] -2 5
#> [1] ""
#> [1] "left"
point_handedness(pt1, pt2, slope=-Inf, do_plot=TRUE)
 #> [,1] [,2]
#> [1,] -2 5
#> [1] ""
#> [1] "right"
#> [,1] [,2]
#> [1,] -2 5
#> [1] ""
#> [1] "right"