Jam default theme for ggplot2
Usage
theme_jam(
  theme_default = ggplot2::theme_bw,
  base_size = 18,
  use_rainbowJam = TRUE,
  darken_colour = FALSE,
  grid.major.size = 0.5,
  grid.minor.size = 0.25,
  strip.background.colour = "grey30",
  strip.background.fill = "lightgoldenrod1",
  strip.text.size = ggplot2::rel(14.18),
  panel.grid.major.colour = "grey80",
  panel.grid.minor.colour = "grey90",
  panel.background = ggplot2::element_rect(fill = "white", colour = NA),
  panel.border = ggplot2::element_rect(fill = NA, colour = "grey15"),
  axis.text.x.angle = 60,
  blankGrid = FALSE,
  blankXgrid = FALSE,
  blankYgrid = FALSE,
  resetTheme = TRUE,
  verbose = FALSE,
  ...
)
Arguments
- theme_default
functionrepresenting a ggplot2 theme.- base_size
numericdefault font point size, used for scaling the overall text sizes larger or smaller.- use_rainbowJam
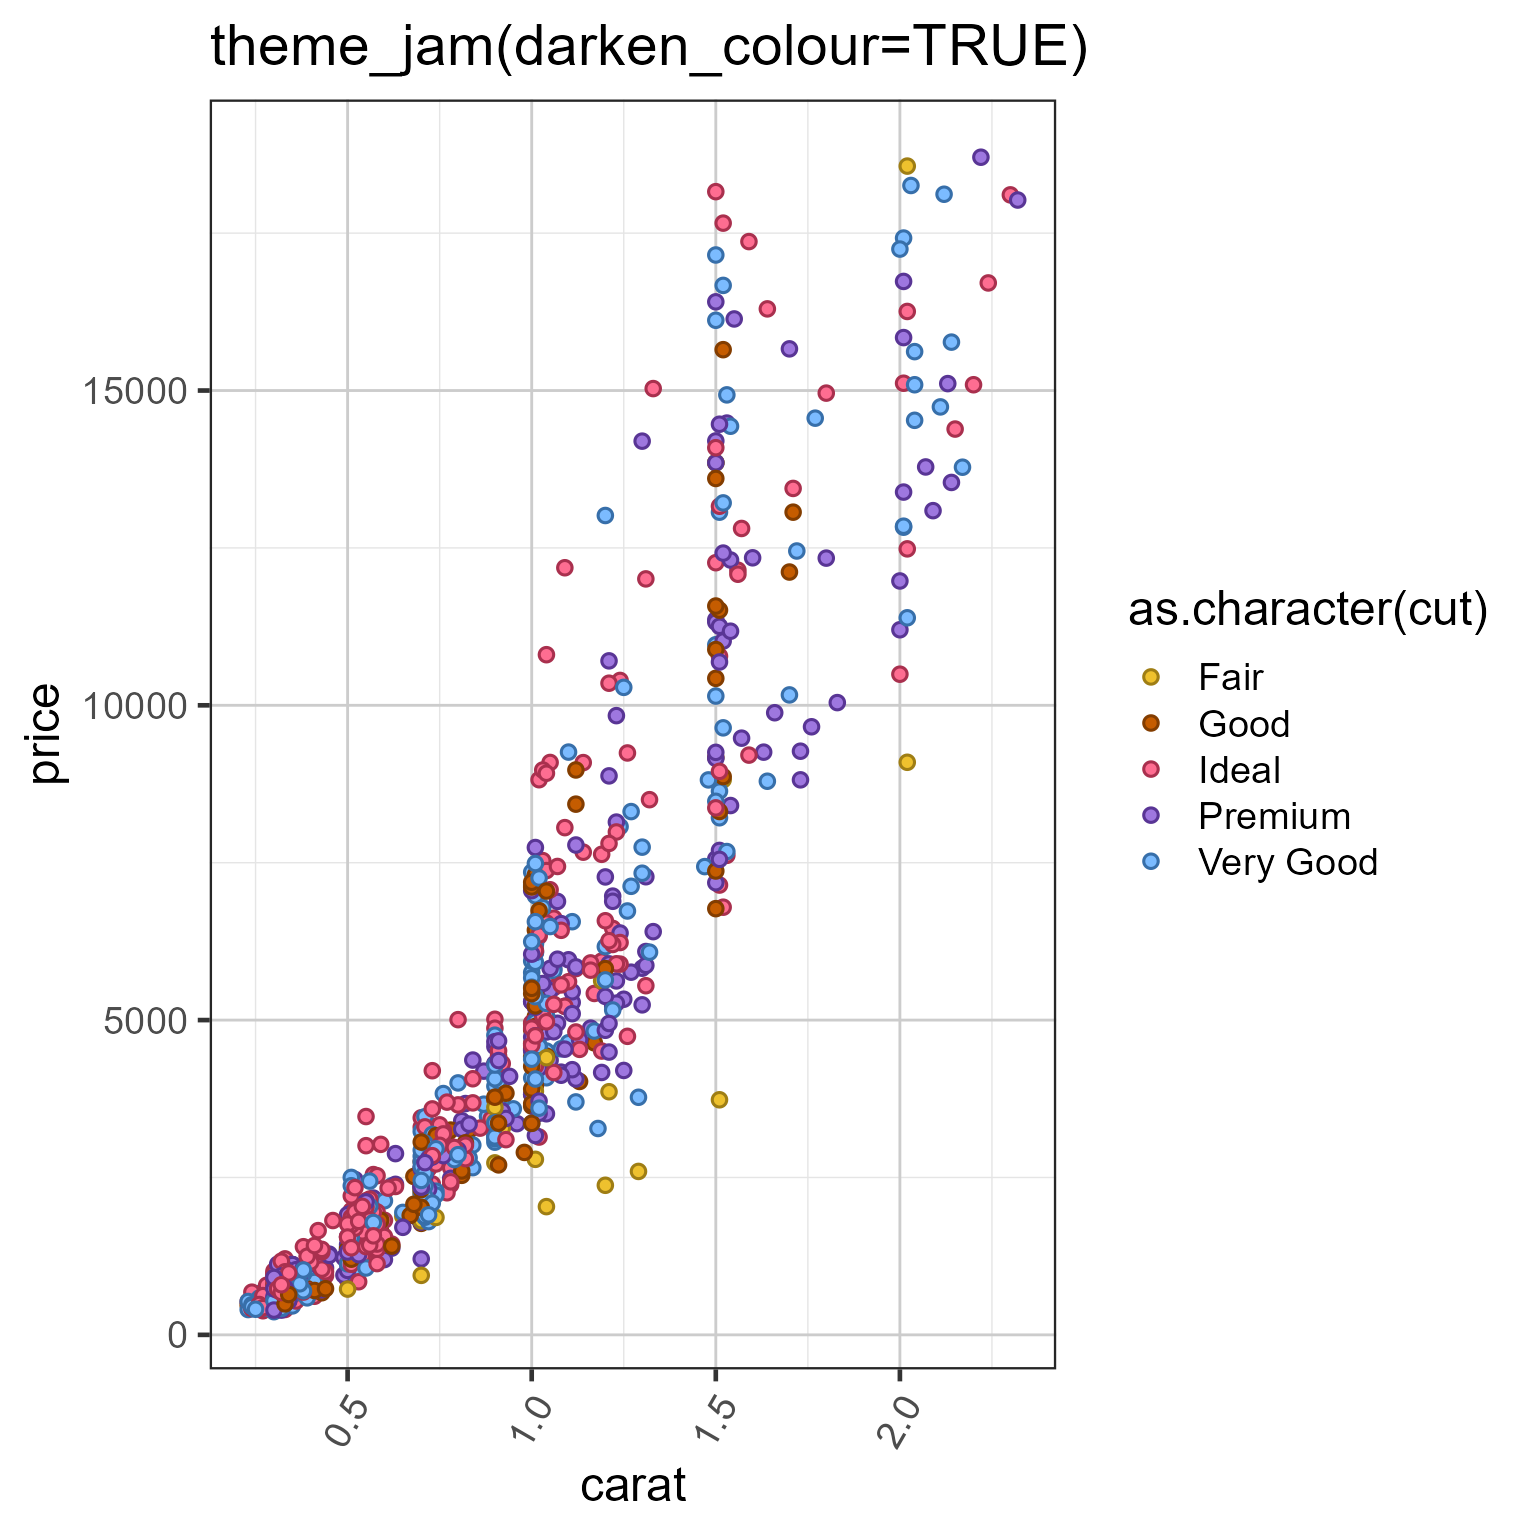
logicaldefault TRUE, whether to use colorjam for default categorical/discrete colors in ggplot2 version 4.0.0+.- darken_colour
logicaldefault FALSE, whenuse_rainbowJam=TRUEit optionally darkens the 'colour' palette, useful when applying slightly darked outline color together with 'fill' color. See Examples.- grid.major.size, grid.minor.size
numericdefaults 0.5, 0.25 the line width for the major and minor grid lines, respectively. Set to 0 to suppress either, or use 'blankGrid' or 'blankXgrid' or 'blankYgrid' arguments.- strip.background.colour, strip.background.fill
charactercolor for the border and strip background itself when ggplot2 is using a faceted layout. Default is black border and 'lightgoldenrod1' strip fill color.- strip.text.size
numericor relative classggplot2::rel()to define direct or relative text font size, respectively. Default is '14/18' to convert default base_size=18 to font size 14 point.- panel.grid.major.colour, panel.grid.minor.colour
charactercolors for the major and minor grid lines, respectively. Defaults are 'grey80' and 'grey90', respectively.- panel.background, panel.border
element_rectorNULLindicating the type of background or border to draw around each plot panel. When set toNULLit is set toggplot2::element_blank()which displays nothing. Default uses white panel background fill with black border.- axis.text.x.angle
numericdegrees to rotate x-axis labels, default 60 degrees.Starts at 0 (horizontal) and goes counter-clockwise so that 60 show labels tilted down-left.- blankGrid, blankXgrid, blankYgrid
logicaldefault FALSE, whether to have a blank grid for everything, major, or minor axis lines, respectively. Intended for convenience to remove gridlines.- resetTheme
logicalwhether to callggplot2::theme_defaultwhich replaces all previous ggplot2 theme settings with those defined in the theme function. IfFALSEthen only the specific settings defined in this function will be applied.- verbose
logicalindicating whether to print verbose output.- ...
additional arguments are passed to
ggplot2::theme(), and optionally tojam_pal()whenuse_rainbowJam=TRUE. Arguments are filtered to match named arguments in respective functions, by callingjamba::call_fn_ellipsis(). In other words, adding arguments to '...' should be safe even when the argument is not present inggplot2::theme().
Details
This function applies some default theme settings to ggplot2, mainly taking away the default grey newspaper background color, also rotates the x-axis label text to 60 degrees, to accomodate longer labels without overlaps.
See also
Other colorjam ggplot2:
scale_color_div_xf(),
scale_color_jam(),
scale_color_linear_xf(),
scale_fill_jam()
Examples
if (jamba::check_pkg_installed("ggplot2")) {
set.seed(123)
dsamp <- ggplot2::diamonds[sample(nrow(ggplot2::diamonds), 1000),];
d <- ggplot2::ggplot(dsamp,
ggplot2::aes(carat, price)) +
ggplot2::geom_point(
ggplot2::aes(colour=as.character(cut)),
size=2);
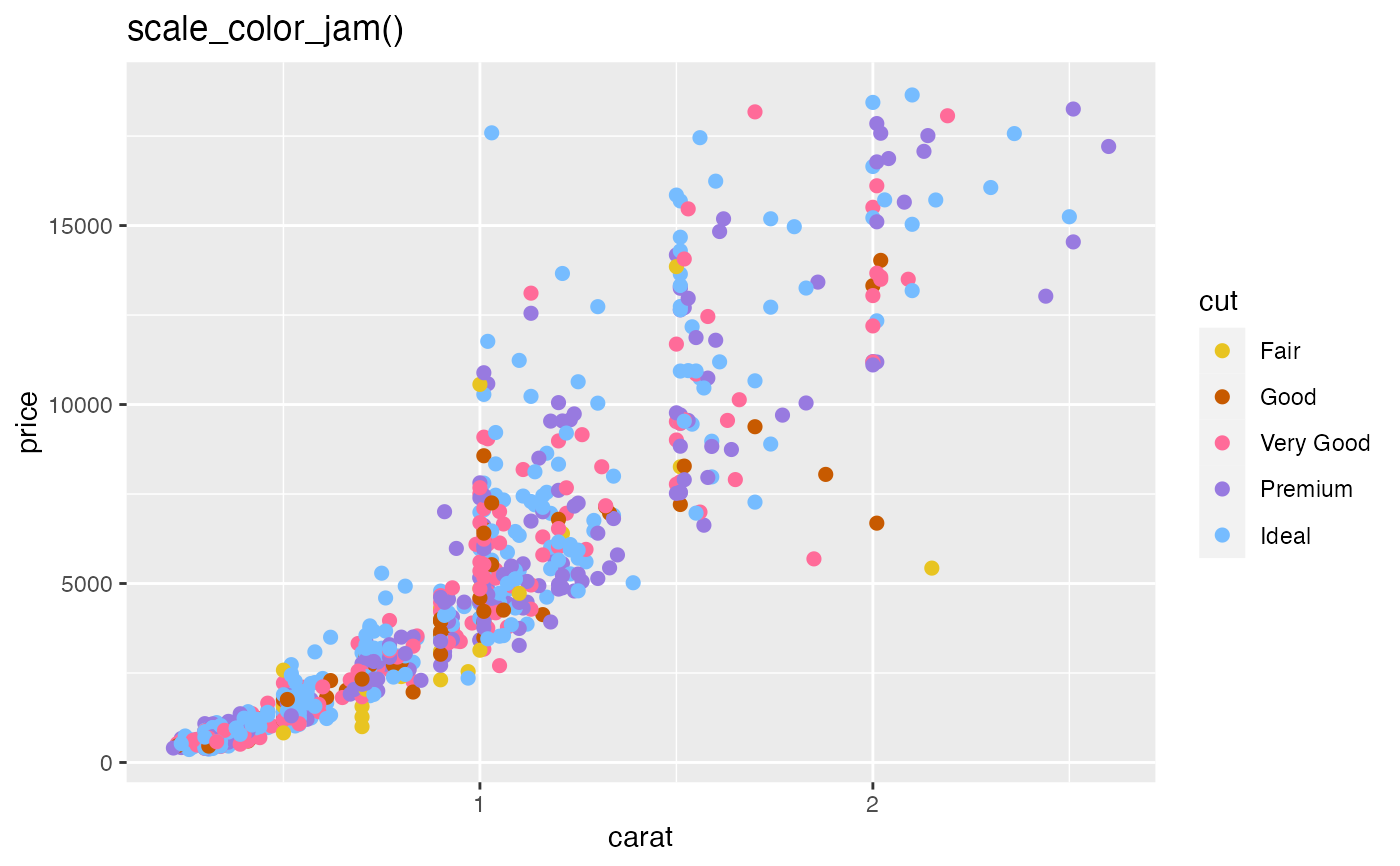
print(d +
scale_color_jam() +
ggplot2::ggtitle("scale_color_jam()"));
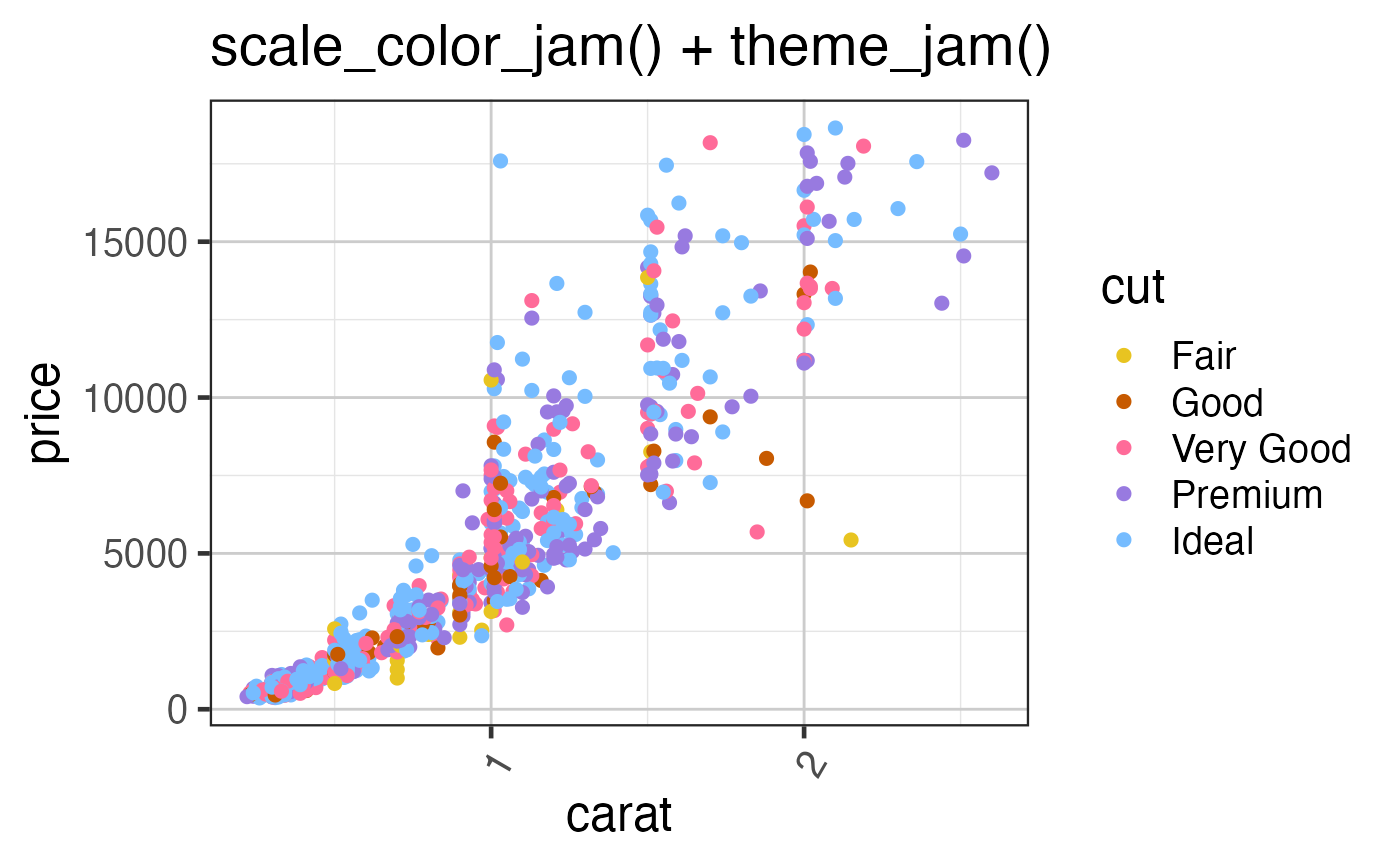
print(d +
theme_jam() +
ggplot2::ggtitle("theme_jam()"));
d2 <- ggplot2::ggplot(dsamp,
ggplot2::aes(carat, price)) +
ggplot2::geom_point(
shape="circle filled",
ggplot2::aes(colour=as.character(cut),
fill=as.character(cut)),
size=2);
print(d2 +
theme_jam(darken_colour=TRUE) +
ggplot2::ggtitle("theme_jam(darken_colour=TRUE)"));
}