Rank-Count plot
rank_count_plot(x, log = c("x", "y"), flip_axes = FALSE,
  highlight_range = NULL, ...)
Arguments
| x | numeric or integer vector of counts |
|---|---|
| log | character vector indicating the axis or axes
log-transform, with any presence of |
| flip_axes | logical indicating whether to flip the x- and y-axis coordinates. |
| highlight_range | optional numeric range to highlight, intended to represent the range of counts selected for downstream analysis. |
| ... | additional arguments are ignored |
Value
ggplot object sufficient to plot the Rank-Count
data, including the optional highlighted points based
upon the highlight_range values.
Details
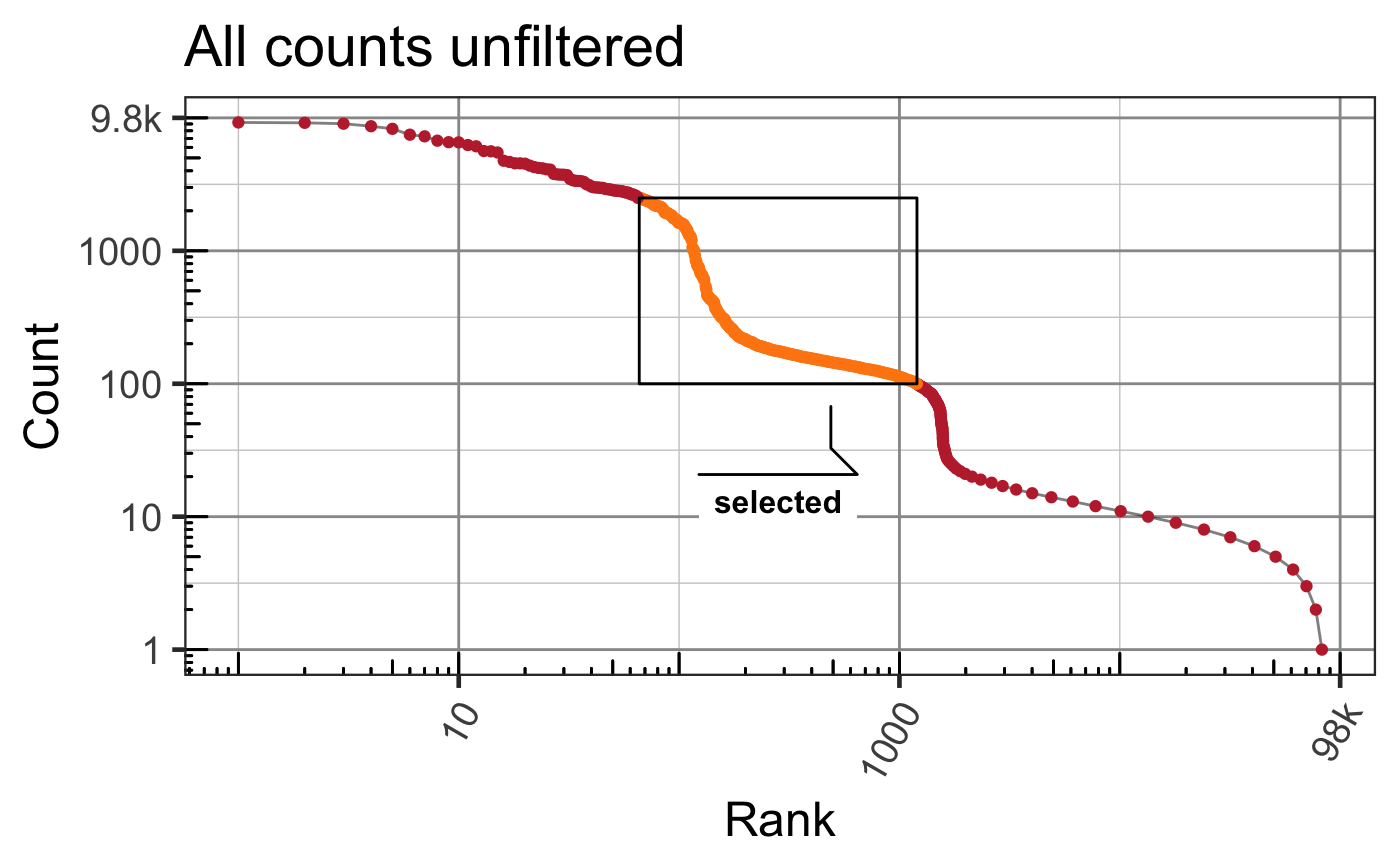
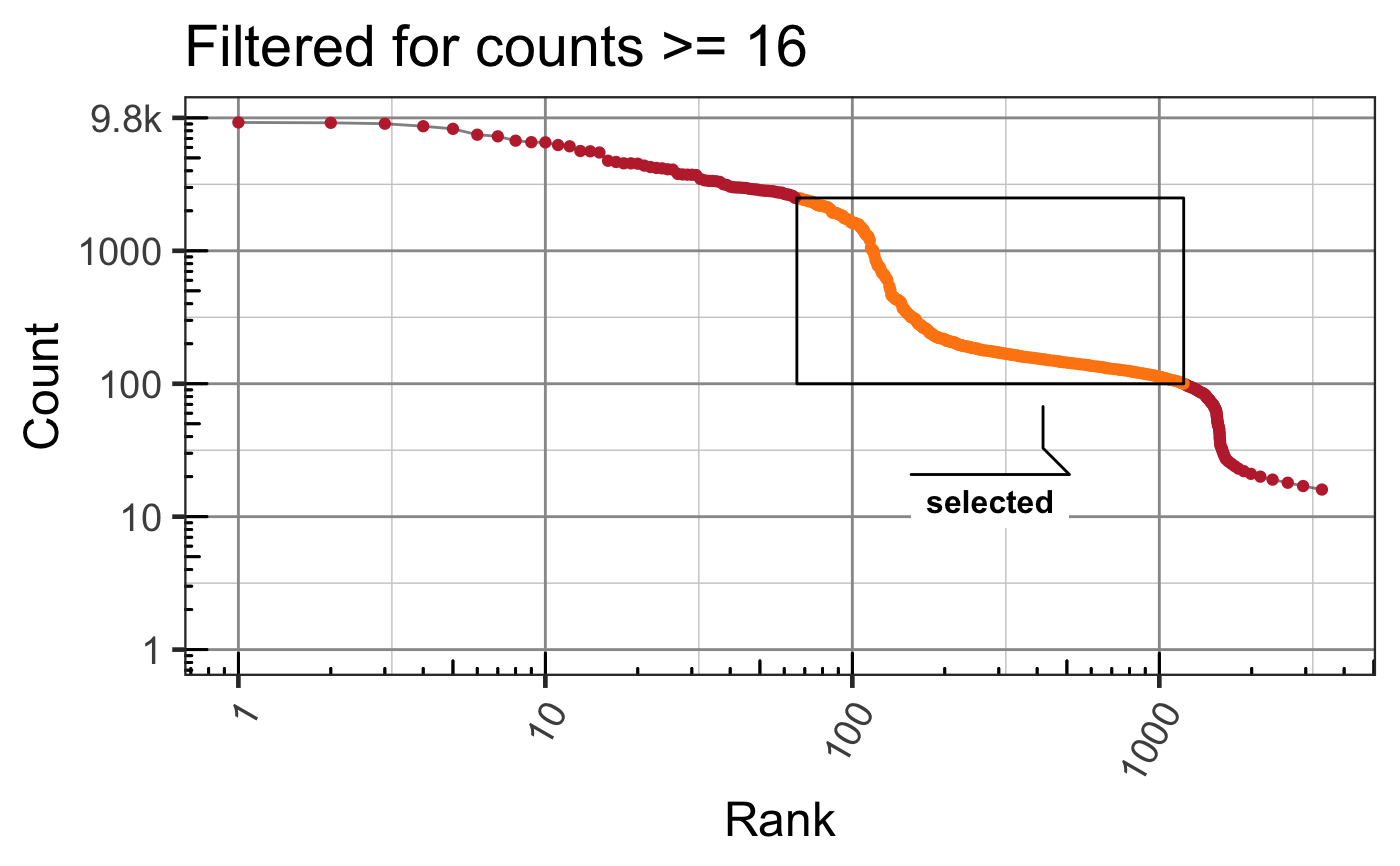
This function creates a classic "knee plot" showing
"Rank" on the x-axis, and "Count" on the y-axis,
typically with log-scaled x- and y-axes.
See also
Other SALSA visualization functions: plot_fr_wei
Examples
library(salsa); data(oz2_numi_per_cell); usecounts <- sort(oz2_numi_per_cell$count); rank_count_plot(usecounts, highlight_range=c(100,2500)) + ggtitle("All counts unfiltered");# after filtering, it may help add y=1 to the axis range usecounts <- usecounts[usecounts >= 16]; rank_count_plot(usecounts, highlight_range=c(100,2500)) + expand_limits(y=c(1,NA)) + ggtitle("Filtered for counts >= 16");

