Apply noise floor and ceiling to numeric vector
Usage
noiseFloor(
  x,
  minimum = 0,
  newValue = minimum,
  adjustNA = FALSE,
  ceiling = NULL,
  newCeiling = ceiling,
  ...
)
Arguments
- x
numericvector or matrix- minimum
numericfloor value- newValue
numeric, by default the same as the floor value. Sometimes it can be useful to define a different value, one example is to define values asNA, or another distinct number away from the floor.- adjustNA
logicalwhether to changeNAvalues to thenewValue.- ceiling
numericvalue, optionally a ceiling. If defined, then values above the ceiling value are set tonewCeiling.- newCeiling
numericvalue when ceiling is defined, values above the ceiling are set to thisnumericvalue.- ...
additional parameters are ignored.
Value
numeric vector or matrix, matching the input type x
where numeric values are fixed to the minimum and ceiling
values as defined by newValue and newCeiling, respectively.
Details
A noise floor is useful when detected numeric values are sometimes below a clear noise threshold, and where some downstream ratio may be calculated using these values. Applying a noise floor ensures the ratios and not artificially higher, especially in cases where the values involved are least reliable. This procedure is expected to produce more conservative and appropriate ratios in that scenario.
A ceiling is similar, values above the ceiling are set to the ceiling,
which is practical when values above a certain threshold are conceptually
similar to those at the threshold. One clear example is plotting
-log10(Pvalue) when the range of P-values might approach 1e-1000.
In this case, setting a ceiling of 50 conceptually equates P-values
below 1e-50, while also restricting the axis range of a plot.
The ability to set values at the floor to a different value, using
newValue different from minimum, is intended to allow separation
of numeric values from the floor for illustrative purposes.
See also
Other jam numeric functions:
deg2rad(),
normScale(),
rad2deg(),
rowGroupMeans(),
rowRmMadOutliers(),
warpAroundZero()
Examples
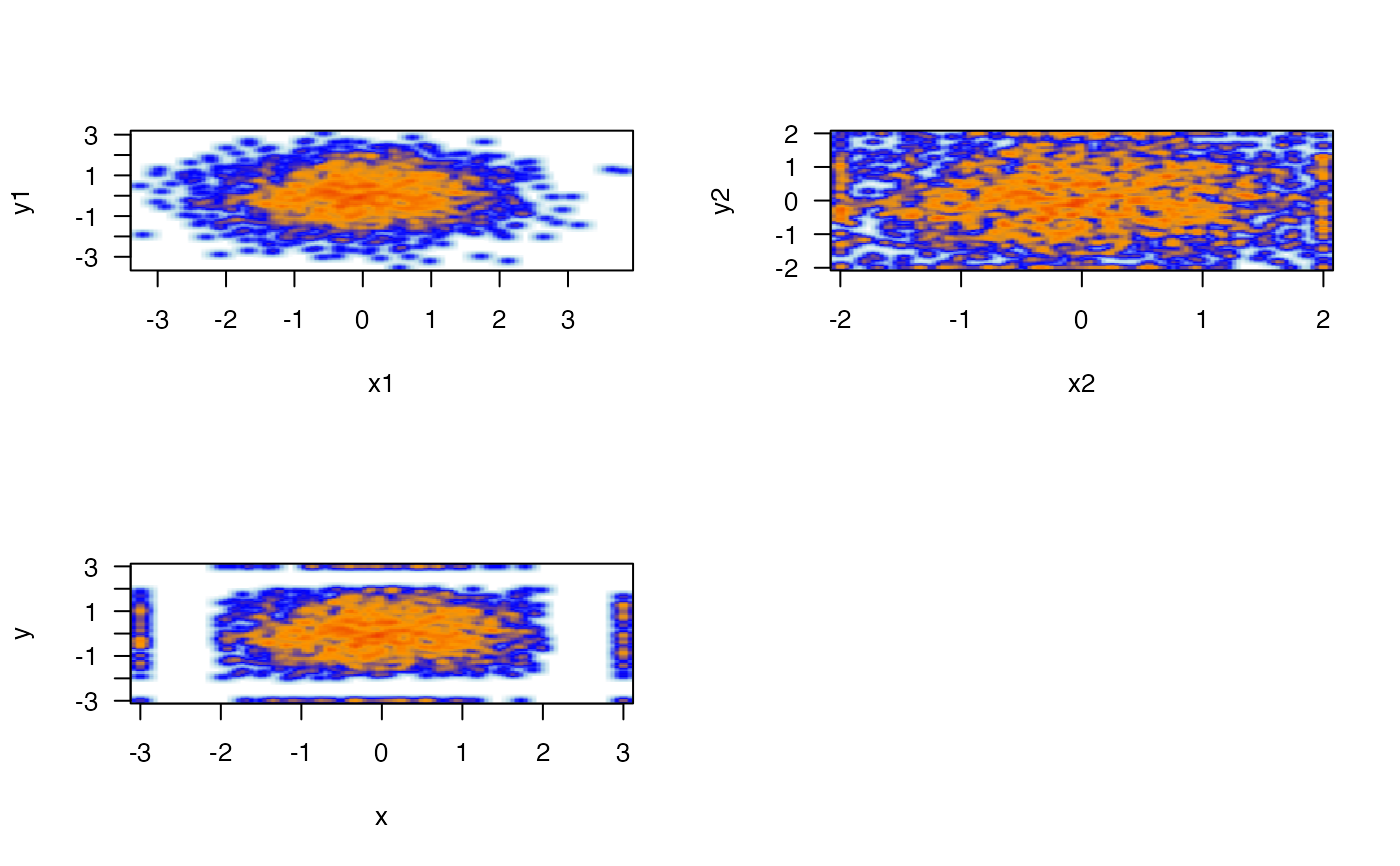
# start with some random data
n <- 2000;
x1 <- stats::rnorm(n);
y1 <- stats::rnorm(n);

# apply noise floor and ceiling
x2 <- noiseFloor(x1, minimum=-2, ceiling=2);
y2 <- noiseFloor(y1, minimum=-2, ceiling=2);

# apply noise floor and ceiling with custom replacement values
xm <- cbind(x=x1, y=y1);
xm3 <- noiseFloor(xm,
   minimum=-2, newValue=-3,
   ceiling=2, newCeiling=3);

withr::with_par(list("mfrow"=c(2,2)), {
plotSmoothScatter(x1, y1);
plotSmoothScatter(x2, y2);
plotSmoothScatter(xm3);
})