Produce smooth scatter plot, a helper function called by
plotSmoothScatter().
Usage
smoothScatterJam(
  x,
  y = NULL,
  nbin = 256,
  bandwidth,
  colramp = grDevices::colorRampPalette(c("white", "lightblue", "blue", "orange",
    "orangered2")),
  nrpoints = 100,
  pch = ".",
  cex = 1,
  col = "black",
  transformation = function(x) x^0.25,
  postPlotHook = graphics::box,
  xlab = NULL,
  ylab = NULL,
  xlim,
  ylim,
  add = FALSE,
  xaxs = graphics::par("xaxs"),
  yaxs = graphics::par("yaxs"),
  xaxt = graphics::par("xaxt"),
  yaxt = graphics::par("yaxt"),
  useRaster = NULL,
  ...
)
Arguments
- x
numericvector, or data matrix with two or more columns.- y
numericvector, or if data is supplied via x as a matrix, y is NULL.- nbin
integernumber of bins to use when converting the kernel density result (which uses bandwidthN above) into a usable image. For example, nbin=123 is the default used bygraphics::smoothScatter(), however theplotSmoothScatter()function default is higher (256).- bandwidth
numericvector used to define the y- and x-axis bandwidths, respectively, passed toKernSmooth::bkde2D(), which calculates the underlying 2-dimensional kernel density. TheplotSmoothScatter()function was motivated by never wanting to define this number directly, instead auto-calculation suitable values.- colramp
functionthat takes onenumericargument and returns that integer number of colors, by default 256.- nrpoints
integernumber of outlier datapoints to display, as defined bygraphics::smoothScatter(), however the default here isnrpoints=0to avoid additional clutter in the output, and because the default argumentbandwidthNusually indicates all individual points.- pch
integerpoint shape used whennrpoints>0.- cex
numericpoint size expansion factor used whennrpoints>0.- col
characterR color used whennrpoints>0.- transformation
functionwhich converts point density to a number, typically related to square root or cube root transformation.- postPlotHook
functionor 'NULL', NULL default. Whenfunctionis supplied, it is called after producing the image. By default it is simply used to draw a box around the image, but could be used to layer additional information atop the image plot, for example contours, labels, etc.- xlab
characterx-axis label- ylab
charactery-axis label- xlim
numericx-axis range for the plot- ylim
numericy-axis range for the plot- add
logicalwhether to add to an existing active R plot, or create a new plot window.- xaxs
charactervalue compatible withgraphics::par("xaxs"), mainly useful for suppressing the x-axis, in order to produce a custom x-axis range, most useful to restrict the axis range expansion done by R by default.- yaxs
charactervalue compatible withgraphics::par("yaxs"), mainly useful for suppressing the y-axis, in order to produce a custom y-axis range, most useful to restrict the axis range expansion done by R by default.- xaxt
charactervalue compatible withgraphics::par("xaxt"), mainly useful for suppressing the x-axis, in order to produce a custom x-axis by other mechanisms, e.g. log-scaled x-axis tick marks.- yaxt
charactervalue compatible withgraphics::par("yaxt"), mainly useful for suppressing the y-axis, in order to produce a custom y-axis by other mechanisms, e.g. log-scaled y-axis tick marks.- useRaster
'NULL' or
logicalindicating whether to invokegraphics::rasterImage()to produce a raster image. If NULL, it determines whether to produce a raster image within theimageDefault()function, which checks the options usinggetOption("preferRaster", FALSE)to determine among other things, whether the user prefers raster images, and if thegrDevices::dev.capabilities()supports raster.- ...
additional arguments are passed to
imageDefault()and optionally toplotPlotHook()when supplied.
Value
list of elements sufficient to call graphics::image(),
also by default this function is called for the byproduct of
creating a figure.
Details
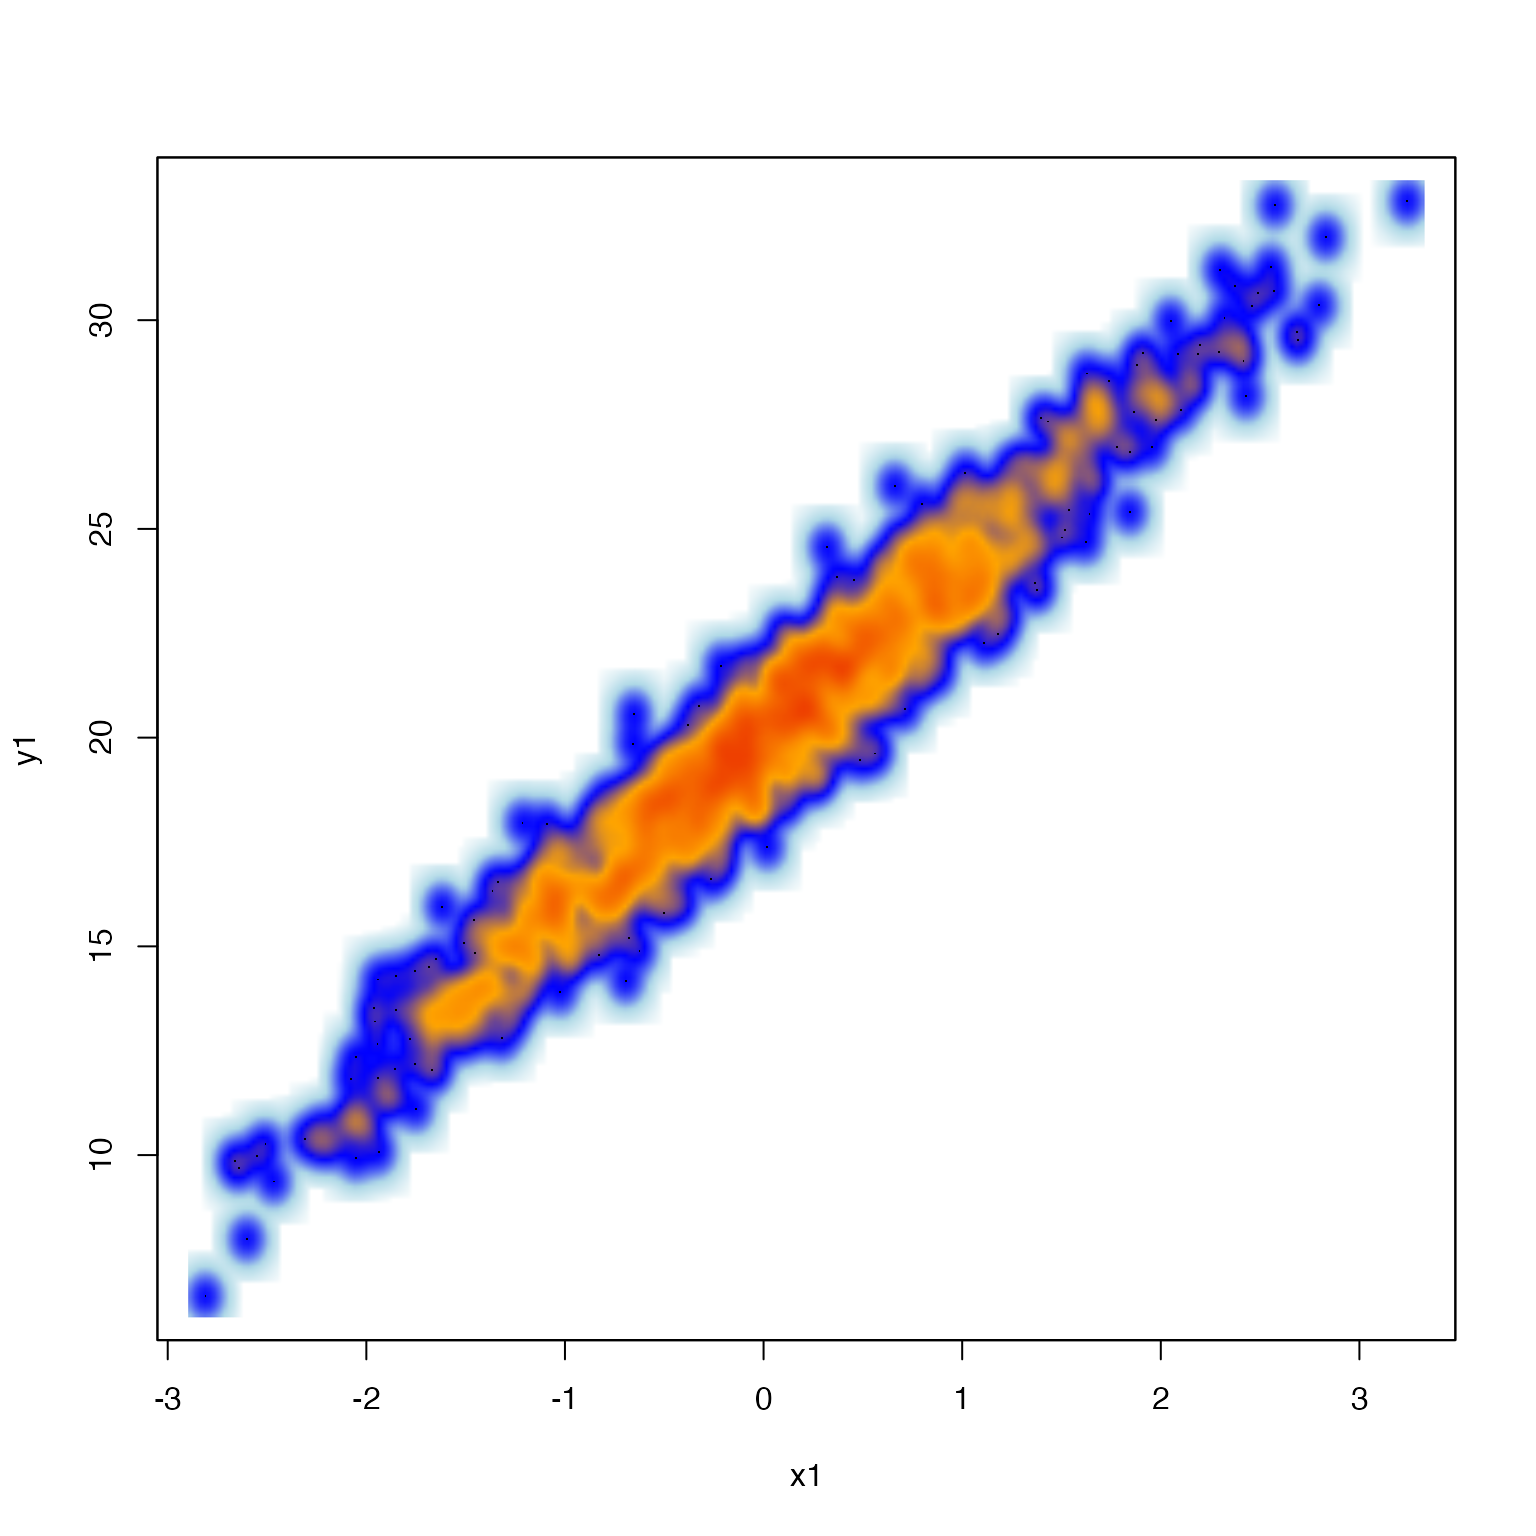
For general purposes, use plotSmoothScatter() as a replacement
for graphics::smoothScatter(), which produces better default
settings for pixel size and density bandwidth.
This function is only necessary in order to override the
graphics::smoothScatter() function which calls
graphics::image.default().
Instead, this function calls imageDefault() which is required
in order to utilize custom raster image scaling, particularly important
when the x- and y-axis ranges are not similar, e.g. where the x-axis spans
10 units, but the y-axis spans 10,000 units.
See also
Other jam internal functions:
handleArgsText(),
jamCalcDensity(),
make_html_styles(),
make_styles()