Rectangle with color gradient fill
gradient_rect(
  xleft,
  ybottom,
  xright,
  ytop,
  col,
  gradient = "x",
  border = par("fg"),
  ...
)
Arguments
- xleft, ybottom, xright, ytop
numericvectors indicating the position of sides of a rectangle, passed tographics::rect(). Multiple rectangles may be defined.- col
charactervector of colors used to fill the rectangles.- gradient
characterstring indicating the direction of color gradient, with two allowed values:"x"and"y".- border
charactervalue indicating the color of border around the rectangle.- ...
additional arguments are ignored.
Details
This function was inspired by the plotrix::gradient.rect()
function in the plotrix R package. The function is
simplified here, and requires a vector of colors in col.
See also
Other jam utility functions:
blockArrowMargin(),
find_colname(),
fold_to_log2fold(),
get_se_assaydata(),
handle_highlightPoints(),
log2fold_to_fold(),
logAxis(),
outer_legend(),
points2polygonHull(),
update_function_params(),
update_list_elements()
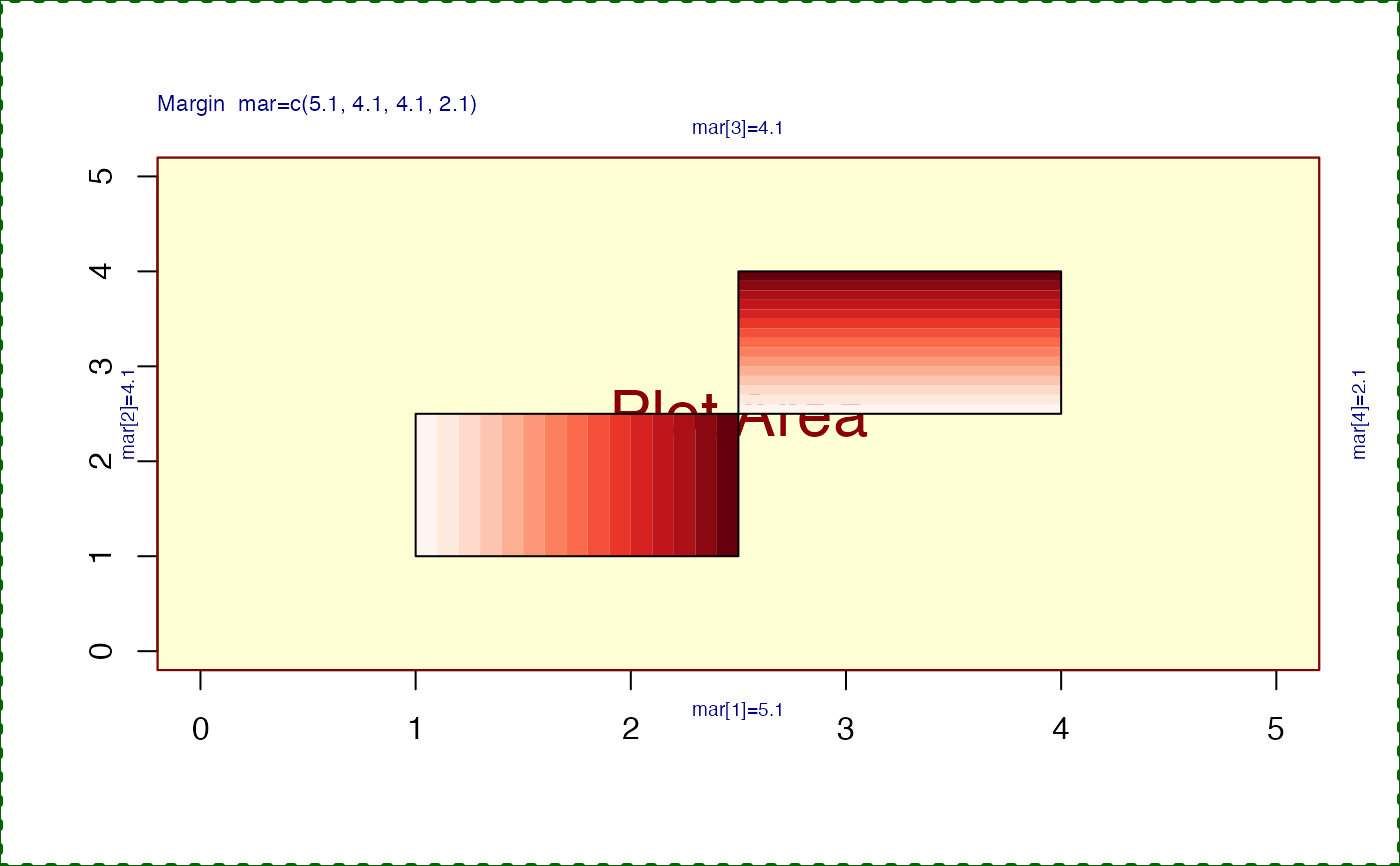
Examples
jamba::nullPlot(xlim=c(0,5), ylim=c(0,5), xaxt="s", yaxt="s");
gradient_rect(xleft=1,
   ybottom=1,
   xright=2.5,
   ytop=2.5,
   col=jamba::getColorRamp("Reds", n=15))
gradient_rect(xleft=2.5,
   ybottom=2.5,
   xright=4,
   ytop=4,
   gradient="y",
   col=jamba::getColorRamp("Reds", n=15))