Draw a volcano plot using reasonable default arguments.
volcano_plot(
  x,
  n = NULL,
  lfc_colname = c("logfc", "log2fold", "log2fc", "lfc", "l2fc", "logratio", "log2ratio"),
  fold_colname = c("fold", "fc", "ratio"),
  fold_cutoff = 1.5,
  fold_max_range = 16,
  fold_min_range = 4,
  sig_colname = c("adj.P.Val", "padj", "adj.pval", "adjp", "P.Value"),
  sig_cutoff = 0.05,
  sig_max_range = 1e-10,
  sig_min_range = 1e-04,
  expr_colname = c("mgm", "groupmean", "mean", "AveExpr", "fkpm", "rpkm", "tpm", "cpm"),
  expr_cutoff = NULL,
  label_colname = c("gene", "symbol", "protein", "probe", "assay"),
  main = "Volcano Plot",
  submain = NULL,
  blockarrow = TRUE,
  blockarrow_colors = c(hit = "#E67739FF", up = "#990000FF", down = "#000099FF"),
  blockarrow_font = 1,
  blockarrow_cex = c(1.2, 1.2),
  blockarrow_label_cex = 1,
  blockarrow_shadowtext = TRUE,
  symmetric_axes = TRUE,
  do_cutoff_caption = TRUE,
  caption_cex = 0.8,
  include_axis_prefix = FALSE,
  n_x_labels = 12,
  n_y_labels = 7,
  xlim = NULL,
  ylim = NULL,
  pt_cex = 0.9,
  pt_pch = 21,
  hit_type = "hits",
  color_set = c(base = "#77777777", up = "#99000088", down = "#00009988", hi =
    "#FFDD55FF", hi_up = "#FFDD55FF", hi_down = "#FFDD55FF"),
  border_set = NULL,
  point_colors = NULL,
  border_colors = NULL,
  abline_color = "#000000AA",
  smooth = TRUE,
  smooth_func = jamba::plotSmoothScatter,
  smooth_ramp = colorRampPalette(c("white", "lightblue", "lightskyblue3", "royalblue",
    "darkblue", "orange", "darkorange1", "orangered2")),
  tophist = FALSE,
  tophist_cutoffs = c("pvalue", "foldchange"),
  tophist_breaks = 100,
  tophist_color = "#000099FF",
  tophist_fraction = 1/3,
  tophist_by = 0.2,
  hi_points = NULL,
  hi_colors = NULL,
  hi_hits = FALSE,
  hi_cex = 1,
  do_both = FALSE,
  label_hits = FALSE,
  add_plot = FALSE,
  xlab = NULL,
  ylab = NULL,
  cex.axis = 1.2,
  mar_min = c(6, 5, 6, 5),
  transFactor = 0.24,
  transformation = function(x) {
     x^transFactor
 },
  nbin = 256,
  verbose = TRUE,
  ...
)
Arguments
- x
data.framethat contains statistical results with at least a P-value, and fold change or log2 fold change. It is useful to contain a column with mean expression, and a column with a relevant label.- n
integerindicating the number of subset points to plot for testing purposes.- lfc_colname
characterstring or vector used to matchcolnames(x)whose values should be log2 fold changes. A direct match tocolnames(x)is performed first, then if no column is found, the values are used as regular expression patterns in order until the first matching colname is found. Note thatlfc_colnameis used in preference tofold_colname. The colname used will appear as the x-axis label.- fold_colname
characterstring or vector used to matchcolnames(x)whose values should be fold changes. Note that iflfc_colnamesuccessfully finds a value, thefold_colnameis not used. The colname if used will appear as the x-axis label.- fold_cutoff
numericthreshold for values inlfc_colnameorfold_cutoff, where normal fold change values at or abovefold_cutoffcan be considered statistically significant. Note that whenlfc_colnameis being used, its values are converted to normal fold change before applying this filter.- fold_max_range
numericindicating the maximum range to display on the x-axis fold change. This argument prevents extremely large fold changes from compressing the useful visible range of the figure.- fold_min_range
numericindicating the minimum range to display on the x-axis fold change. This argument is useful when fold changes are low and the x-axis range would otherwise be too small to be very useful.- sig_colname
characterstring or vector used to matchcolnames(x)whose values should contain P-values of significance. The P-values can be unadjusted (raw) P-values, or adjusted P-values. The P-values are expected not to be-log10()transformed. The colname used will appear as the y-axis label.- sig_cutoff
numericthreshold for values insig_colname, where values at or belowsig_cutoffcan be considered statistically significant.- sig_max_range
numericindicating the maximum range to display on the y-axis significance. This argument prevents extremely small P-values from compressing the useful visible range of the figure.- sig_min_range
numericindicating the minimum range to display on the y-axis significance. This argument is useful when P-values are not very significant, and you want to make sure the y-axis range shows a minimum amount of the significant region to be visually interpretable in that context.- expr_colname
characterstring or vector used to matchcolnames(x)whose values should contain expression mean values. This column is only used whenexpr_cutoffis defined and is applied to the filter criteria for statistical hits.- expr_cutoff
numericthreshold for values inexpr_colnamewhenexpr_colnameis defined, where values inexpr_colnameat or aboveexpr_cutoffcan be considered statistically significant. This threshold is useful to filter out potential statistical hits whose signal is below a noise signal threshold.- label_colname
characterstring or vector used to matchcolnames(x)whose values should contain a useful label, for example gene symbol or assay identifier.- main
characterstring used as the main title of the figure.- submain
characterstring used as a sub-title of the figure.- blockarrow
logicalindicating whether block arrows should be displayed and used to indicate the number of statistical hits.- blockarrow_colors, blockarrow_font, blockarrow_label, blockarrow_shadowtext
arguments used when
blockarrow=TRUE.- symmetric_axes
logicalindicating whether the x-axis log fold change range should be symmetric above and below zero.- do_cutoff_caption
logicalindicating whether to display text caption with the statistical cutoff values used, and the total number of points displayed.- caption_cex
numericcaption font size adjustment.- include_axis_prefix
logicalindicating whether to include a prefix for the x-axis and y-axis labels: x-axis"Change"; y-axis"Significance".- n_x_labels, n_y_labels
integerused bypretty()to determine the approximate number of x-axis and y-axis labels to display, respectively.- xlim, ylim
numericused to define specificxlimandylimaxis ranges. WhenNULLthe ranges are defined automatically, usingfold_min_range,fold_max_rangefor the x-axis, andsig_min_range,sig_max_rangefor the y-axis.- pt_cex, pt_pch
numericused to define point size and shape, used only when individual points are displayed.- hit_type
characterstring used to label points that meet the statistical cutoffs as"hits", but where it may be useful to indicate the type of entry being tested. For example:hit_type="genes"indicates that each row represents a gene;hit_type="probes"indicates each row represents a probe;hit_type="transcripts"indicates each row represents a transcript.
- color_set
charactervector of R colors, used only when individual points are display. The names override default values, and may include:"base"- the base color of all points on the plot"up"- the color for up-regulated points that meet all statistical cutoffs to be a "hit"."down"- the color for down-regulated points that meet all cutoffs"hi"- base color for highlighted points, used whenhi_pointsis defined."hi_up"- color for highlighted up-regulated points."hi_down"- color for highlighted down-regulated points.
- border_set
NULLorcharactervector of R colors, used to define point border colors such aspch=21which is a filled circle with border. Whenborder_set=NULLthen it is defined byjamba::makeColorDarker(color_set).- point_colors, border_colors
optional
charactervector of R colors recycled to lengthnrow(x), used to specify the exact color of each point inx. This argument is useful to colorize certain specific points that may otherwise not meet statistical criteria.- abline_color
characterstring with R color used to color the abline that indicates the x-axisfold_cutoffvalue, and y-axissig_cutoffvalue.- smooth
logicalindicating whether points should be drawn as a smooth scatter plot, usingjamba::plotSmoothScatter(). Whensmooth=FALSEindividual points are drawn, usingpoint_colors, or whenpoint_colorsis not defined the default is to usecolor_setto colorize points based upon statistical cutoffs.- smooth_func
functionused to plot points whensmooth=TRUE, by defaultjamba::plotSmoothScatter()which has some benefits over defaultgraphics::smoothScatter().- smooth_ramp
charactervector of R colors which defines the color gradient to use whensmooth=TRUE.- tophist
logicalindicating whether to display a histogram at the top of the volcano plot figure.- tophist_cutoffs, tophist_breaks, tophist_fraction, tophist_by
arguments used when
tophist=TRUE.- hi_points
charactervector indicating points to highlight in the volcano plot, where values should matchrownames(x). This argument is useful to highlight a specific subset of points of interest on the figure. Note thathi_pointsare always rendered as individual points even whensmooth=TRUE.- hi_hits
logicalindicating whether rows that meet all statistical cutoffs and are considered "hits" should also be treated ashi_pointsfor the purpose of rendering individual points.- hi_cex
numericsize adjustment for highlight points, relative to the size of other points in the figure.- do_both
logicalindicating whether to draw both a smooth scatter and individual points on the same figure.- label_hits
logicalindicating whether to add a text label for points that are statistical hits.- add_plot
logicalindicating whether the plot should be added to an existing plot, or whenadd_plot=FALSEa new plot is created. This argument is useful to re-run the same volcano plot with alternate parameters, for example to display different subsets of highlighted points.- xlab, ylab
characterstrings used to specify the exact x-axis label and y-axis label. When either value isNULLthe default is to use the relevant colname: x-axis uses eitherlfc_colnameorfold_colname; y-axis usessig_colname.- cex.axis
numericadjustment for axis label font sizes.- transformation
functionpassed tosmooth_funcused to adjust the visual contrast of the resulting density plot.- nbin
numericvalue passed tosmooth_funcand used byjamba::plotSmoothScatter()to adjust the number of bins used to display the density of points, where a higher value shows more detail, and a lower value shows less detail.- verbose
logicalindicating whether to print verbose output. Note thatverbose=2will enable much more verbose output.- ...
additional arguments are ignored.
- `numeric`
vector used to ensure that each margin size is at least a minimum value, applied to
par("mar")via the functionpmax().
Details
Draw a volcano plot using a reasonably robust set of default arguments, and with a large number of customization options. The default plot uses smooth scatter plot for much improved display of point density.
This function produces a volcano plot, which consists of change on the x-axis, and significance on the y-axis.
In addition to displaying the volcano plot, this function also displays statistical thresholds, and marks entries as "hits" by up to three conceptual filters:
"change" - fold change
fold_cutoff"significant" - statistical P-value
sig_cutoff"detected" - signal
expr_cutoff
If any cutoff is not defined, that filter is ignored.
Change is usually represented using log2 fold changes,
and in this case is labeled using normal scale fold change
values. The threshold is defined with fold_cutoff using
normal space values. The log2 fold change values which
have greater magnitude than fold_cutoff are marked
"changing".
Significance usually represents adjusted P-value, or raw
P-value if necessary. The threshold is defined with sig_cutoff
using a P-value below which entries are marked "significant".
Finally, since some statistical criteria also include a minimum
level of signal, a threshold expr_cutoff requires an entry to
have signal at or above this value to be considered "detected".
The default behavior of volcano_plot() is to render a
smooth scatter plot. A smooth scatter plot is much more
effective at representing the true point density along
the figure, which is one of the primary reasons to produce
the plot.
See also
Other jam plot functions:
ggjammaplot()
Examples
n <- 15000;
set.seed(12);
x_lfc <- (rnorm(n) * 1);
x_lfc <- x_lfc^2 * sign(x_lfc);
x_lfc <- x_lfc[order(-abs(x_lfc) + rnorm(n) / 2)];
x_pv <- sort(10^-(rnorm(n)*1.5)^2);
x <- data.frame(
Gene=paste("gene", seq_len(n)),
`log2fold Group-Control`=x_lfc,
`P.Value Group-Control`=x_pv[order(-abs(x_lfc))],
`mgm Group-Contol`=((rnorm(1500)+5)^2)/5,
check.names=FALSE);
volcano_plot(x);
#> ## (12:00:13) 26Jun2023: volcano_plot(): sig_colname: P.Value Group-Control
#> ## (12:00:13) 26Jun2023: volcano_plot(): lfc_colname: log2fold Group-Control
#> Warning: coercing argument of type 'double' to logical
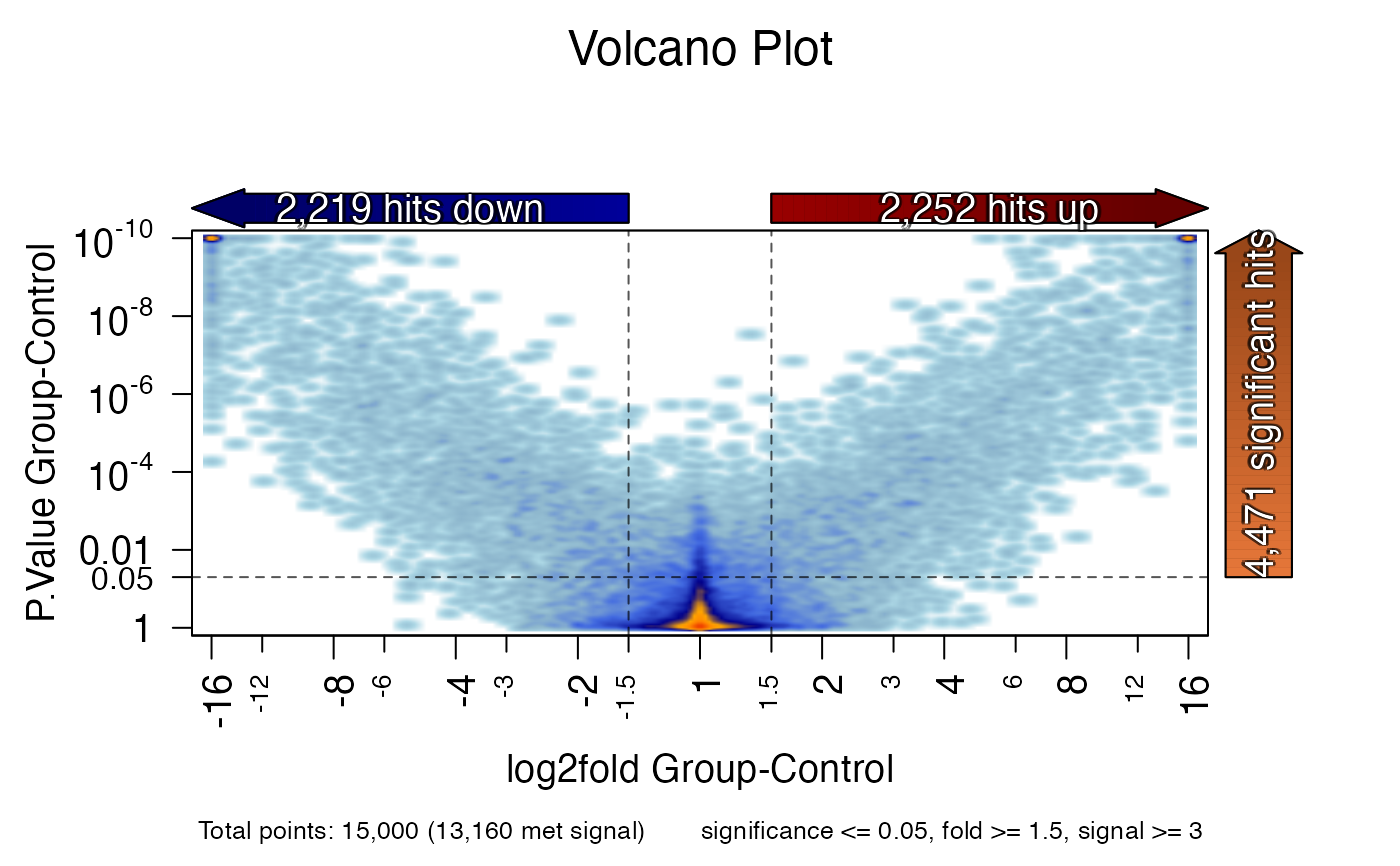
 volcano_plot(x, expr_cutoff=3);
#> ## (12:00:13) 26Jun2023: volcano_plot(): sig_colname: P.Value Group-Control
#> ## (12:00:13) 26Jun2023: volcano_plot(): lfc_colname: log2fold Group-Control
#> ## (12:00:13) 26Jun2023: volcano_plot(): expr_colname: mgm Group-Contol
#> ## (12:00:13) 26Jun2023: volcano_plot(): 13160 values of 15000 met the threshold.
#> Warning: coercing argument of type 'double' to logical
volcano_plot(x, expr_cutoff=3);
#> ## (12:00:13) 26Jun2023: volcano_plot(): sig_colname: P.Value Group-Control
#> ## (12:00:13) 26Jun2023: volcano_plot(): lfc_colname: log2fold Group-Control
#> ## (12:00:13) 26Jun2023: volcano_plot(): expr_colname: mgm Group-Contol
#> ## (12:00:13) 26Jun2023: volcano_plot(): 13160 values of 15000 met the threshold.
#> Warning: coercing argument of type 'double' to logical
 # volcano_plot(x, mar_min=c(7, 6, 6, 5), blockarrow_cex=1);
# par("mfrow"=c(2, 1));
# volcano_plot(x);
# volcano_plot(x);
# par("mfrow"=c(1, 1));
x[["fold Group-Control"]] <- log2fold_to_fold(x[["log2fold Group-Control"]]);
x[["adj.P.Val Group-Control"]] <- x[["P.Value Group-Control"]];
volcano_plot(x, hi_hits=TRUE);
#> ## (12:00:13) 26Jun2023: volcano_plot(): sig_colname: adj.P.Val Group-Control
#> ## (12:00:13) 26Jun2023: volcano_plot(): lfc_colname: log2fold Group-Control
#> Warning: coercing argument of type 'double' to logical
# volcano_plot(x, mar_min=c(7, 6, 6, 5), blockarrow_cex=1);
# par("mfrow"=c(2, 1));
# volcano_plot(x);
# volcano_plot(x);
# par("mfrow"=c(1, 1));
x[["fold Group-Control"]] <- log2fold_to_fold(x[["log2fold Group-Control"]]);
x[["adj.P.Val Group-Control"]] <- x[["P.Value Group-Control"]];
volcano_plot(x, hi_hits=TRUE);
#> ## (12:00:13) 26Jun2023: volcano_plot(): sig_colname: adj.P.Val Group-Control
#> ## (12:00:13) 26Jun2023: volcano_plot(): lfc_colname: log2fold Group-Control
#> Warning: coercing argument of type 'double' to logical
