Mem S4 class, accessors, getters, and setters
Source:R/AllClasses.R, R/methods-MemPlotFolio.R
MemPlotFolio-class.RdMem class containing results from multiEnrichMap(),
current class version "1.0.0".
Usage
list_to_MemPlotFolio(mpf)

MemPlotFolio_to_list(x, ...)

# S4 method for class 'MemPlotFolio'
show(object)

# S4 method for class 'MemPlotFolio'
Clusters(x)

# S4 method for class 'MemPlotFolio'
GeneClusters(x)

# S4 method for class 'MemPlotFolio'
ClusterLabels(x)

# S4 method for class 'MemPlotFolio'
ClusterLabels(x) <- value

# S4 method for class 'MemPlotFolio'
ClusterData(x)

# S4 method for class 'MemPlotFolio'
ClusterData(x) <- value

# S4 method for class 'MemPlotFolio'
thresholds(x)

# S4 method for class 'MemPlotFolio'
metadata(x)

# S4 method for class 'MemPlotFolio'
Caption(x, ...)

# S4 method for class 'MemPlotFolio'
CaptionLegendList(x, ...)

# S4 method for class 'MemPlotFolio'
EnrichmentHeatmap(x, do_plot, ...)

# S4 method for class 'MemPlotFolio'
GenePathHeatmap(x, do_plot, ...)

# S4 method for class 'MemPlotFolio'
CnetCollapsed(x, type, do_plot, legend_x = "bottomleft", legend_y = NULL, ...)

# S4 method for class 'MemPlotFolio'
CnetExemplar(
  x,
  num,
  do_plot,
  legend_x = "bottomleft",
  legend_y = NULL,
  main = NULL,
  ...
)

# S4 method for class 'MemPlotFolio'
CnetCluster(
  x,
  cluster,
  do_plot,
  legend_x = "bottomleft",
  legend_y = NULL,
  main = NULL,
  ...
)

# S4 method for class 'MemPlotFolio,ANY'
plot(x, y, ...)

# S4 method for class 'MemPlotFolio'
EnrichmentMap(
  x,
  do_plot = TRUE,
  legend_x = "bottomleft",
  legend_y = NULL,
  params = list(),
  ...
)
Arguments
- mpf
listoutput frommem_plot_folio()- x
MemPlotFolioobject- ...
additional arguments passed to
plot_mpf()- value
named
charactervector of cluster labels, where names correspond to cluster names as returned byClusters(x).- y
ignored
Value
list_to_MemPlotFolio() returns a MemPlotFolio S4 object,
from 'list' or 'MemPlotFolio' input.
MemPlotFolio_to_list() returns a list
Clusters(MemPlotFolio) returns a list of character vectors,
named by cluster.
GeneClusters(MemPlotFolio) returns a list of
character vectors, named by cluster.
ClusterLabels(MemPlotFolio) returns a named character vector
of cluster labels, or NULL if none are defined.
ClusterLabels<-(MemPlotFolio) returns the updated MemPlotFolio
object with new cluster labels stored in metadata$cluster_labels.
ClusterData(MemPlotFolio) returns a named list
of cluster data, or NULL if none are defined.
ClusterData<-(MemPlotFolio) returns the updated MemPlotFolio
object with new cluster data stored in metadata$cluster_data.
thresholds(MemPlotFolio) returns a list of
thresholds used with mem_plot_folio().
metadata(MemPlotFolio) returns a list of
metadata used with mem_plot_folio().
metadata(MemPlotFolio) returns a character string
with caption summary used with mem_plot_folio().
Multiple lines are delimited by newline characters.
metadata(MemPlotFolio) returns the caption summary
in the form of ComplexHeatmap::Legends suitable to draw()
as R grid graphics.
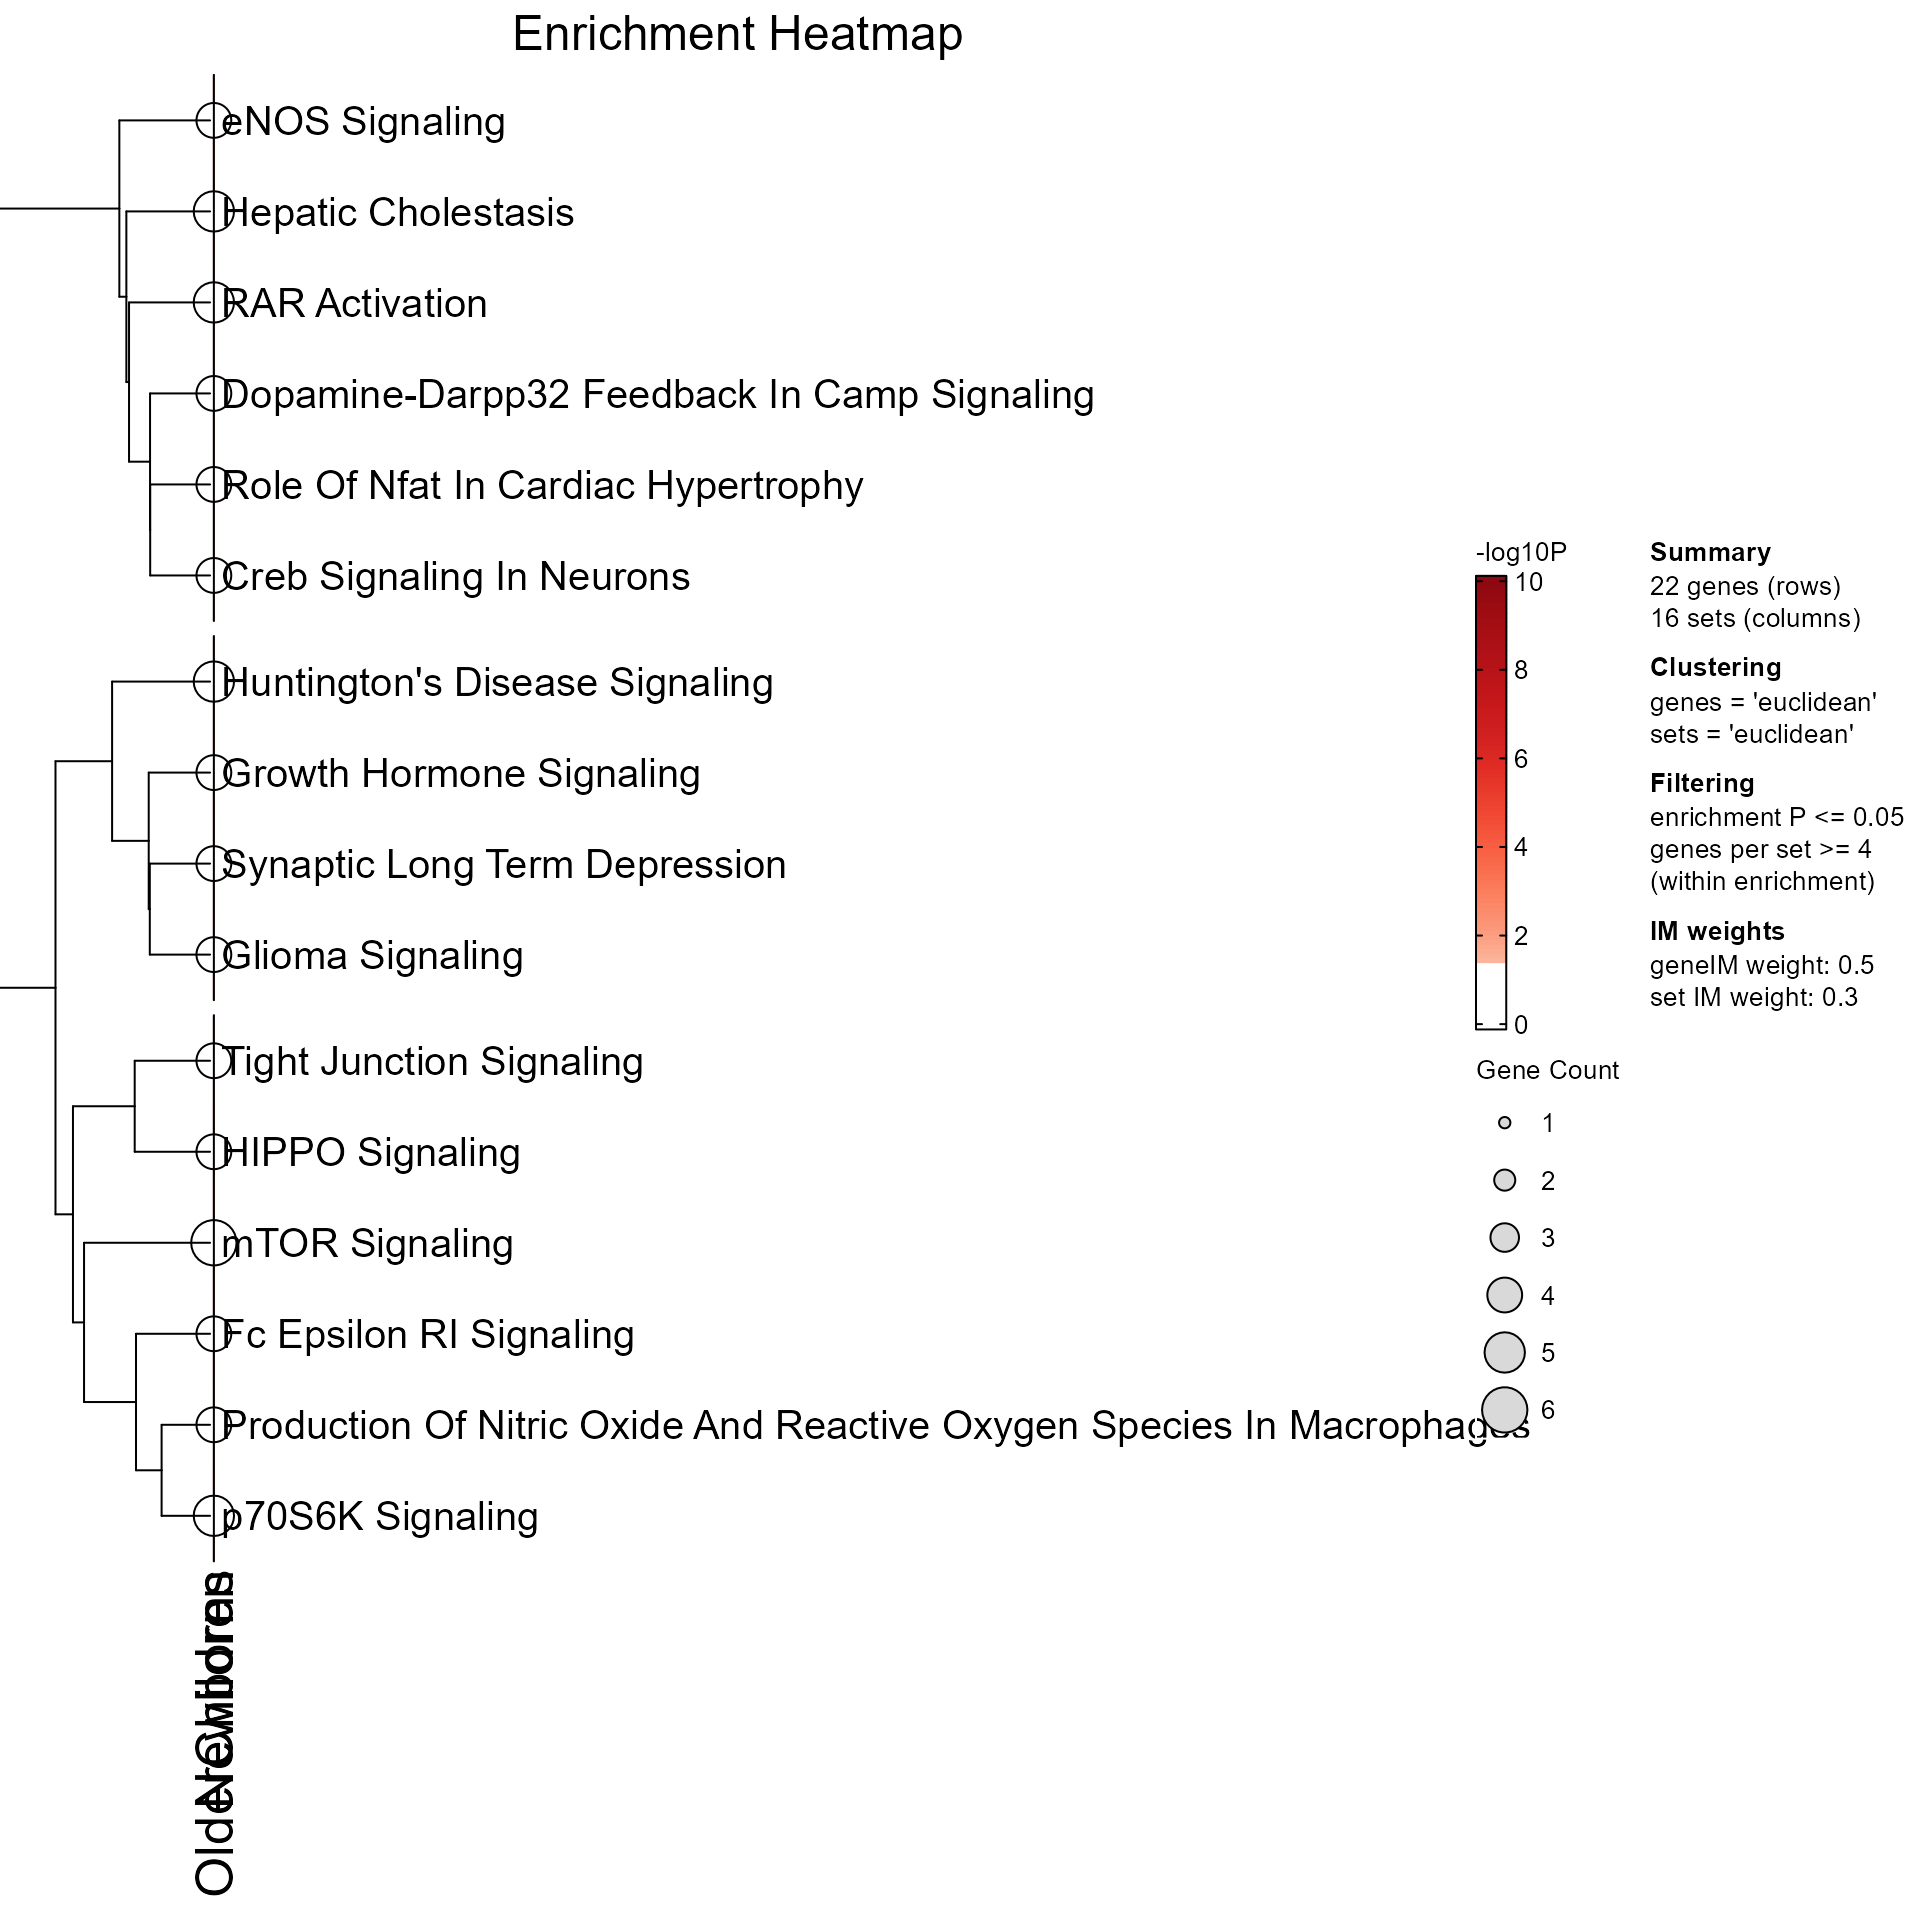
EnrichmentHeatmap(MemPlotFolio) returns a
ComplexHeatmap::HeatmapList when do_plot is TRUE (default),
in addition to rendering the heatmap. It returns
ComplexHeatmap::Heatmap when do_plot is FALSE, containing
enrichment P-values by enrichment, and pathway rows in clusters.
Optional arguments '...' include:
'main' or 'column_title' for overall plot title;
'column_title_gp' as
grid::gpar()to adjust title font;'use_cluster_labels'
logicalwhether to useClusterLabels()as row title entries.
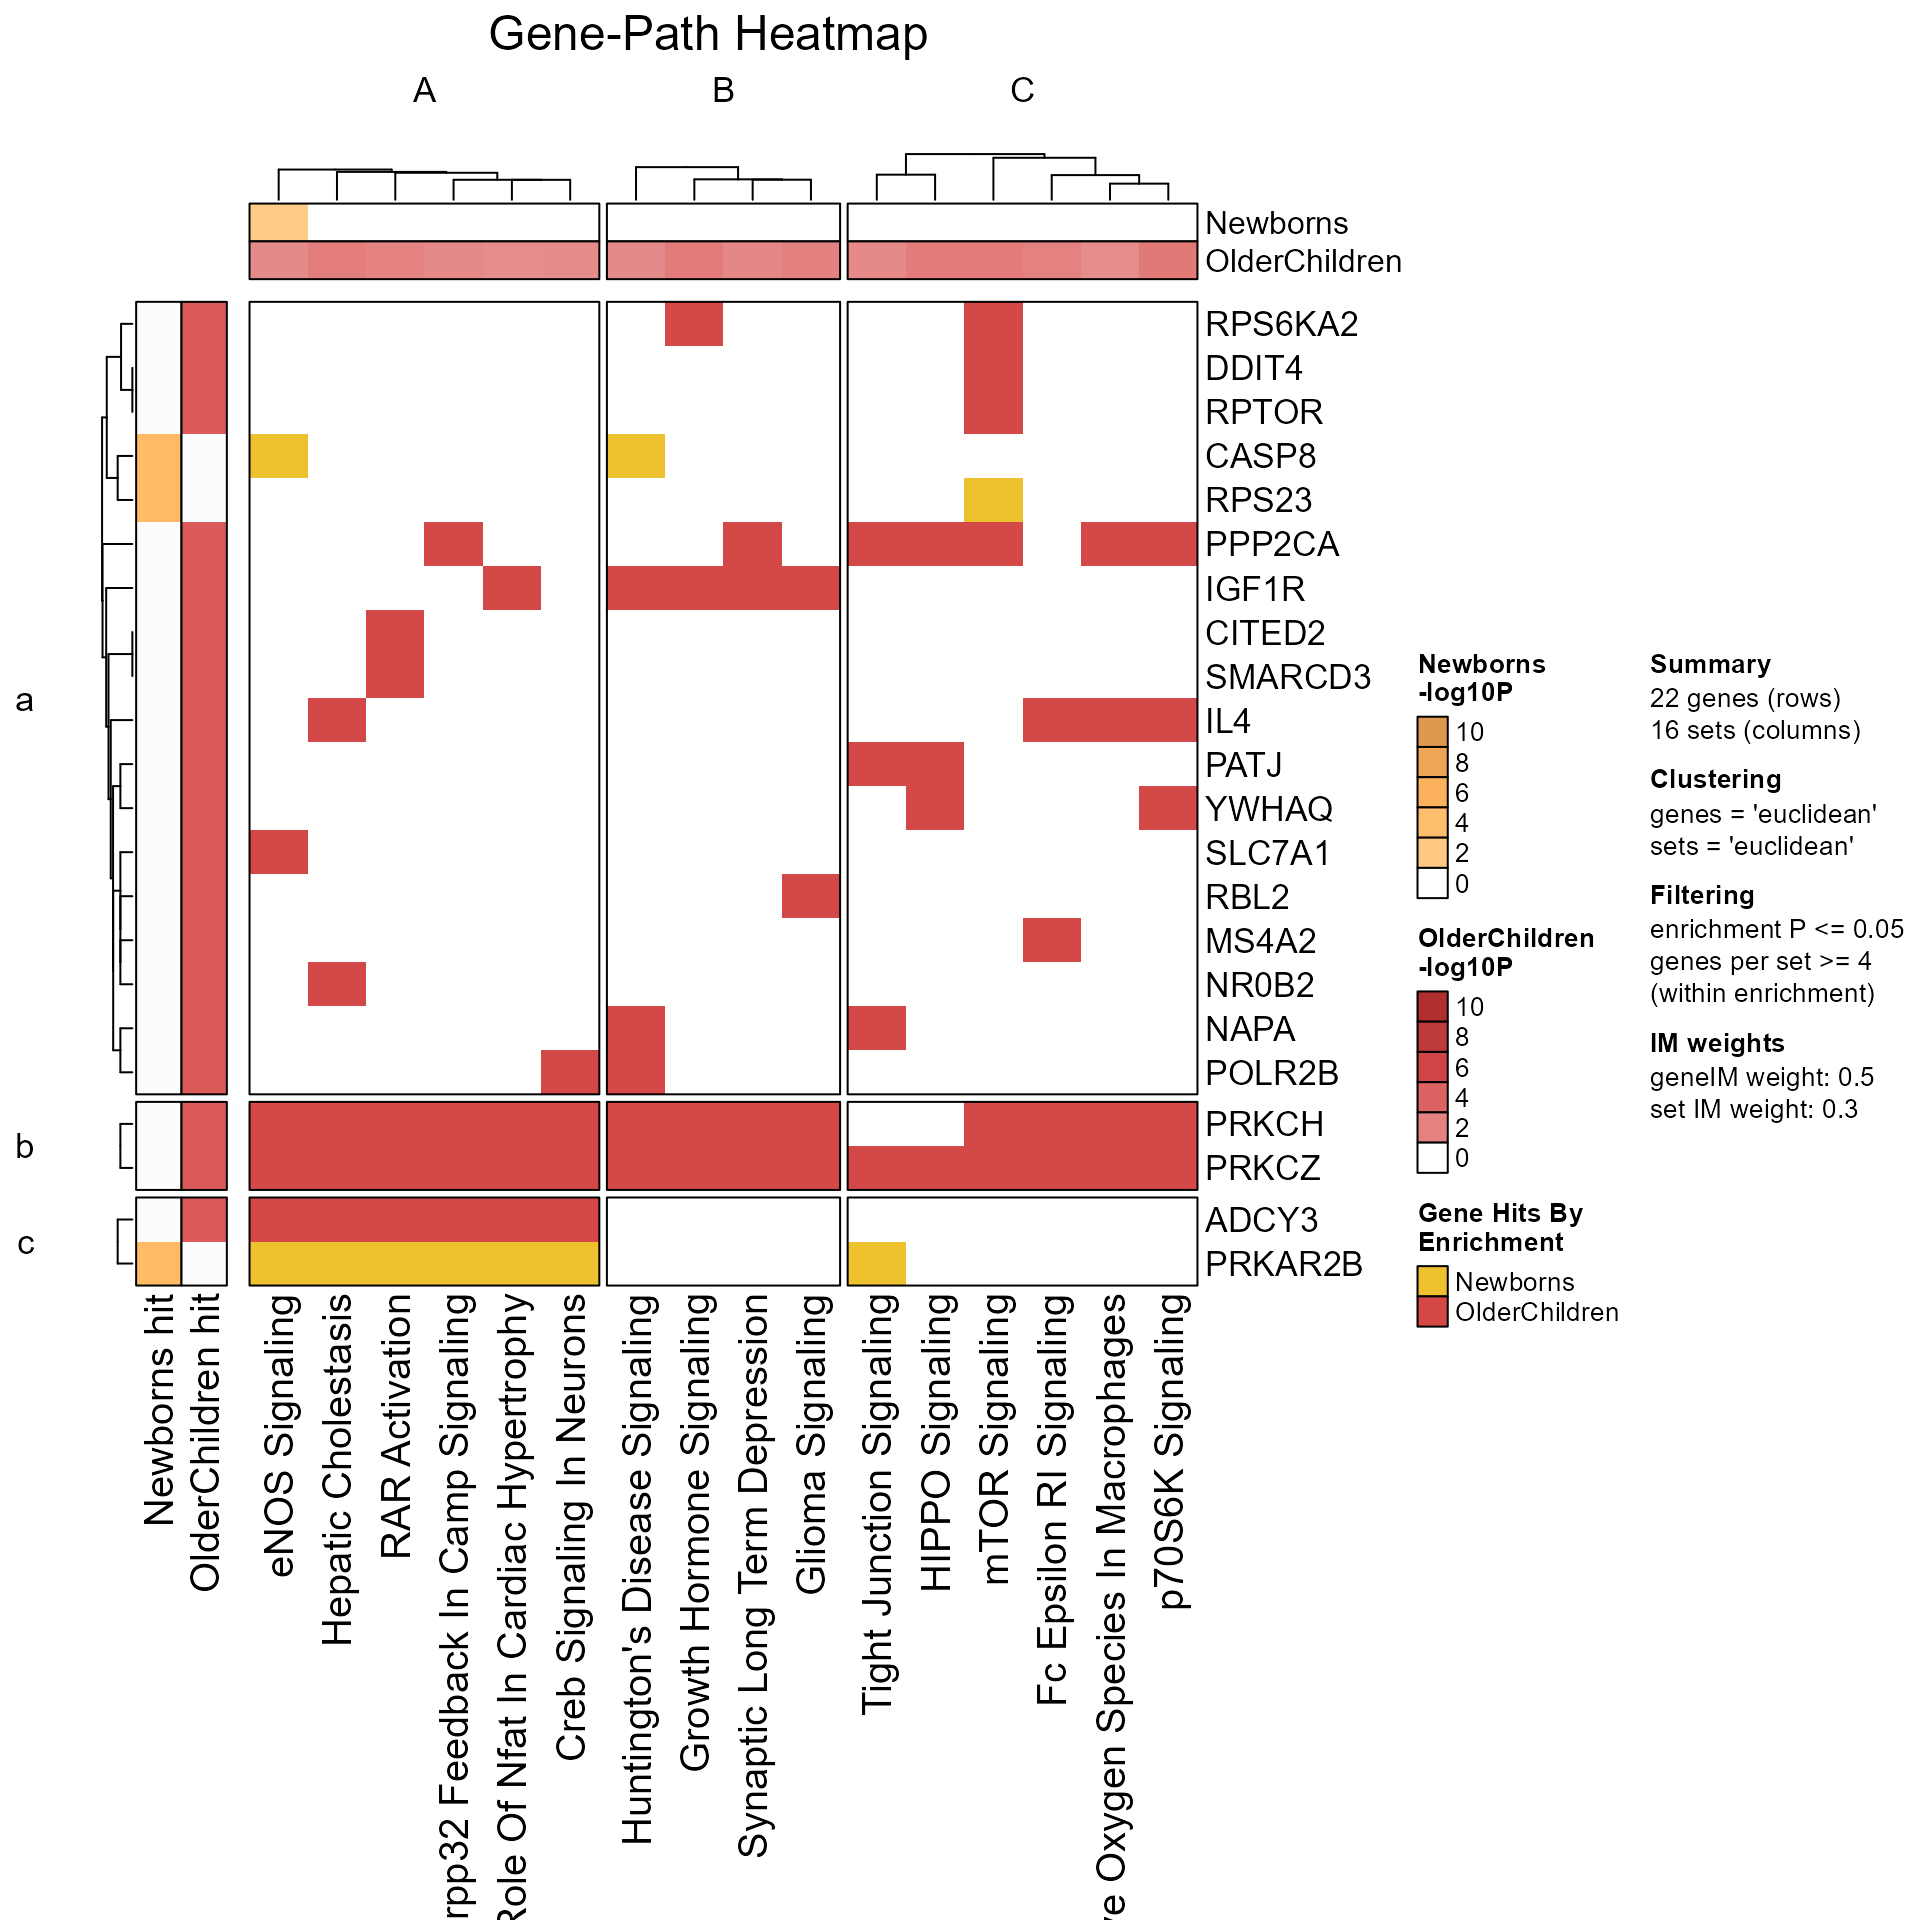
GenePathHeatmap(MemPlotFolio) returns a
ComplexHeatmap::HeatmapList when do_plot is TRUE (default),
ComplexHeatmap::Heatmap when do_plot is FALSE, containing
the genes-pathways incidence matrix and associated caption.
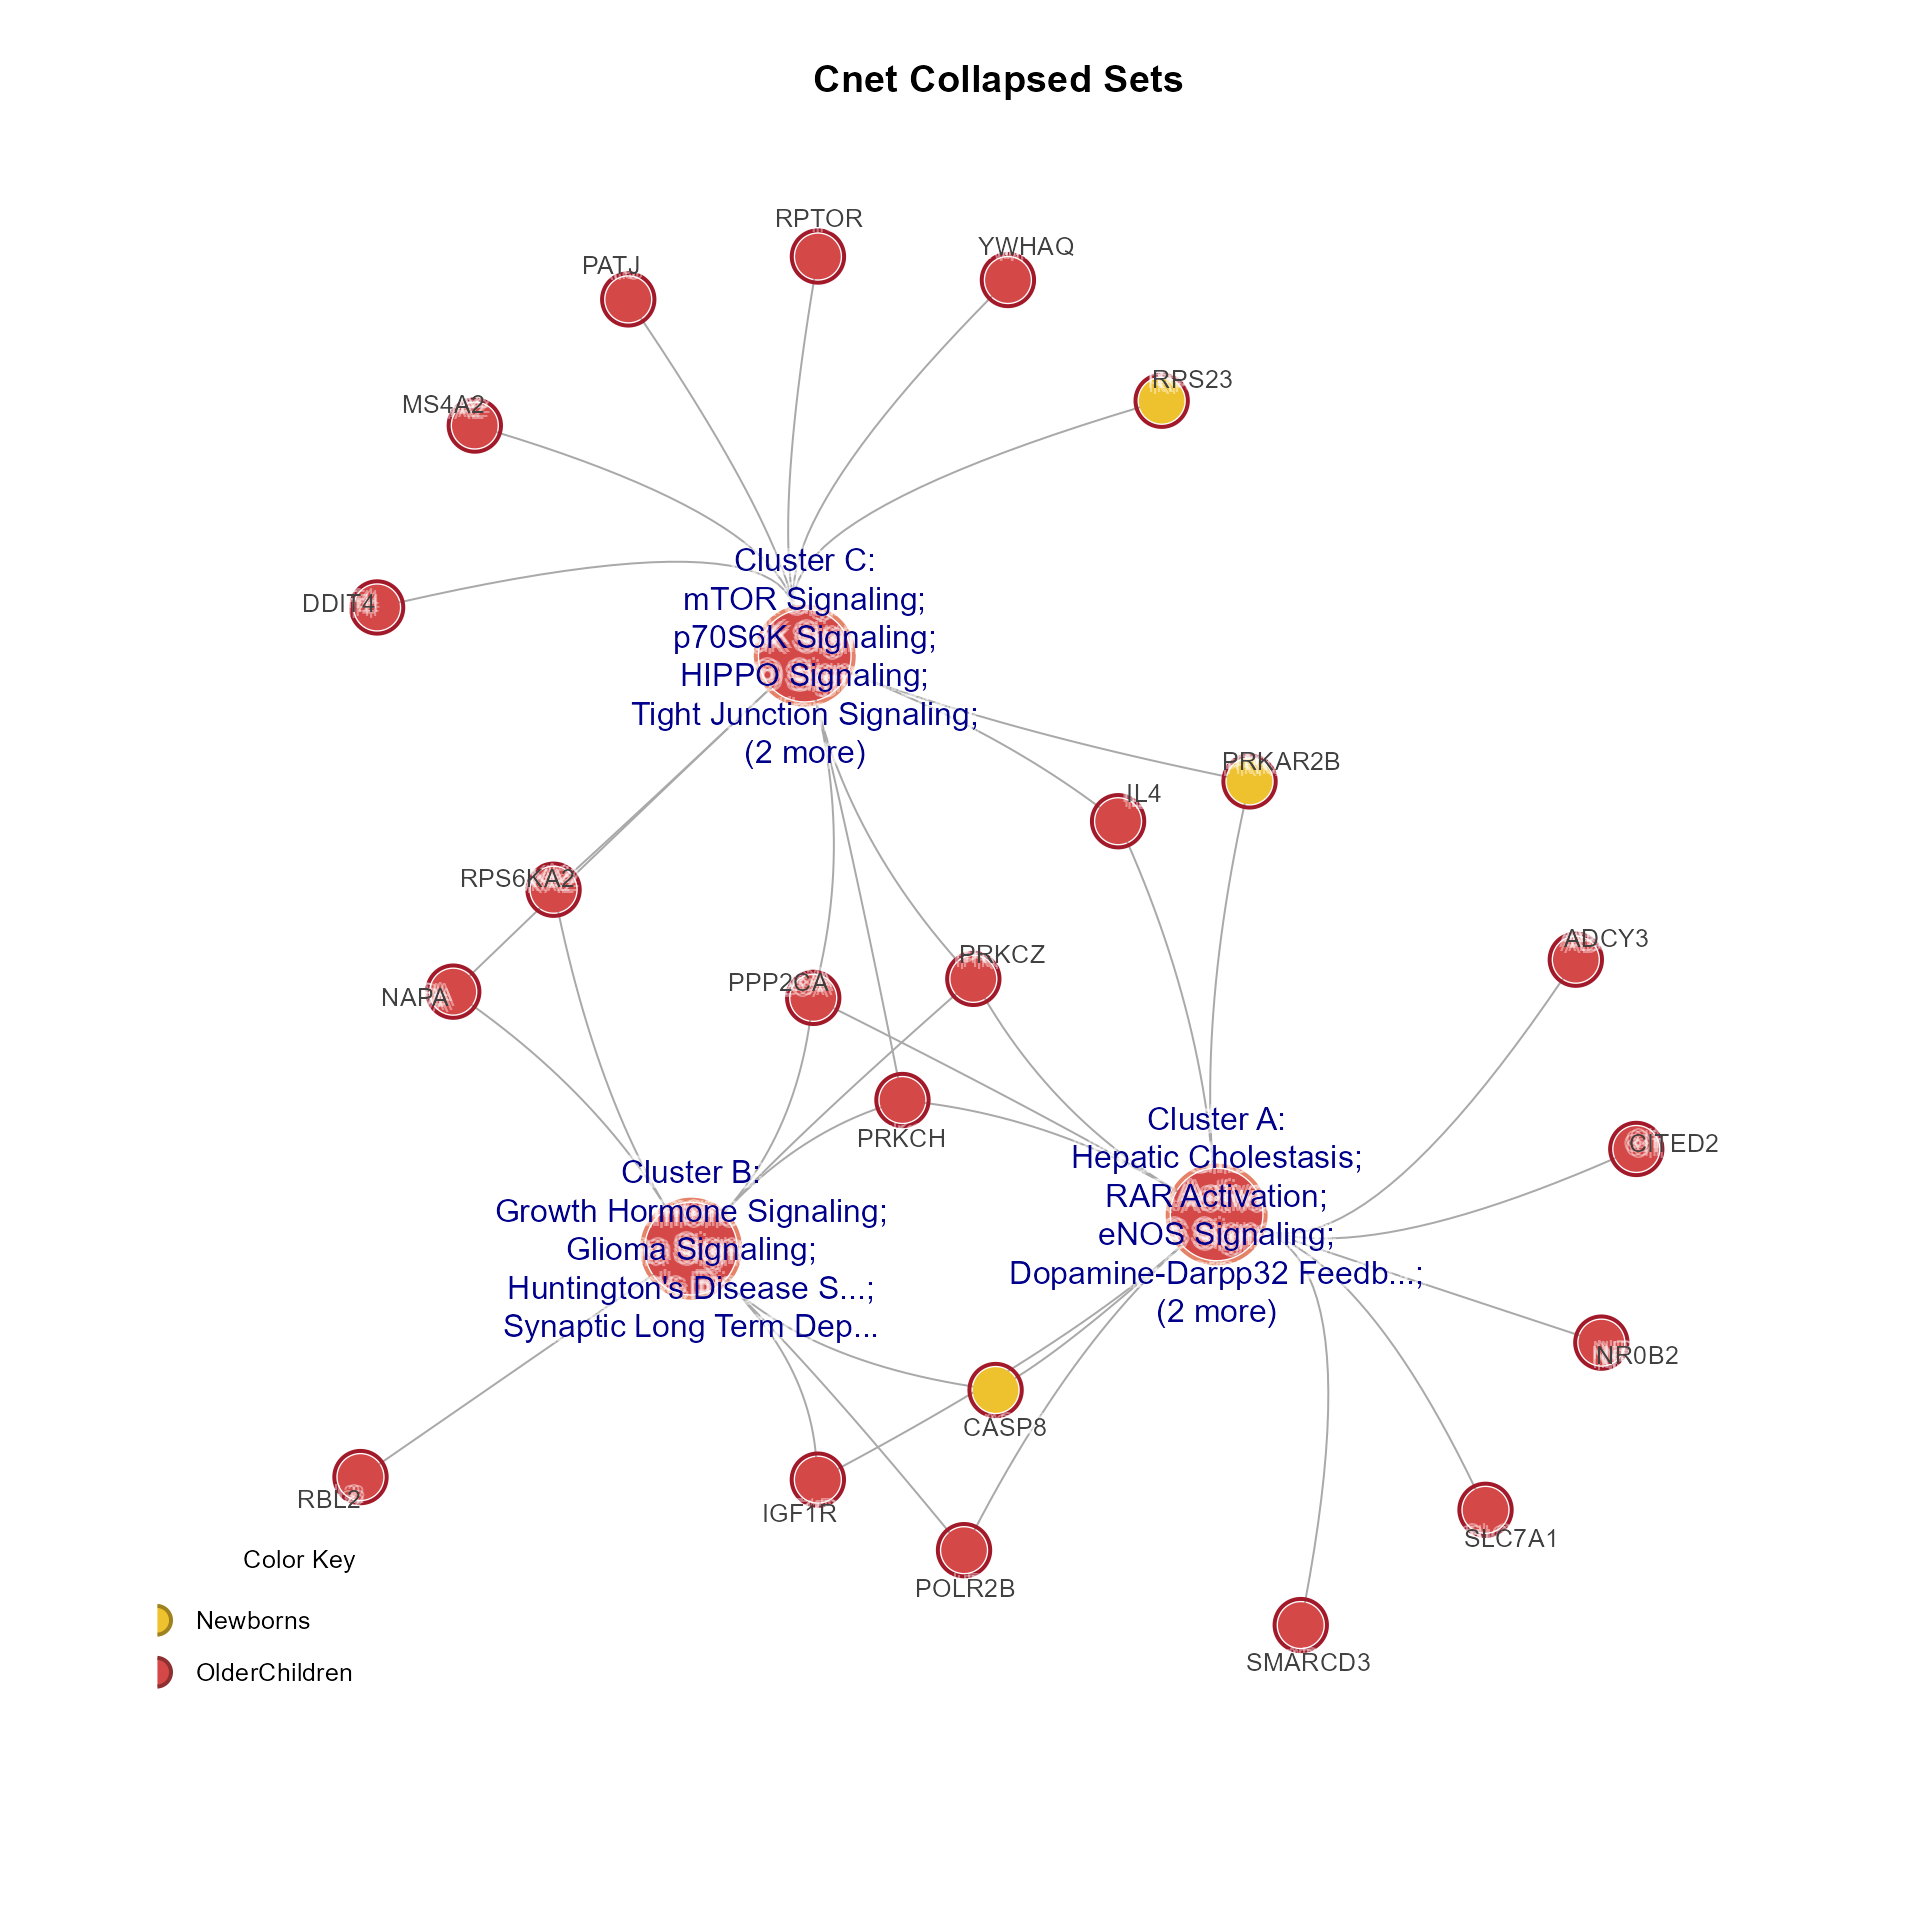
CnetCollapsed(MemPlotFolio) returns an igraph object invisibly,
with Gene and Set nodes representing the collapsed pathway clusters.
The legend position can be adjusted using 'legend_x', 'legend_y' which
are passed to mem_legend() as 'x' and 'y'.
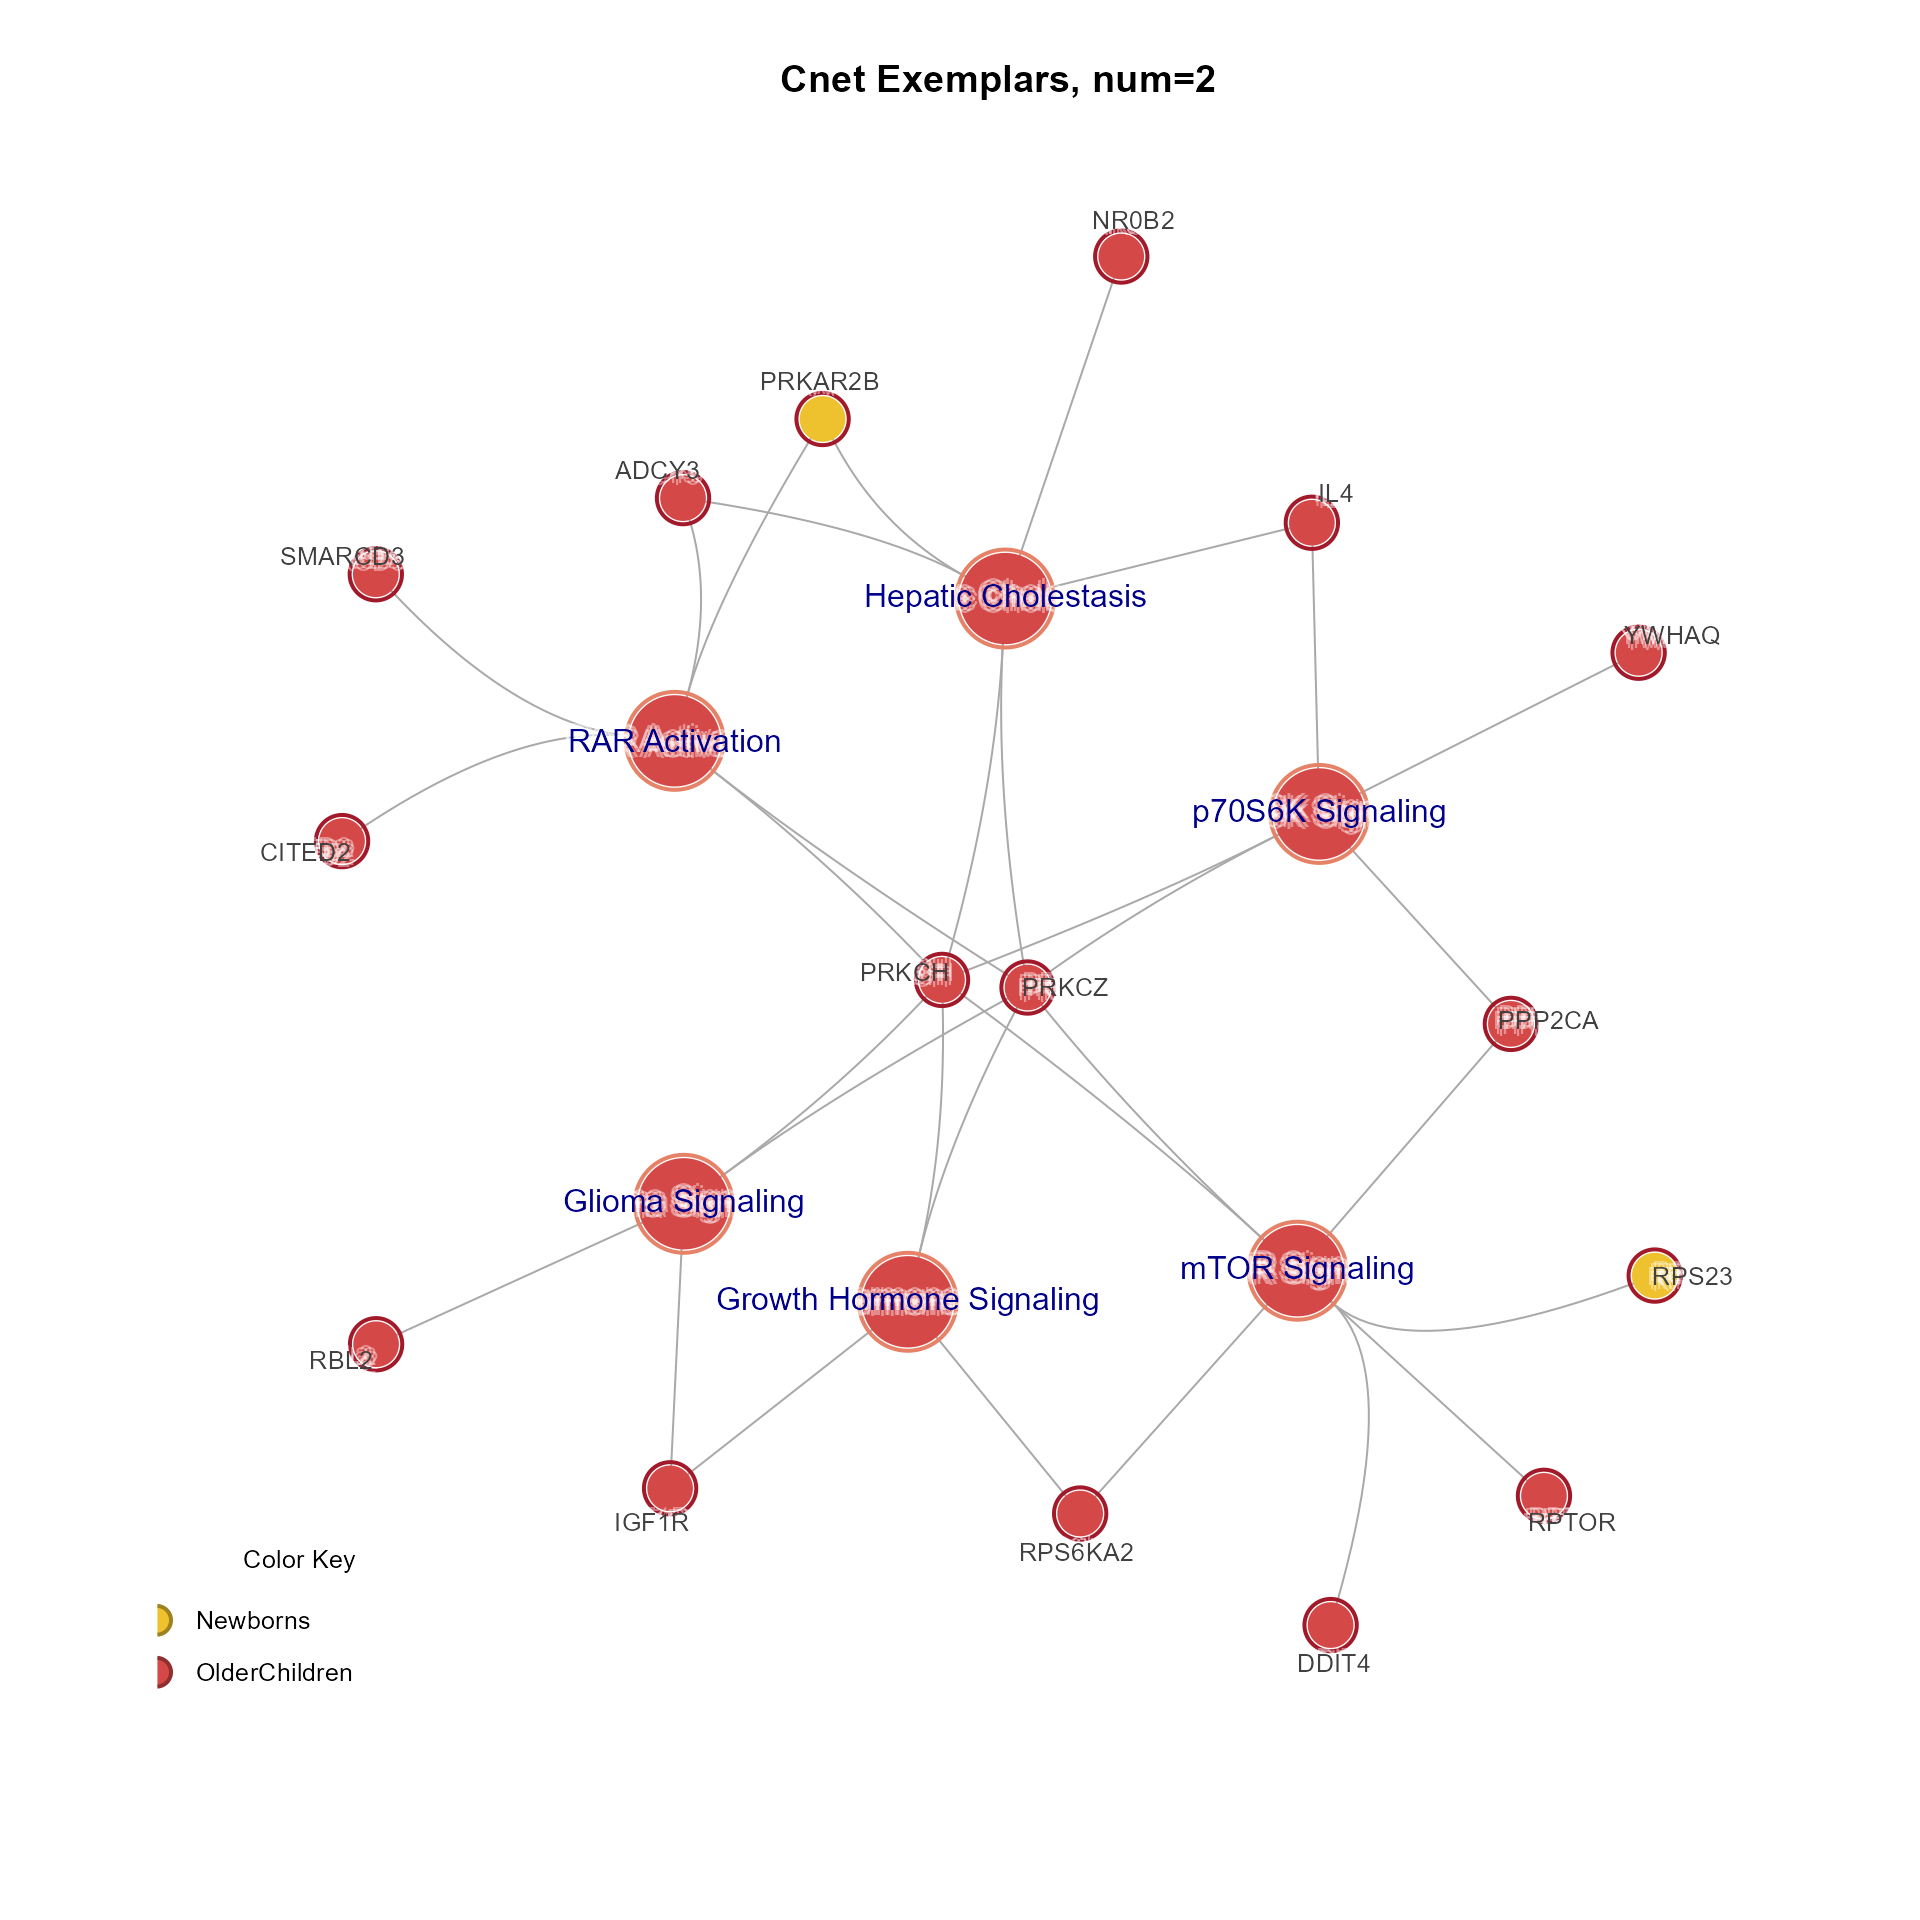
CnetExemplar(MemPlotFolio) returns an igraph object
with Gene and Set nodes for the 'num' number of exemplars per cluster.
CnetCluster(MemPlotFolio) returns an igraph object invisibly,
using all pathways in the cluster defined with argument cluster.
Functions
list_to_MemPlotFolio(): Convert legacylistto S4MemPlotFolioMemPlotFolio_to_list(): Coerce S4MemPlotFoliotolistformatshow(MemPlotFolio): Show summary of a MemPlotFolio object, dimensions defined by genes, sets, enrichments.Clusters(MemPlotFolio): Returns the order of gene sets fromMemPlotFolioresults as alistnamed by pathway cluster, containingcharactervectors of pathway gene sets.GeneClusters(MemPlotFolio): Returns the order of genes fromMemPlotFolioresults as alistnamed by gene cluster, containingcharactervectors of genes.ClusterLabels(MemPlotFolio): Returns cluster labels stored in themetadataslot ofMemPlotFolio.ClusterLabels(MemPlotFolio) <- value: Sets cluster labels in themetadataslot ofMemPlotFolio.ClusterData(MemPlotFolio): Returns cluster data stored in themetadataslot ofMemPlotFolio, intended to store further information to describe each cluster.ClusterData(MemPlotFolio) <- value: Sets cluster data in themetadataslot ofMemPlotFolio, intended to store further information to describe each cluster. It should be the same length asClusters(x)and have no names, or have names equal tonames(Clusters(x)).thresholds(MemPlotFolio): Returns the thresholds used withMemPlotFolio.metadata(MemPlotFolio): Returns the metadata used withMemPlotFolio.Caption(MemPlotFolio): Returns the caption summary forMemPlotFolio.CaptionLegendList(MemPlotFolio): Returns the caption summary forMemPlotFolioasComplexHeatmap::Legends.EnrichmentHeatmap(MemPlotFolio): Draws the enrichment heatmap fromMemPlotFolioresults. Optional arguments '...' include:'main' or 'column_title' for overall plot title;
'column_title_gp' as
grid::gpar()to adjust title font;'use_cluster_labels'
logicalwhether to useClusterLabels()as row title entries.
GenePathHeatmap(MemPlotFolio): Draws the gene-pathway set heatmap fromMemPlotFolioresults.CnetCollapsed(MemPlotFolio): Draws the Cnet collapsed network fromMemPlotFolioresults. Note that '...' arguments are passed tojam_igraph()andmem_legend()whendo_plot=TRUE. When 'type' is not defined: it uses type='cluster' ifClusterLabels()is defined, otherwise type='set'; then it appends '2' to the end if there are more than 1000 nodes. Argument 'type' can be:type='title'ortype=''to use cluster titletype='set'to use abbreviated pathway namestype='cluster'to use cluster labelstype='attribute'to use any existing vertex attribute.Append '2' to the end to hide gene labels. For example
type='set2'.
Recognized arguments in '...':
'width'to apply word-wrap to cluster labels, or vertex attribute.'maxNchar'to set maximum string character length, passed tofixSetLabels().'layout'passed toset_igraph_layout(cnet, layout)to update the node layout.'rotate_degrees'withnumericvalue. When set, it callsrotate_igraph_layout()with defaults.All other '...' arguments are passed to
jam_igraph().
The legend includes direction if encoded in the 'MemPlotFolio', but can be forced with
do_directional=TRUEor FALSE.CnetExemplar(MemPlotFolio): Draws the Cnet exemplar network fromMemPlotFolioresults for 'num' exemplar per cluster. Note that '...' arguments are passed tojam_igraph()andmem_legend()whendo_plot=TRUE.The legend includes direction if encoded in the 'MemPlotFolio', but can be forced with
do_directional=TRUEor FALSE. Legend position is controlled by legend_x,legend_y, default legend_x="bottomleft".CnetCluster(MemPlotFolio): Draws the Cnet network fromMemPlotFolioresults for a specific cluster. Note that '...' arguments are passed tojam_igraph()andmem_legend()whendo_plot=TRUE.The legend includes direction if encoded in the 'MemPlotFolio', but can be forced with
do_directional=TRUEor FALSE. Plot title 'main', default NULL uses the cluster label if present, then cluster name. Use main=FALSE or main="" to hide the title.plot(x = MemPlotFolio, y = ANY): Plot aMemPlotFolioobject callingplot_mpf()EnrichmentMap(MemPlotFolio): EnrichmentMapigraphnetwork to connect pathway gene sets based upon Jaccard overlap between each pathway pair. Note '...' arguments are passed tojam_igraph()andmem_legend()whendo_plot=TRUE. Argument'params'is alistwith additional arguments: 'repulse', 'width', 'group', 'mark.expand', 'do_legend'.
See also
Other jam Mem utilities:
Mem-class,
fixSetLabels(),
mem2cnet(),
mem2emap()
Other MemPlotFolio:
check_MemPlotFolio(),
score_gene_path_clusters()
Examples
# list_to_MemPlotFolio examples
data(Memtest)
mpf <- mem_plot_folio(Memtest, do_plot=FALSE,
do_which=c(1, 2, 3, 4), returnType="list")
Mpf <- list_to_MemPlotFolio(mpf)
data(Memtest)
mpf <- mem_plot_folio(Memtest, do_plot=FALSE, returnType="list")
Mpf <- list_to_MemPlotFolio(mpf)
# enrichment heatmap
EnrichmentHeatmap(Mpf, column_title="Enrichment Heatmap")
# Gene-path heatmap
GenePathHeatmap(Mpf, column_title="Gene-Path Heatmap")
 # Cnet collapsed sets
CnetCollapsed(Mpf, type="set", use_shadowText=TRUE, main="Cnet Collapsed Sets")
# Cnet collapsed sets
CnetCollapsed(Mpf, type="set", use_shadowText=TRUE, main="Cnet Collapsed Sets")
 # Cnet exemplar plot
CnetExemplar(Mpf, num=2, use_shadowText=TRUE, main="Cnet Exemplars, num=2")
# Cnet exemplar plot
CnetExemplar(Mpf, num=2, use_shadowText=TRUE, main="Cnet Exemplars, num=2")
 # Cnet cluster plot
CnetCluster(Mpf, cluster="B", use_shadowText=TRUE, main="Cnet Cluster 'B'")
# Cnet cluster plot
CnetCluster(Mpf, cluster="B", use_shadowText=TRUE, main="Cnet Cluster 'B'")