Interpolation for degree angles
Usage
approx_degrees(
  h1,
  h2,
  h = NULL,
  preset = "custom",
  direction = NULL,
  digits = 10,
  verbose = FALSE,
  ...
)
Arguments
- h1
numericvector of degree angles, which should represent the "degree angles from".- h2
numericvector of degree angles, which should represent the "degree angles to".- h
numericorNULL, where anumericvector is a vector of degree angles "from" that should be converted to the corresponding interpolated angle "to", Whenh is NULLthen the object returned is afunctionto be called to convert a numeric vector "from" to degree angles "to".- direction
integeror default NULL, which detects the direction using the input data. The direction represents whether h1 and h2 are both increasiing together, which isdirection=1. When h1 is increasing by h2 is decreasing,direction=-1.- digits
integervalue indicating the number of digits of precision to use for the inputh1andh2degree angles, used when confining to 360 degrees withh1 %% 360, and this step sometimes produces slight variations for equivalent values. For example((12.2 %% 360) == (372.2 %% 360))is notTRUEwithout rounding to13or fewer digits.- verbose
logicalindicating whether to print verbose output.- ...
additional arguments are ignored.
Details
This function is analogous to stats::approx() except for
the special case of degree angles. In this case, degrees
are confined to the range [0, 360], and angle are smoothly
interpolated around the degrees of a circle.
This function should work properly even when the degree angles
in h2 are reversed, or offset. The only implicit requirement
is that angles in "from" should be mapped to one and only one
angle in "to".
See also
Other colorjam hue warp:
add_colorjam_preset(),
add_colorjam_step(),
adjust_hue_warp(),
colorjam_presets(),
colorjam_steps(),
display_degrees(),
h2hw(),
h2hwOptions(),
hcl_to_hsl_hue(),
hsl_to_hcl_hue(),
hw2h(),
mean_angle(),
plot_colorjam_preset(),
plot_colorjam_steps(),
remap_colorjam_preset(),
validate_colorjam_preset()
Examples
h_colors <- jamba::getColorRamp(c("white", "firebrick"), n=35, trimRamp=c(1, 0));
h1 <- c(12.2, 27.3, 47.0, 66.5, 85.9, 106.3, 131.7,
223.1, 263.2, 277.2, 307.7, 345.3, 372.2)
h2 <- seq(from=0, to=360, length.out=13)
h_from <- seq(from=0, to=360, length.out=36)[-36]
h_to <- approx_degrees(h1, h2, h_from)
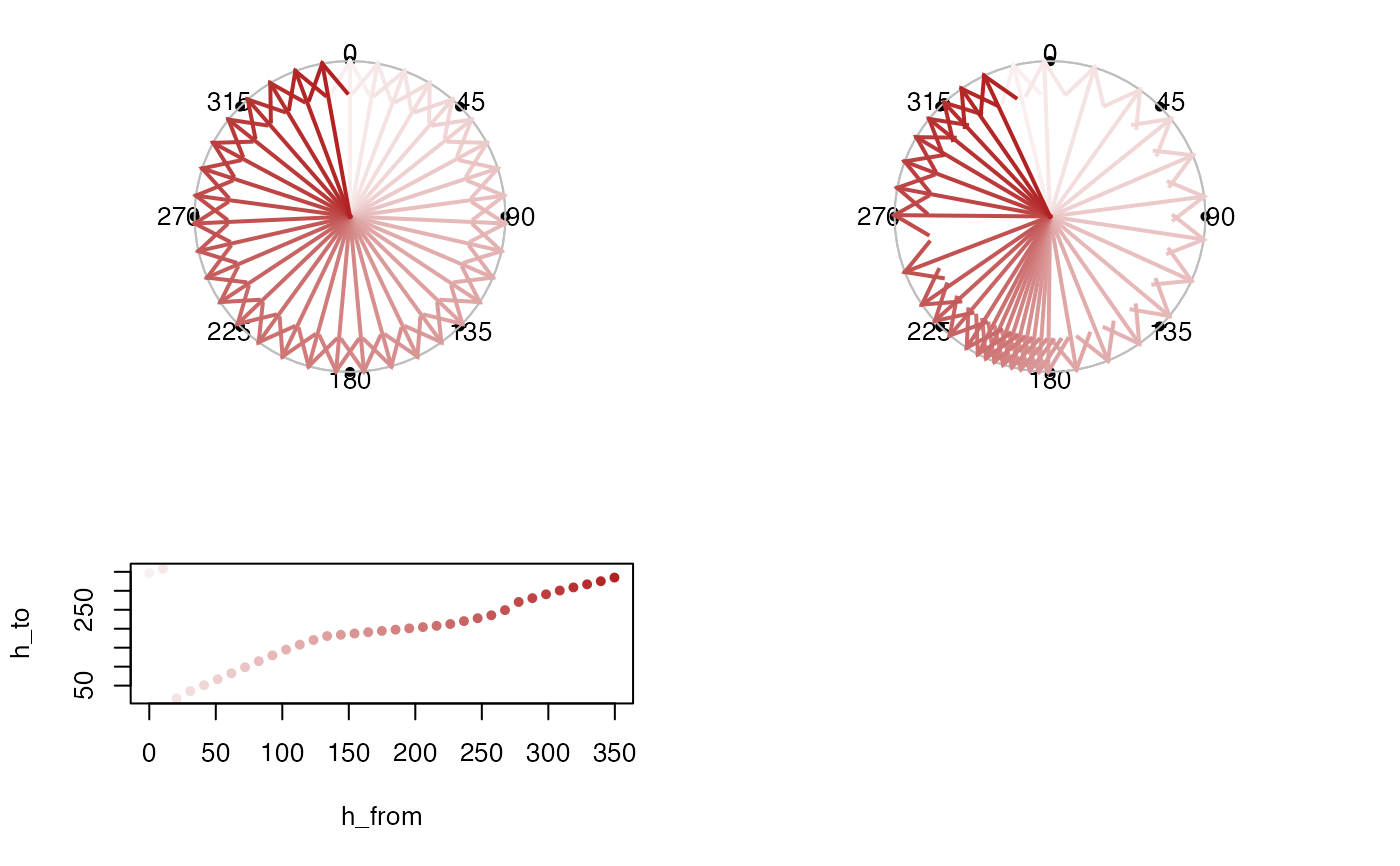
withr::with_par(list("mfrow"=c(2, 2)), {
display_degrees(h_from, col=h_colors)
display_degrees(h_to, col=h_colors)
plot(h1, h2, pch=20, col="#55555555", type="l",
main="Input h1,h2")
points(h1, h2, pch=20, col=h_colors)
plot(h_from, h_to, pch=20, col="#55555555", type="l",
main="Output approx_degrees()")
points(h_from, h_to, pch=20, col=h_colors)
})
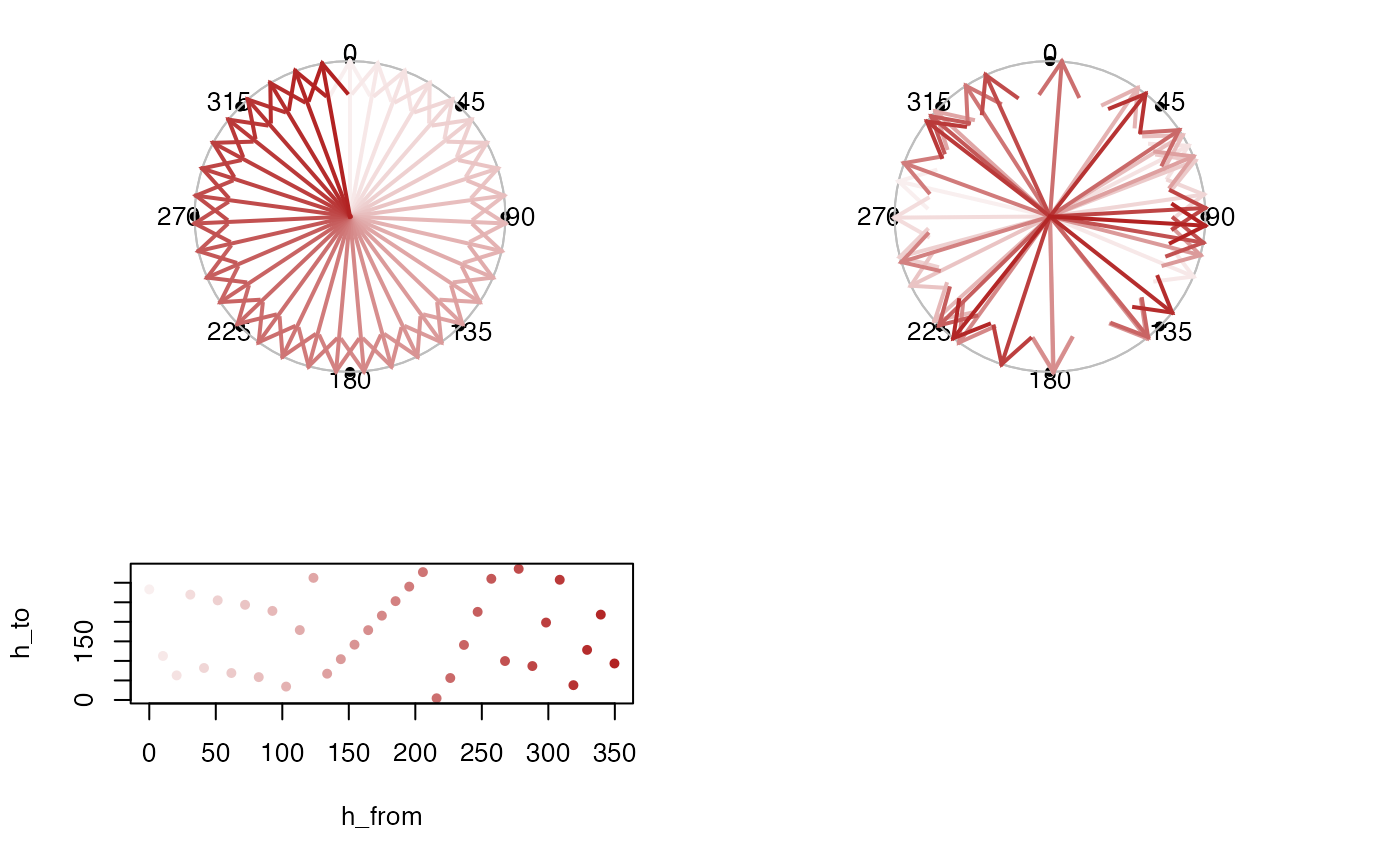
 h1 <- c(12.2, 27.3, 47.0, 66.5, 85.9, 106.3, 131.7,
223.1, 263.2, 277.2, 307.7, 345.3, 372.2)
h2 <- rev((seq(from=0, to=360, length.out=13))[c(9:12,1:9)])
h_from <- seq(from=0, to=360, length.out=36)[-36]
h_to <- approx_degrees(h1, h2, h_from, direction=-1)
h_to <- approx_degrees(h1, h2, h_from)
withr::with_par(list("mfrow"=c(2, 2)), {
display_degrees(h_from, col=h_colors)
display_degrees(h_to, col=h_colors)
plot(h1, h2, pch=20, col="#55555555", type="l",
main="Input h1,h2")
points(h1, h2, pch=20, col=h_colors)
plot(h_from, h_to, pch=20, col="#55555555", type="l",
main="Output approx_degrees()")
points(h_from, h_to, pch=20, col=h_colors)
})
h1 <- c(12.2, 27.3, 47.0, 66.5, 85.9, 106.3, 131.7,
223.1, 263.2, 277.2, 307.7, 345.3, 372.2)
h2 <- rev((seq(from=0, to=360, length.out=13))[c(9:12,1:9)])
h_from <- seq(from=0, to=360, length.out=36)[-36]
h_to <- approx_degrees(h1, h2, h_from, direction=-1)
h_to <- approx_degrees(h1, h2, h_from)
withr::with_par(list("mfrow"=c(2, 2)), {
display_degrees(h_from, col=h_colors)
display_degrees(h_to, col=h_colors)
plot(h1, h2, pch=20, col="#55555555", type="l",
main="Input h1,h2")
points(h1, h2, pch=20, col=h_colors)
plot(h_from, h_to, pch=20, col="#55555555", type="l",
main="Output approx_degrees()")
points(h_from, h_to, pch=20, col=h_colors)
})
 # apply no transform
approx_degrees(h1=0, h2=0, h=c(0, 90, 180, 270))
#> [1] 0 90 180 270
# apply 180 degree transform
approx_degrees(h1=0, h2=180, h=c(0, 90, 180, 270))
#> [1] 180 270 0 90
approx_degrees(h1=180, h2=0, h=c(0, 90, 180, 270))
#> [1] 180 270 0 90
# flip the direction
approx_degrees(h1=c(1, 360), h2=c(359, 0),
h=c(0, 90, 180, 270))
#> [1] 0 270 180 90
approx_degrees(h1=c(1, 360), h2=c(359, 0)+90,
h=c(0, 90, 180, 270))
#> [1] 90 0 270 180
approx_degrees(h1=c(1, 360)+90, h2=c(359, 0),
h=c(0, 90, 180, 270))
#> [1] 90 0 270 180
# verify reverse h2 with break across 0-360
seq1 <- seq(from=0, to=330, by=30)
seq2 <- (rev(seq1) + 120) %% 360
seq_out <- seq(from=0, to=350, by=10);
approx_out <- approx_degrees(h1=seq1, h2=seq2, h=seq_out)
plot(seq1, seq2, pch=20, col="blue", asp=1, ylim=c(0, 360))
points(seq_out, approx_out, col="red", cex=2)
# apply no transform
approx_degrees(h1=0, h2=0, h=c(0, 90, 180, 270))
#> [1] 0 90 180 270
# apply 180 degree transform
approx_degrees(h1=0, h2=180, h=c(0, 90, 180, 270))
#> [1] 180 270 0 90
approx_degrees(h1=180, h2=0, h=c(0, 90, 180, 270))
#> [1] 180 270 0 90
# flip the direction
approx_degrees(h1=c(1, 360), h2=c(359, 0),
h=c(0, 90, 180, 270))
#> [1] 0 270 180 90
approx_degrees(h1=c(1, 360), h2=c(359, 0)+90,
h=c(0, 90, 180, 270))
#> [1] 90 0 270 180
approx_degrees(h1=c(1, 360)+90, h2=c(359, 0),
h=c(0, 90, 180, 270))
#> [1] 90 0 270 180
# verify reverse h2 with break across 0-360
seq1 <- seq(from=0, to=330, by=30)
seq2 <- (rev(seq1) + 120) %% 360
seq_out <- seq(from=0, to=350, by=10);
approx_out <- approx_degrees(h1=seq1, h2=seq2, h=seq_out)
plot(seq1, seq2, pch=20, col="blue", asp=1, ylim=c(0, 360))
points(seq_out, approx_out, col="red", cex=2)
 # verify forward h2 with break across 0-360
seq1 <- seq(from=0, to=330, by=30)
seq2 <- (seq1 + 120) %% 360
seq_out <- seq(from=0, to=350, by=10);
approx_out <- approx_degrees(h1=seq1, h2=seq2, h=seq_out)
plot(seq1, seq2, pch=20, col="blue", asp=1, ylim=c(0, 360))
points(seq_out, approx_out, col="red", cex=2)
# verify forward h2 with break across 0-360
seq1 <- seq(from=0, to=330, by=30)
seq2 <- (seq1 + 120) %% 360
seq_out <- seq(from=0, to=350, by=10);
approx_out <- approx_degrees(h1=seq1, h2=seq2, h=seq_out)
plot(seq1, seq2, pch=20, col="blue", asp=1, ylim=c(0, 360))
points(seq_out, approx_out, col="red", cex=2)
