Display degree angles around a unit circle
Usage
display_degrees(
  x,
  x2 = x,
  add = FALSE,
  col = "darkorange",
  lwd = 2,
  top_degree = 0,
  clockwise = TRUE,
  r1 = 0,
  r2 = 1,
  r0 = 1,
  arrow.length = 0.2,
  xlim = NULL,
  ylim = NULL,
  asp = 1,
  ...
)
Arguments
- x
numericangles in degrees- x2
numericangles in degrees, optionally used to show when an angle changes fromxtox2.- add
logicalindicating whether to add to an existing open plot device.- col
charactervector of colors recycled tolength(x).- lwd
numericline width.- top_degree
numericthe angle in degrees for the top (12 o'clock) position of the graph.- clockwise
logicalindicating whether angles proceed from thetop_degreein clockwise (top, top-right, right, bottom-right, bottom, bottom-left, left, top-left, top) or counter-clockwise orientation.- r1, r2
numericradius values for the start and end position of each arrow vector drawn.- r0
numericradius used for the axis with labeled angles.- arrow.length
numericpassed toarrows()to define the arrow head length.- xlim, ylim
numericx-axis and y-axis plot limits, respectively. When not supplied, they automatically use 1.1 times the higher value fromc(r1, r2, r0, 1)so that the minimum radius is at at least1unless specified otherwise.- ...
additional arguments are ignored.
See also
Other colorjam hue warp:
add_colorjam_preset(),
add_colorjam_step(),
adjust_hue_warp(),
approx_degrees(),
colorjam_presets(),
colorjam_steps(),
h2hw(),
h2hwOptions(),
hcl_to_hsl_hue(),
hsl_to_hcl_hue(),
hw2h(),
mean_angle(),
plot_colorjam_preset(),
plot_colorjam_steps(),
remap_colorjam_preset(),
validate_colorjam_preset()
Examples
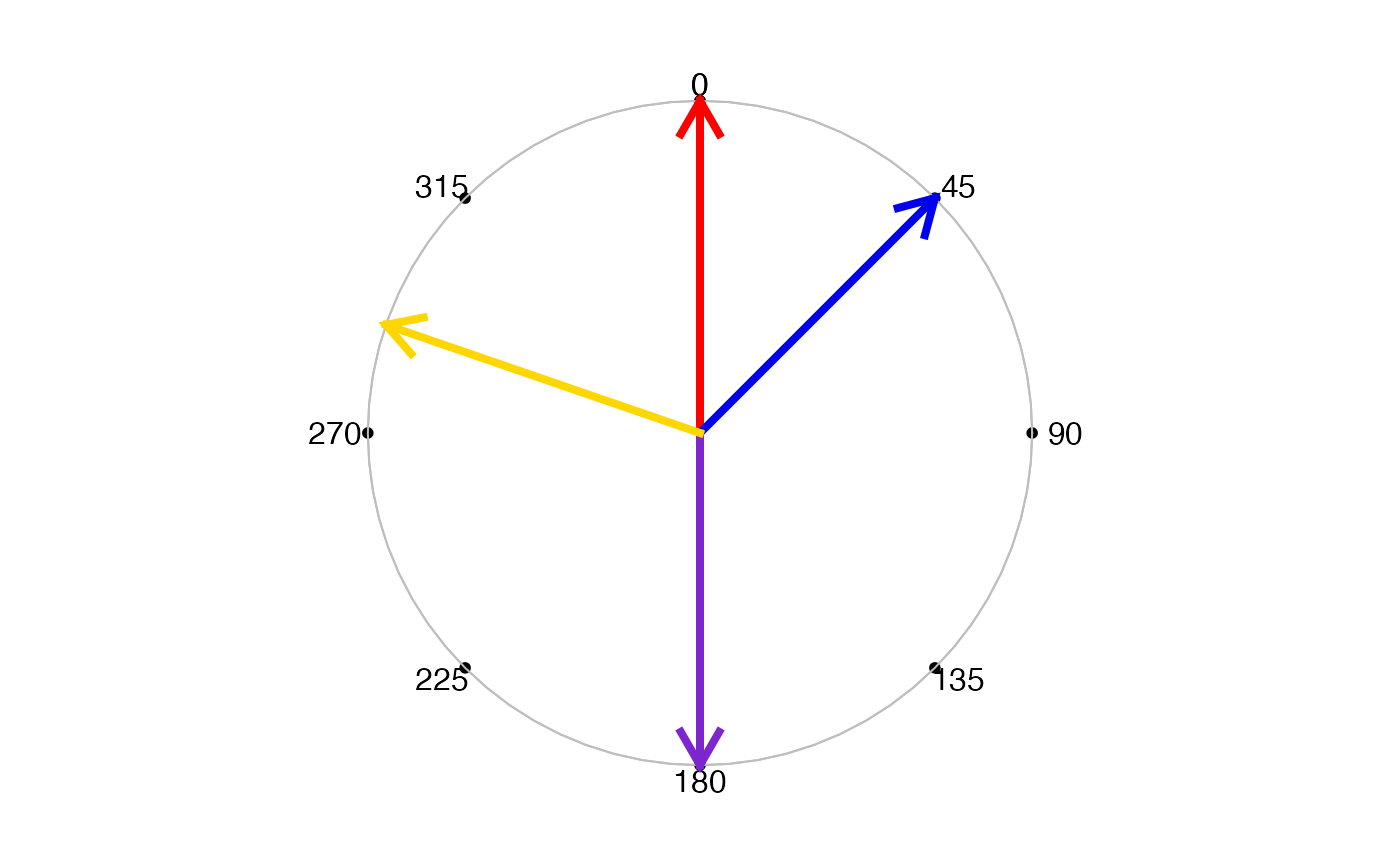
display_degrees(c(0, 45, 180, 289),
   lwd=4,
   col=c("red", "blue2", "purple3", "gold"))


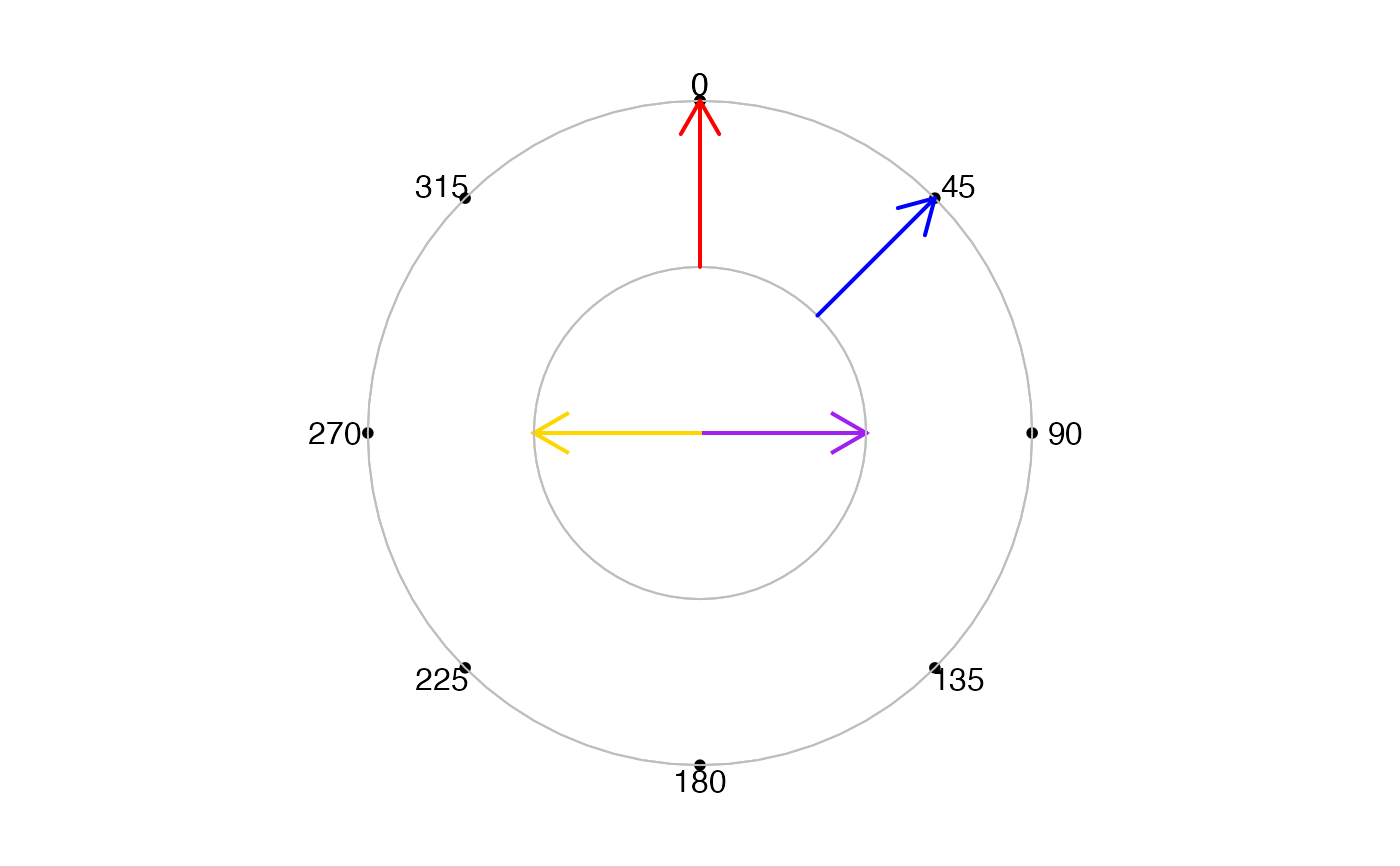
display_degrees(c(90, 270), col=c("purple", "gold"), r1=0, r2=0.5)
display_degrees(c(0, 45), col=c("red", "blue"), r1=0.5, r2=1, add=TRUE)


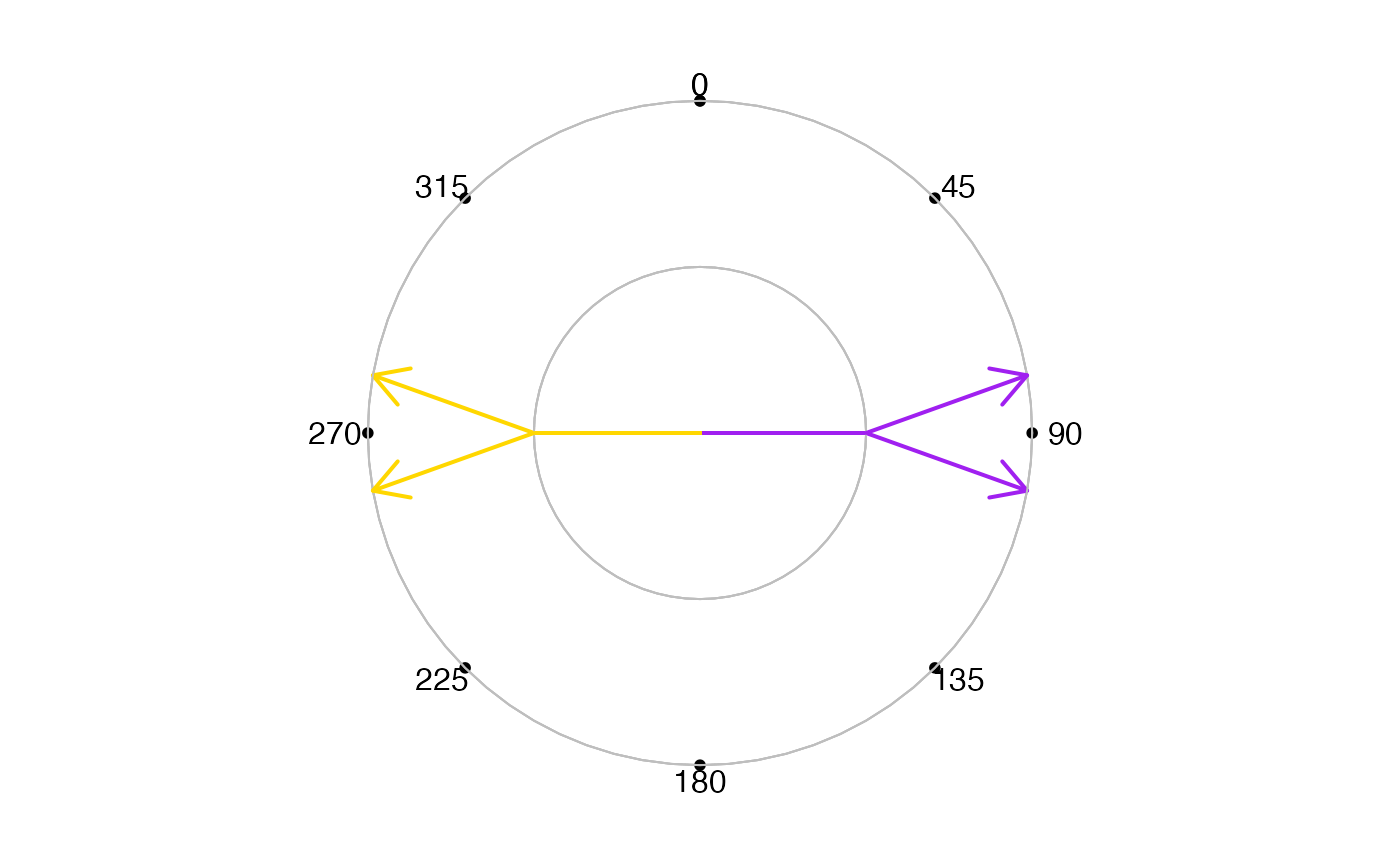
display_degrees(c(90, 270), col=c("purple", "gold"), r1=0, r2=0.5,
   arrow.length=0)
display_degrees(c(90, 270), x2=c(100, 280), col=c("purple", "gold"),
   r1=0.5, r2=1, add=TRUE)
display_degrees(c(90, 270), x2=c(80, 260), col=c("purple", "gold"),
   r1=0.5, r2=1, add=TRUE)
