Export a data.frame to 'Excel' 'xlsx' format
Usage
writeOpenxlsx(
  x,
  file = NULL,
  wb = NULL,
  sheetName = "Sheet1",
  startRow = 1,
  startCol = 1,
  append = FALSE,
  colorSub = NULL,
  headerColors = c("lightskyblue1", "lightskyblue2"),
  columnColors = c("aliceblue", "azure2"),
  highlightHeaderColors = c("tan1", "tan2"),
  highlightColors = c("moccasin", "navajowhite"),
  borderColor = "gray75",
  borderPosition = "BottomRight",
  numColumns = NULL,
  fcColumns = NULL,
  lfcColumns = NULL,
  hitColumns = NULL,
  intColumns = NULL,
  pvalueColumns = NULL,
  highlightColumns = NULL,
  numFormat = "#,##0.00",
  fcFormat = "#,##0.0",
  lfcFormat = "#,##0.0",
  hitFormat = "#,##0.0",
  intFormat = "#,##0",
  pvalueFormat = "[>0.01]0.00#;0.00E+00",
  numRule = c(1, 10, 20),
  fcRule = c(-6, 0, 6),
  lfcRule = c(-3, 0, 3),
  hitRule = c(-1.5, 0, 1.5),
  intRule = c(0, 100, 10000),
  pvalueRule = c(0, 0.01, 0.05),
  numStyle = c("#F2F0F7", "#B4B1D4", "#938EC2"),
  fcStyle = c("#4F81BD", "#EEECE1", "#C0504D"),
  lfcStyle = c("#4F81BD", "#EEECE1", "#C0504D"),
  hitStyle = c("#4F81BD", "#EEECE1", "#C0504D"),
  intStyle = c("#EEECE1", "#FDA560", "#F77F30"),
  pvalueStyle = c("#F77F30", "#FDC99B", "#EEECE1"),
  doConditional = TRUE,
  doCategorical = TRUE,
  freezePaneColumn = 0,
  freezePaneRow = 2,
  doFilter = TRUE,
  fontName = "Arial",
  fontSize = 12,
  minWidth = getOption("openxlsx.minWidth", 8),
  maxWidth = getOption("openxlsx.maxWidth", 40),
  autoWidth = TRUE,
  colWidths = NULL,
  wrapCells = FALSE,
  wrapHeaders = TRUE,
  headerRowMultiplier = 5,
  keepRownames = FALSE,
  verbose = FALSE,
  ...
)
Arguments
- x
data.frameto be saved to an 'Excel' 'xlsx' file.- file
charactervalid path to save an 'Excel' 'xlsx' file. If the file exists, andappend=TRUEthe new data will be added to the existing file using the definedsheetName.Note When
file=NULLthe output is not saved to a file, instead theWorkbookobject is returned by this function. TheWorkbookobject can be passed as argumentwbin order to add multiple sheets to the same Workbook prior to saving them together in one final step. This pattern is recommended when saving multiple sheets together into one file, as it saves much time by avoiding repeated save/load steps.
- wb
Workbookobject as defined in R packageopenxlsx, default NULL withappend=TRUEwill create a new workbook whenfiledoes not exist, or will loadfilewhen it exists. When providedwbit will be used as the input regardless of 'append'.This argument is intended to help build a workbook before saving the final result, which is more efficient for multi-sheet save operations by avoiding repeated save/load operations. When this argument is defined, data is not imported from
file, and instead the workbook data is used fromwb. This option is intended to improve speed of writing several sheets to the same output file, by preventing the slow read/write steps each time a new sheet is added.- sheetName
charactervalue less with a valid 'Excel' 'xlsx' worksheet name. At this time, June 2026, the 'sheetName' is restricted to 31 characters, with no punctuation permitted except for '-' and '_'. It does permit spaces ' '.- startRow, startCol
integerindicating the row and column number to start with the top,left cell written to the worksheet, defaults are 1.- append
logicaldefault FALSE, whether to append to file (TRUE), or to write over an existing file. Theappend=TRUEis useful when adding a worksheet to an existing file.Document Colors:
- colorSub
charactervector of R colors, whose names refer to cell values in the inputxdata.frame.- headerColors, columnColors, highlightHeaderColors, highlightColors, borderColor, borderPosition
default values for the 'Excel' worksheet background and border colors. As of version 0.0.29.900, colors must use valid 'Excel' color names.
Default values use alternating pale blue background in each column, changing to alternative tan background for highlighted columns. The default border is light grey (grey75) placed 'BottomRight'.
Column Type Assignment:
- numColumns, fcColumns, lfcColumns, hitColumns, intColumns, pvalueColumns
integervector referring the column number in the inputdata.framexto define as each column type, as relevant.- highlightColumns
integervector with one or more columns to be highlighted. Highlighted columns usehighlightHeaderColorsandhighlightColorsfor the header and cells, respectively, and apply bold font text by default.Column Type Format:
- numFormat, fcFormat, lfcFormat, hitFormat, intFormat, pvalueFormat
characterstring with valid 'Excel' cell formatting, for example"#,##0.00"defines a column to use comma-delimited numbers above one thousand, and display two decimal places in all numeric cells.IntFormatdefault shows only integer values, even when the underlying Excel value contains decimal, fractional values.numFormatdefault shows up to two decimal positions.fcFormat,lfcFormat,hitFormatdefault show one decimal position.pvalueFormatdefault shows the decimal value for values > 0.01, and the exponent format for values below 0.01.
See
[https://support.microsoft.com]topic"Excel Create and apply a custom number format."or"Excel Number format codes"for more details. Some examples below:"#,##0": display only integer values, using comma as delimiter for every thousands place. The number2142.12would be represented:"2,142""###0.0": display numeric values rounded to the0.1place, using no comma delimiter for values above one thousand. The number2142.12would be represented:"2142.1""[>0.01]0.00#;0.00E+00": this rule is a conditional format, values above0.01are represented as numbers rounded to the thousandths position0.001; values below0.01are represented with scientific notation with three digits. The number0.1256would be represented:"0.126"The number0.001256would be represented:"1.26E-03""[Red]#,###.00_);[Blue](#,###.00);[Black]0.00_)": this format applies to positive values, negative values, and zero, in order delimited by semicolons. Positive values are colored red. The string"_)"adds whitespace (defined by"_") equale to the width of the character")"to the end of positive values. Negative values are surrounded by parentheses"()"and are colored blue. Values equal to zero are represented with two trailing digits, and whitespace ("_") equal to width")". The whitespace at the end of positive values and zero are used to align all values at the same decimal position.
Column Type Rules:
- numRule, fcRule, lfcRule, hitRule, intRule, pvalueRule
numericvectorlength=3indicating the breakpoints for 'Excel' to apply conditional color formatting, using the corresponding style. Note that all conditional formatting applied by this function uses the"3-Color Scale", therefore there should be three values, and three corresponding colors in the corresponding Style arguments.numRuledefault: 1, 10, 20fcRuledefault: -6, 0, 6lfcRuledefault: -3, 0, 3hitRuledefault: -1.5, 0, 1.5intRuledefault: 0, 100, 10000pvalueRuledefault: 0, 0.01, 0.05
Column Type Styles:
- numStyle, fcStyle, lfcStyle, intStyle, hitStyle, pvalueStyle
charactervector length 3, containing three valid R colors, applied using"3-Color Scale"conditional formatting, together with the corresponding format, for examplenumStyleis applied tonumColumnsusingnumRule, then the cells are formatted withnumFormat.fcStyle,lfcStyle,hitStyleuse blue-white-red divergent colors, expected to be centered at zero byfcRulefor example.numStyleuses a purple gradient inspired by RColorBrewer "Purples".intStyleuses red-orange colors inspired by RColorBrewer "OrRd".pvalueStyleuses red-orange colors, reversed so that significant values, beginning at 0.05 by default, become more red red.
Alpha transparency is removed, as required.
Enable Conditional and Categorical Formatting:
- doConditional
logicaldefault TRUE, whether to apply conditional formatting. Note only the background cell color is affected, as well as contrasting text color.- doCategorical
logicaldefault TRUE, whether to apply categorical color formatting, only relevant whencolorSubis defined. Note only the background cell color is affected, as well as contrasting text color.Document Customization:
- freezePaneColumn, freezePaneRow
integervalue of the row or column before which the 'Excel' "freeze panes" is applied. DefaultfreezePaneColumn=0will not maintain any columns. DefaultfreezePaneRow=2will maintain the first row of column headers. Units are relative to thedata.framebeing saved, and will automatically be adjusted bystartRowandstartColwhere applicable.- doFilter
logicaldefault TRUE, whether to enable column filtering by default.- fontName
characterfont, default 'Arial', with a valid 'Excel' font name for the output document.- fontSize
numericdefault 12, font size in 'Excel' points.- minWidth, maxWidth
numericminimum, maximum size, defaults 8 and 30, respectively, and which usesoptions()'openxlsx.minWidth' and 'openxlsx.maxWidth' when defined. Units are character units as defined by 'Excel', and are used whenautoWidth=TRUEas default, to restrict cell widths. ArgumentcolWidthsis usually preferred, where possible.- autoWidth
logicaldefault TRUE, whether to permit Excel to attempt automatic column widths, withinminWidthmaxWidthwidths. Excel has a tendency to set the column width based upon column values, and not the column header, thereforecolWidthsis recommended.- colWidths
numericwidth of each column inx, recycled to the total number of columns required. Default NULL does not apply specific widths, instead Excel will attempt default widths. WhenkeepRownames=TRUE, the first column containsrownames(x), therefore the length of expectedcolWidthsisncol(x) + 1.- wrapCells
logicaldefault FALSE, whether to word-wrap within cells. The default FALSE is effective when used together with specificcolWidths.- wrapHeaders
logicaldefault TRUE, whether to enable word wrap for column headers, which is helpful whenautoWidth=TRUEsince it fixed the cell width while allowing the column header to be seen.- headerRowMultiplier
numericdefault 5, the row height of the first header row in 'Excel'. This value is defined as a multiple of subsequent rows, and should usually represent the maximum number of lines after word-wrapping, as relevant. This argument is helpful whenwrapHeaders=TRUEandautoWidth=TRUE.- keepRownames
logicaldefault FALSE, whether to includerownames(x)in its own column in 'Excel'.- verbose
logicalindicating whether to print verbose output.- ...
additional arguments are passed to
applyXlsxConditionalFormat()andapplyXlsxCategoricalFormat()as relevant.
Value
Workbook object as defined by the openxlsx package
is returned invisibly with invisible(). This Workbook
can be used in argument wb to provide a speed boost when
saving multiple sheets to the same file.
Details
This function is a minor but useful customization of the
openxlsx::saveWorkbook() and associated functions, intended
to provide some pre-configured formatting of known column
types, typically relevant to statistical values, and
in some cases, gene or transcript expression values.
Important Note: Within 'Microsoft Excel', it stores the complete numeric value, and simply displays that value with any customized format as defined. When using 'Microsoft Excel' to export to a text file, it will apply this visible formatting during that step, which may cause some information to be lost.
There are numerous configurable options when saving an 'Excel' worksheet, most of the defaults in this function are intended not to require changes, but are listed as formal function arguments to make each option visibly obvious.
If colorSub is supplied as a named vector of colors, then
by default text values will be colorized accordingly, which
can be especially helpful when including data with categorical
text values.
Conditional formatting is applied to several recognized types
of data types, defined by numColumns, intColumns, fcColumns,
lfcColumns, pvalueColumns, hitColumns.
Conditional formatting is much more efficient than applying
specific colors to each cell in a large worksheet, for example
if using a color function to assign colors to numeric values,
it would need to be applied as individual color styles, and
each unique style is stored as such in the Excel workbook.
A column with 12,000 distinct numeric values may therefore
contain hundreds or thousands of individual cell style definitions,
which is very inefficient for an Excel workbook.
This function pre-configures formatting options for the following column data types, each of which has conditional color-formatting, defined numeric ranges, and color scales.
- int
integer values, where numeric values are formatted without visible decimal places, and the
big.mark=","standard is used to help visually distinguish large integers. The color scale is by default c(0, 100, 10000).- num
numeric values, with fixed number of visible decimal places, which helps visibly align values along each row.
- hit
numeric type, a subset of "int" intended when data is flagged with something like a "+1" or "-1" to indicate a statistical increase or decrease.
- pvalue
P-value, where numeric values range from 1 down near zero, and values are formatted consistently with scientific notation.
- fc
numeric fold change, whose values are expected to range from 1 and higher, and -1 and lower. Decimal places are by default configured to show one decimal place, to simplify the 'Excel' visual summary.
- lfc
numeric log fold change, whose values are expected to be centered at zero. Decimal places are by default configured to show one decimal place, to simplify the 'Excel' visual summary.
- highlight
character and undefined columns to be highlighted with a brighter background color, and bold text.
For each column data type, a color scale and default numeric range is defined, which allows conditional formatting of cells based upon expected ranges of values.
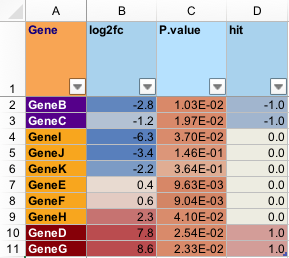
A screenshot of the file produced by the example is shown below.
See also
Other jam export functions:
applyXlsxCategoricalFormat(),
applyXlsxConditionalFormat(),
readOpenxlsx(),
set_xlsx_colwidths(),
set_xlsx_rowheights()
Examples
# set up a test data.frame
set.seed(123);
lfc <- -3:3 + stats::rnorm(7)/3;
colorSub <- nameVector(
   rainbow2(7),
   LETTERS[1:7])
df <- data.frame(name=LETTERS[1:7],
   int=round(4^(1:7)),
   num=(1:7)*4-2 + stats::rnorm(7),
   fold=2^abs(lfc)*sign(lfc),
   lfc=lfc,
   pvalue=10^(-1:-7 + stats::rnorm(7)),
   hit=sample(c(-1,0,0,1,1), replace=TRUE, size=7));
df;
#>   name   int        num      fold        lfc       pvalue hit
#> 1    A     4  0.7349388 -9.106049 -3.1868252 2.780730e-02   0
#> 2    B    16  5.3131471 -4.218488 -2.0767258 6.122279e-01   1
#> 3    C    64  9.5543380 -1.395160 -0.4804306 3.146665e-03  -1
#> 4    D   256 15.2240818  1.016424  0.0235028 1.079898e-06  -1
#> 5    E  1024 18.3598138  2.060645  1.0430959 5.027544e-05   0
#> 6    F  4096 22.4007715  5.945047  2.5716883 3.366732e-07   0
#> 7    G 16384 26.1106827  8.898972  3.1536387 8.554139e-09   1
# write to tempfile for examples
if (FALSE) { # \dontrun{
   out_xlsx <- tempfile(pattern="writeOpenxlsx_", fileext=".xlsx")
   writeOpenxlsx(x=df,
      file=out_xlsx,
      sheetName="jamba_test",
      colorSub=colorSub,
      intColumns=2,
      numColumns=3,
      fcColumns=4,
      lfcColumns=5,
      pvalueColumns=6,
      hitColumn=7,
      freezePaneRow=2,
      freezePaneColumn=2,
      append=FALSE);
   # now read it back
   df_list <- readOpenxlsx(xlsx=out_xlsx);
   sdim(df_list)
} # }