Simulate SummarizedExperiment tests, with adjustable batch effect.
Usage
simulate_se_test(
  ngroups = 4,
  nreps = 5,
  nrow = 250,
  multiplier = 1.5,
  offset = 7,
  batch_ex = 0.15,
  hit_exp = 2,
  hit_fraction = 1/2,
  hit_max = 2.8,
  noise_factor = 1,
  seed = 123,
  assay_name = "counts",
  sparsity = 0,
  verbose = FALSE,
  ...
)
Arguments
- ngroups
integernumber of experimental groups- nreps
integernumber of replicates per group, can be used to provide the number of replicates for each group in order.- nrow
integernumber of rows (measurements)- multiplier
numericvalue multiplied byrnorm()to adjust the magnitude of values produced, default 1.- offset
numericvalue added to the output ofrnorm(), default 7.- batch_ex
numericadjustment for batch effect, default0.15is a moderate batch effect, it would require adjustment or blocking or covariate for effective analysis.- hit_exp
numericdefault 2, adjust the "sharpness" of differential changes, higher values are sharper, with fewer strong hits.- hit_fraction
numericvalue between 0 and 1 indicating the fraction of rows to simulate as having a fold change, default 1/2.- hit_max
numericmaximum value for a simulated fold change, default 2.8, intended to be interpreted as log2 of a 7-fold change.- noise_factor
numericmultiplied byrnorm()to add additional noise.- seed
numericpassed toset.seed()when provided, for reproducible random output.- assay_name
charactername to use for the assay name in the output.- sparsity
numericvalue from 0 to 1, default 0, indicating the fraction of values that are converted toNAto simulate sparse data measurements. It can be provided as a vector and applied to each group in order. In some proteomics datasets, control samples may be substantially more sparse than other groups, for example if the control is non-targeted IP, or negative control. In this case, data can be simulated by usingsparsity=c(0.6, 0, 0)for three groups.- verbose
logicalindicating whether to print verbose output.- ...
additional arguments are ignored.
Details
This function extends make_se_test() in two ways:
For four-group scenario, it will generate two-factor changes.
Batch effects are generated, adjustable with
batch_ex. Usebatch_ex=0for no batch effect. See examples for demonstration of centering within batch as visual cue that batch effect is well-defined.
See also
Other jamses SE utilities:
geomx_to_se(),
make_se_test(),
se_collapse_by_column(),
se_collapse_by_row(),
se_detected_rows(),
se_normalize(),
se_rbind(),
se_to_assay_data(),
se_to_assay_names(),
se_to_rowcoldata()
Examples
# batch effects
seb <- simulate_se_test();
#> Warning: first element used of 'each' argument
#> Warning: first element used of 'each' argument
#> Warning: data length [1249] is not a sub-multiple or multiple of the number of rows [250]
#> Warning: first element used of 'length.out' argument
#> Warning: first element used of 'length.out' argument
#> Warning: first element used of 'length.out' argument
#> Warning: first element used of 'length.out' argument
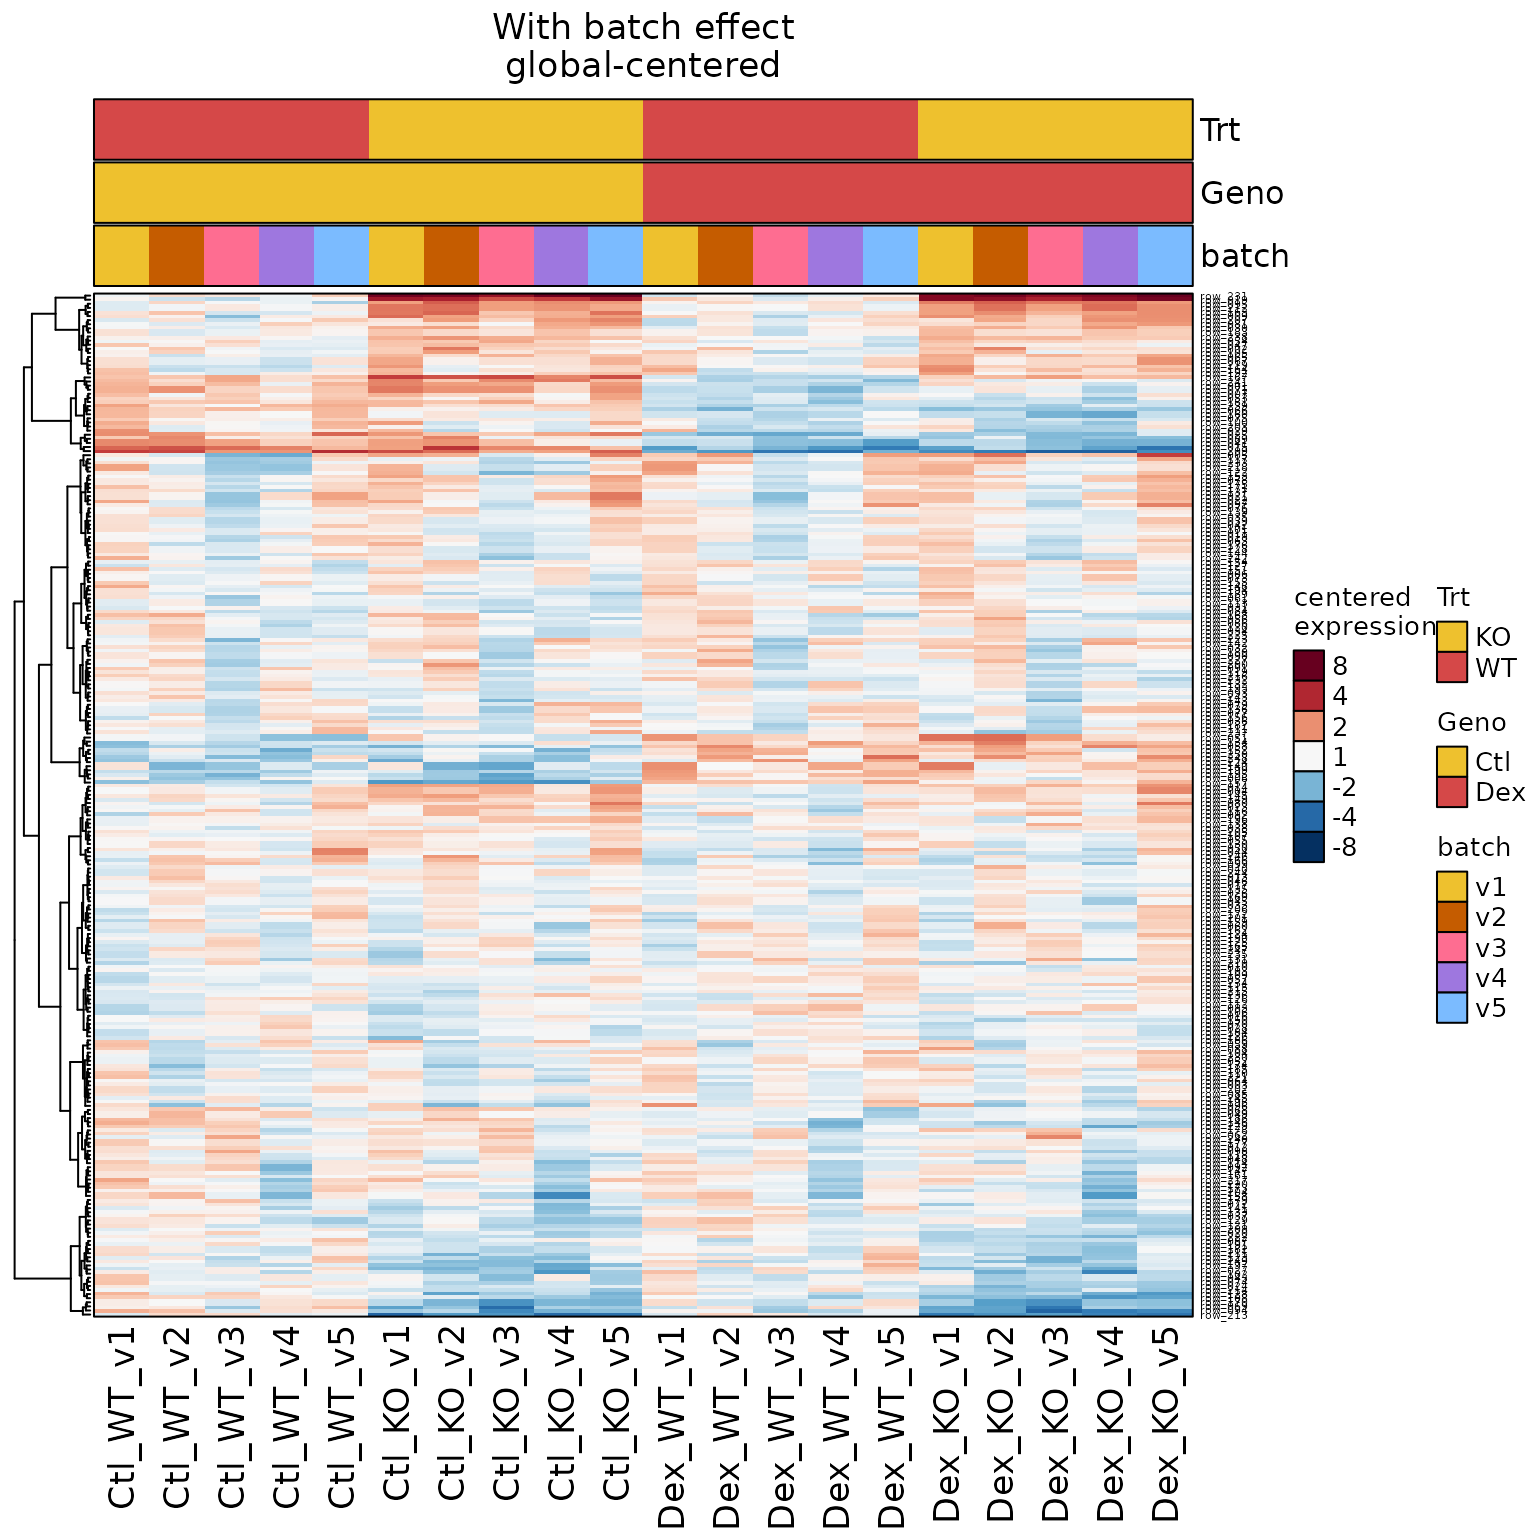
hmb <- heatmap_se(seb,
controlSamples=colnames(seb)[c(1:5, 11:15)],
column_title="With batch effect\nglobal-centered")
hmb
 # when centering versus a sparse control group, some values can be lost:
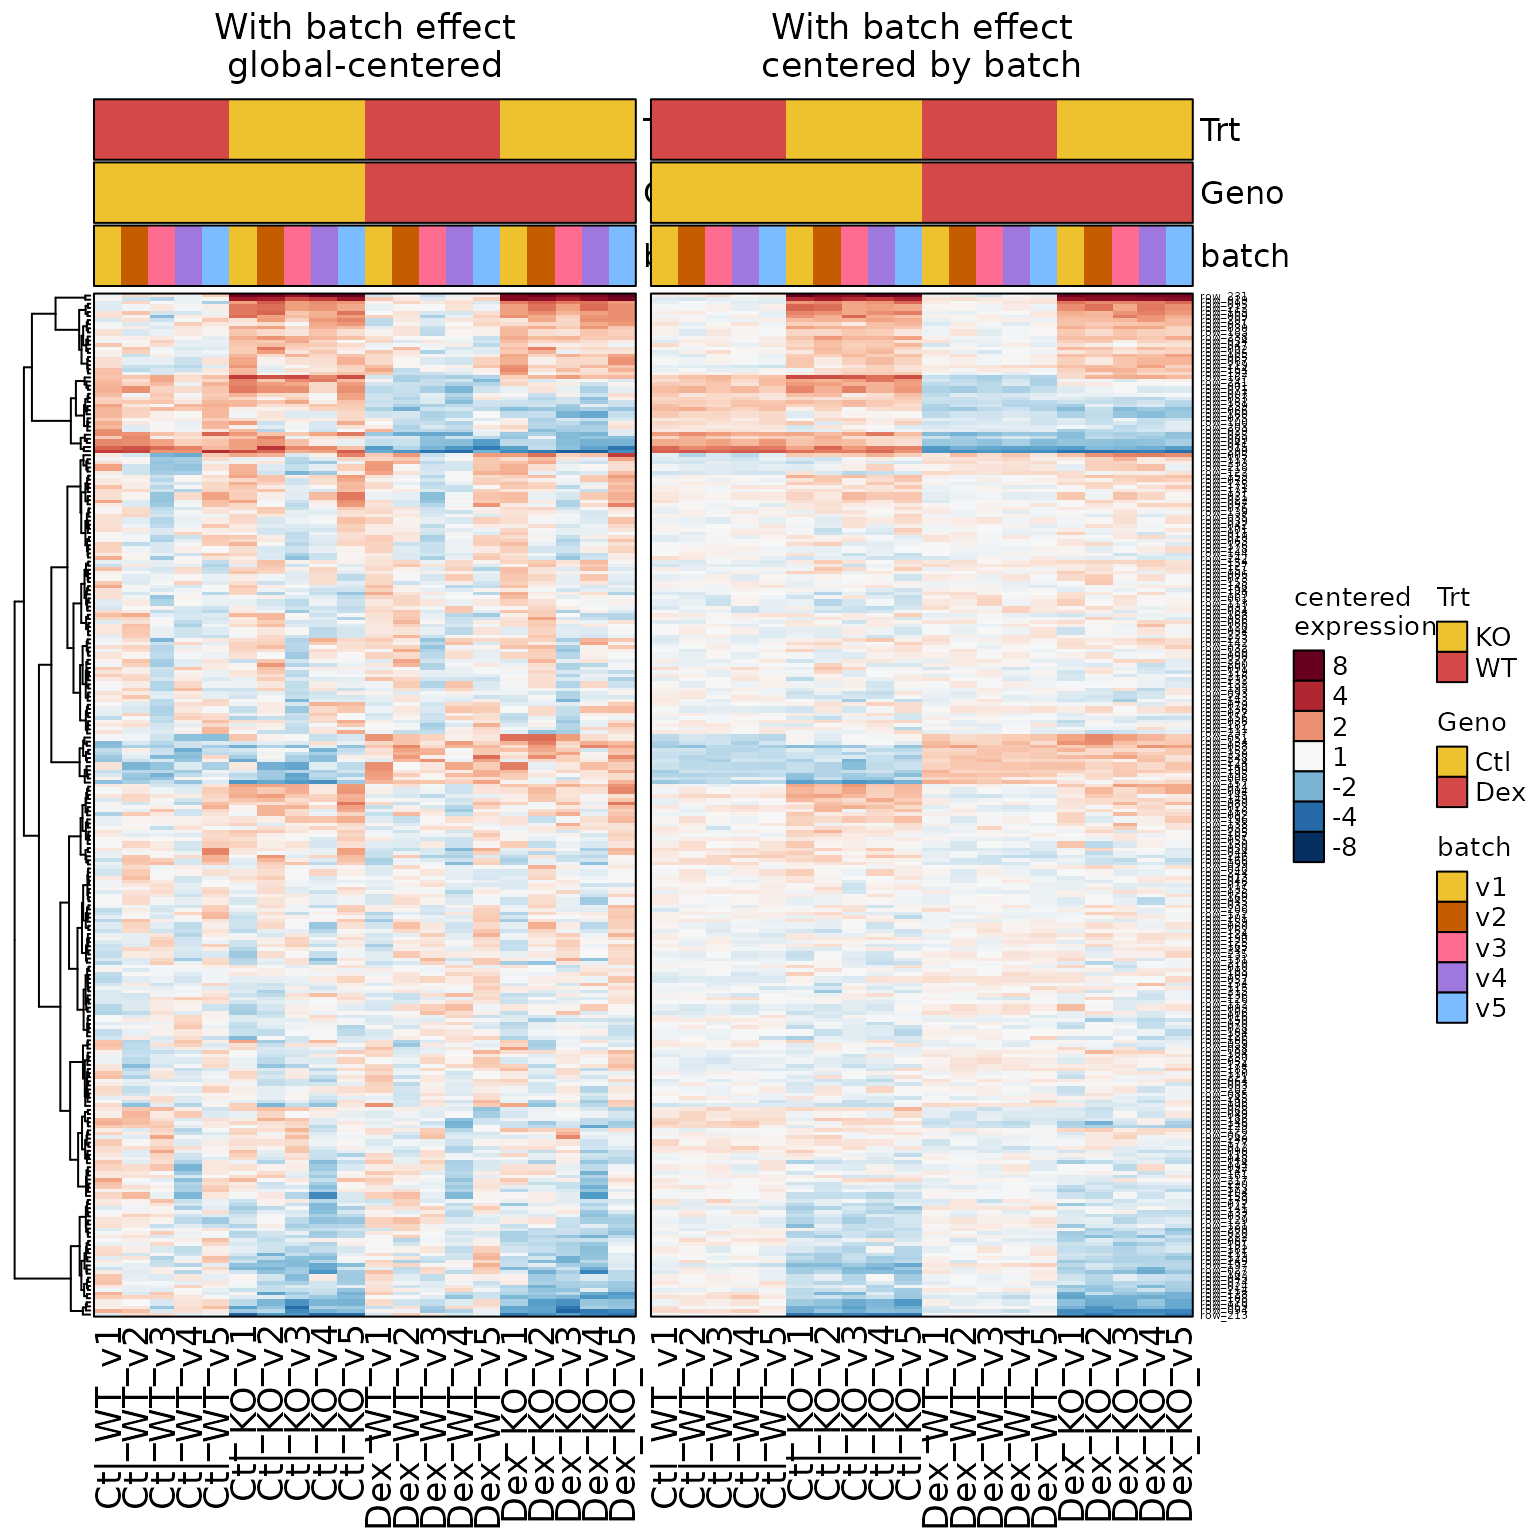
hmbg <- heatmap_se(seb,
controlSamples=colnames(seb)[c(1:5, 11:15)],
centerby_colnames="batch",
column_title="With batch effect\ncentered by batch")
hmb + hmbg
#> Warning: Heatmap/annotation names are duplicated: centered expression
# when centering versus a sparse control group, some values can be lost:
hmbg <- heatmap_se(seb,
controlSamples=colnames(seb)[c(1:5, 11:15)],
centerby_colnames="batch",
column_title="With batch effect\ncentered by batch")
hmb + hmbg
#> Warning: Heatmap/annotation names are duplicated: centered expression
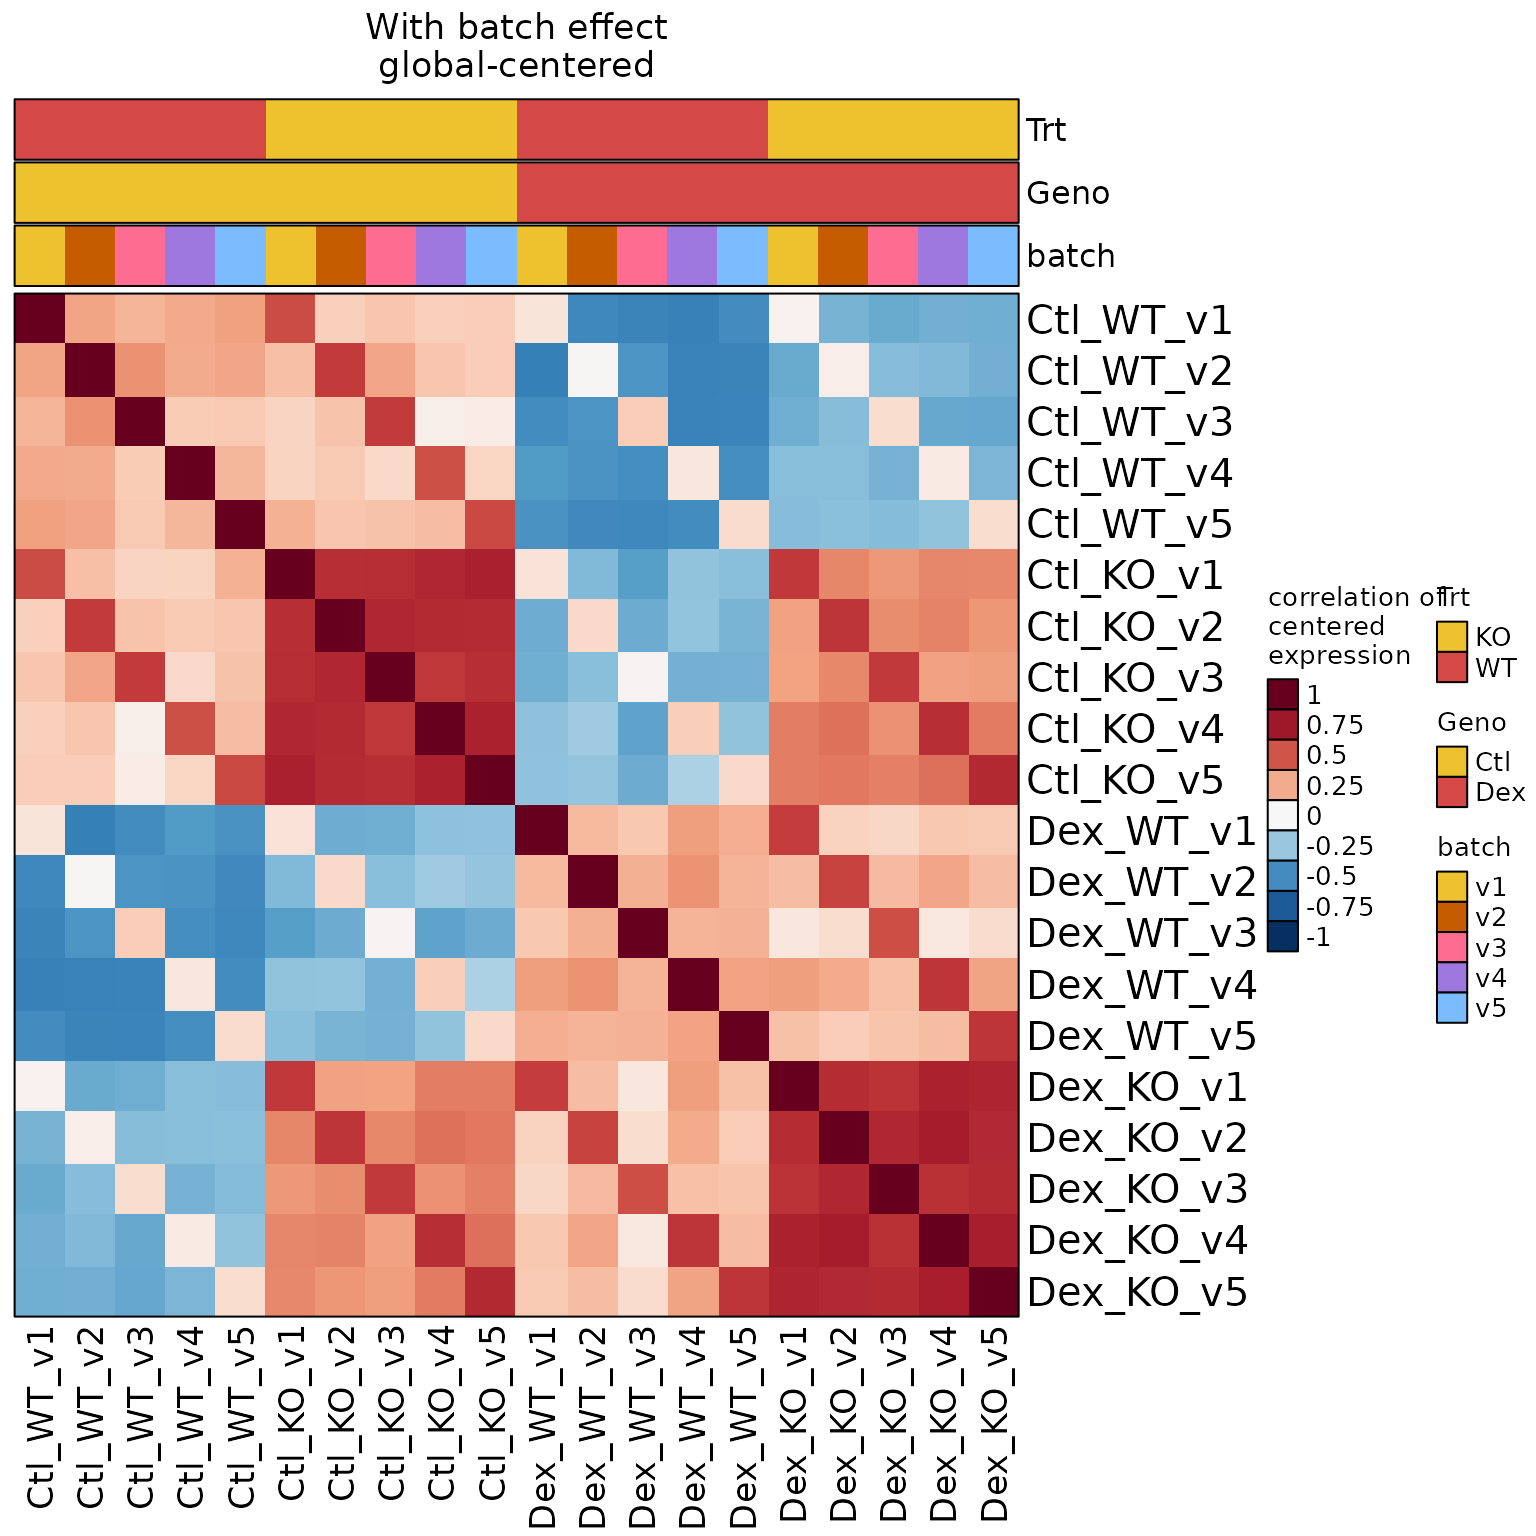
 hmbc <- heatmap_se(seb,
correlation=TRUE,
controlSamples=colnames(seb)[c(1:5, 11:15)],
column_title="With batch effect\nglobal-centered")
hmbc
hmbc <- heatmap_se(seb,
correlation=TRUE,
controlSamples=colnames(seb)[c(1:5, 11:15)],
column_title="With batch effect\nglobal-centered")
hmbc
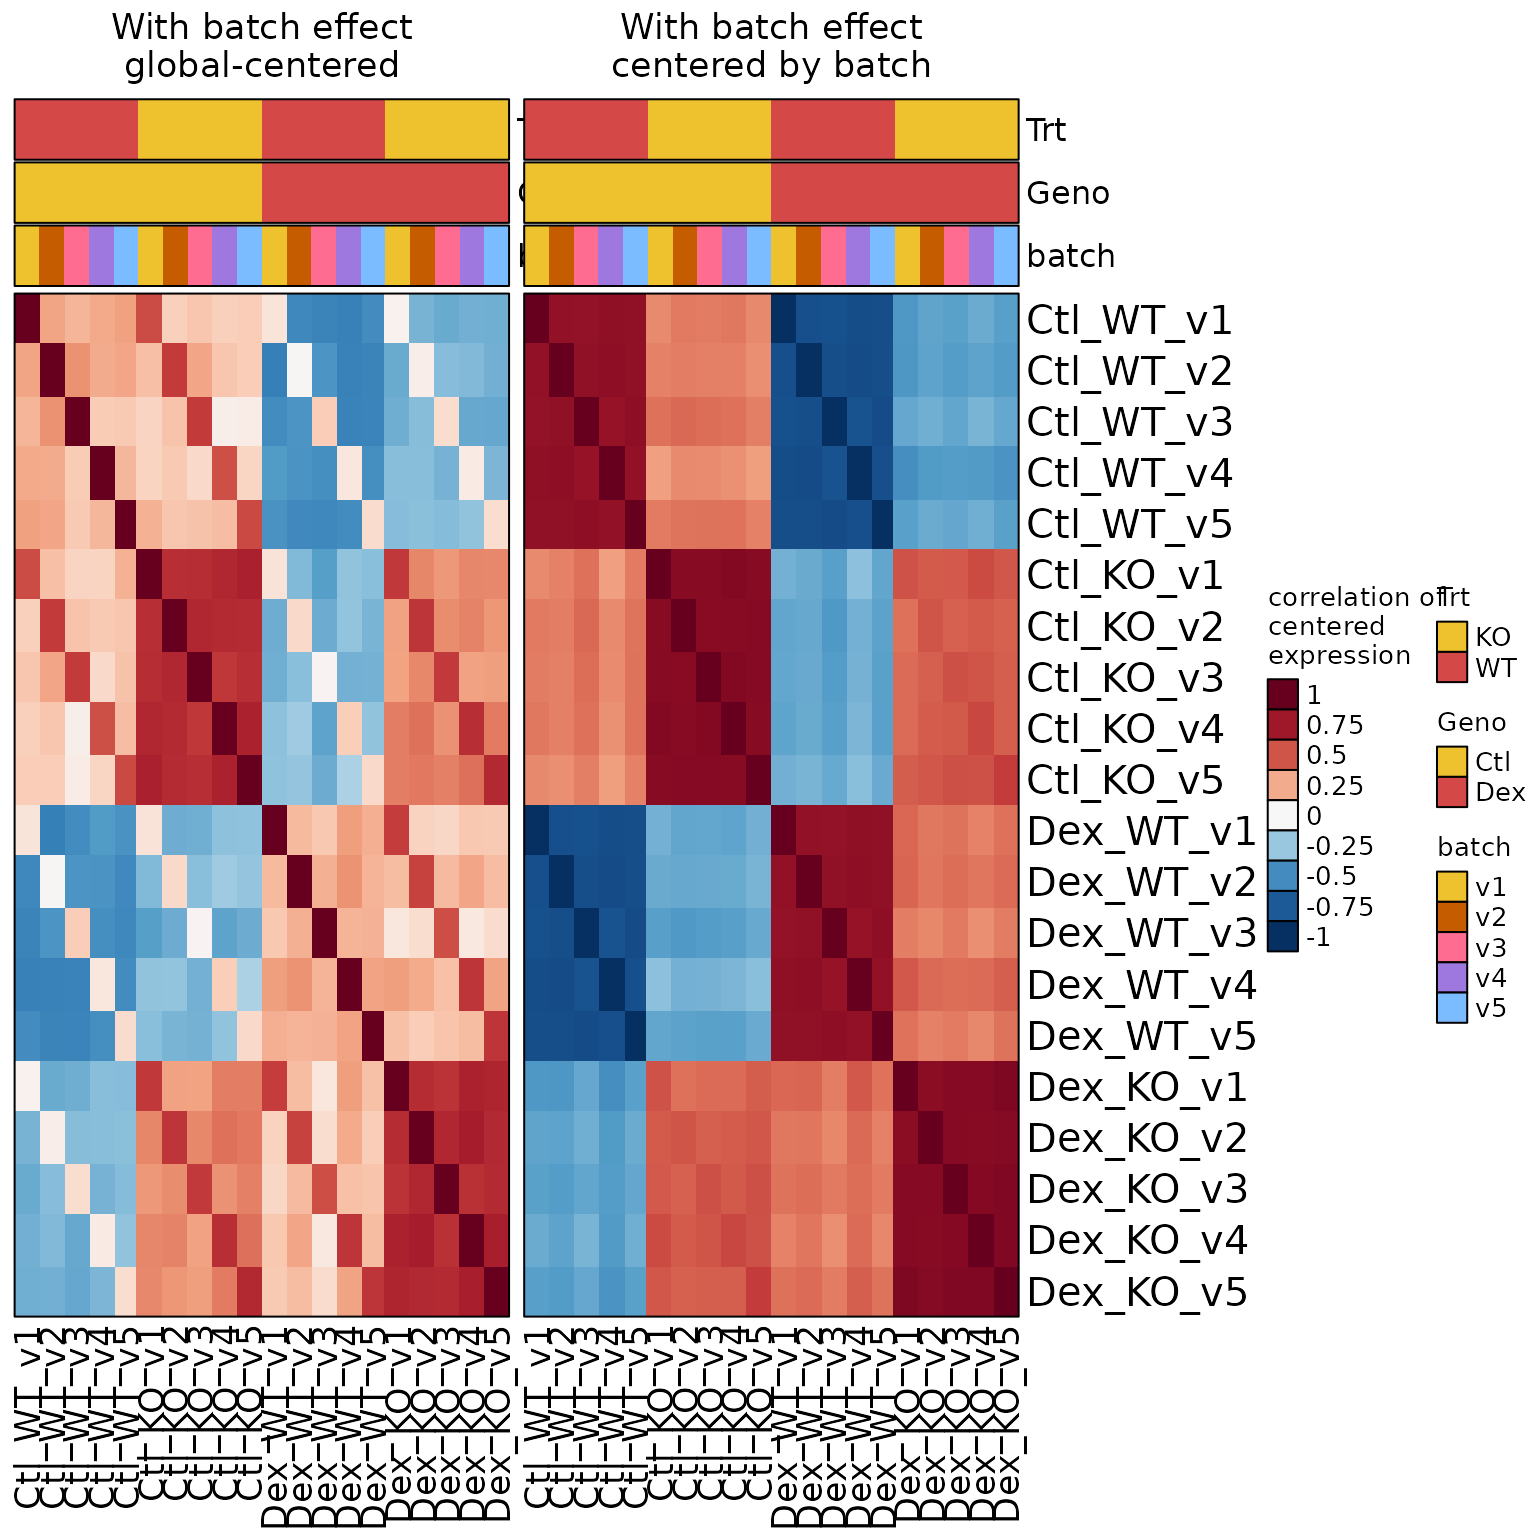
 hmbgc <- heatmap_se(seb,
correlation=TRUE,
controlSamples=colnames(seb)[c(1:5, 11:15)],
centerby_colnames="batch",
column_title="With batch effect\ncentered by batch")
hmbgc
hmbgc <- heatmap_se(seb,
correlation=TRUE,
controlSamples=colnames(seb)[c(1:5, 11:15)],
centerby_colnames="batch",
column_title="With batch effect\ncentered by batch")
hmbgc
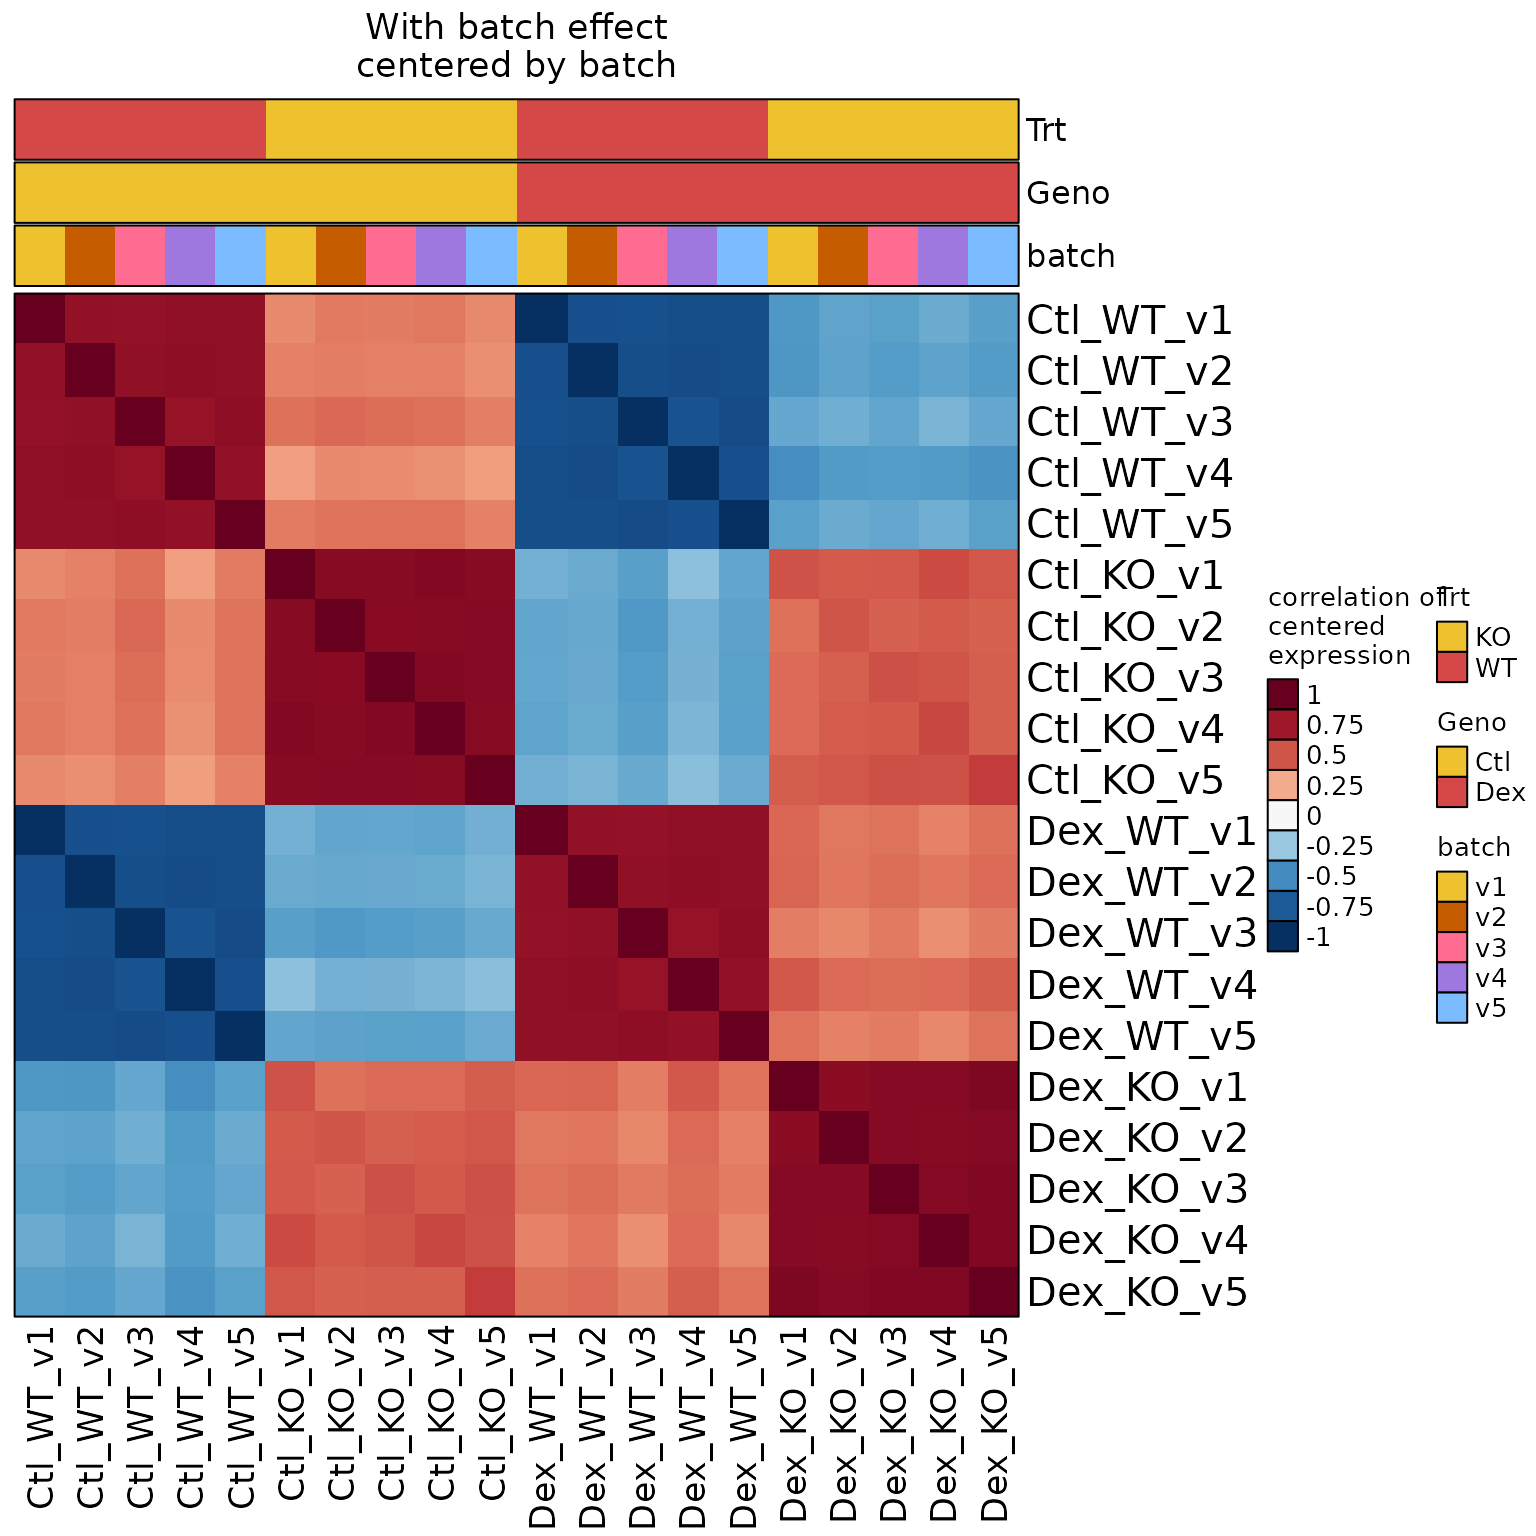 hmbc + hmbgc
#> Warning: Heatmap/annotation names are duplicated: correlation of centered
#> expression
hmbc + hmbgc
#> Warning: Heatmap/annotation names are duplicated: correlation of centered
#> expression