Make SummarizedExperiment test data
Usage
make_se_test(
  ngroups = 2,
  nreps = 3,
  nrow = 50,
  multiplier = 1,
  offset = 7,
  hit_fraction = 1/2,
  hit_max = 2.8,
  noise_factor = 1,
  seed = 123,
  assay_name = "counts",
  sparsity = 0,
  verbose = FALSE,
  ...
)
Arguments
- ngroups
integernumber of experimental groups- nreps
integernumber of replicates per group, can be used to provide the number of replicates for each group in order.- nrow
integernumber of rows (measurements)- multiplier
numericvalue multiplied byrnorm()to adjust the magnitude of values produced, default 1.- offset
numericvalue added to the output ofrnorm(), default 7.- hit_fraction
numericvalue between 0 and 1 indicating the fraction of rows to simulate as having a fold change, default 1/2.- hit_max
numericmaximum value for a simulated fold change, default 2.8, intended to be interpreted as log2 of a 7-fold change.- noise_factor
numericmultiplied byrnorm()to add additional noise.- seed
numericpassed toset.seed()when provided, for reproducible random output.- assay_name
charactername to use for the assay name in the output.- sparsity
numericvalue from 0 to 1, default 0, indicating the fraction of values that are converted toNAto simulate sparse data measurements. It can be provided as a vector and applied to each group in order. In some proteomics datasets, control samples may be substantially more sparse than other groups, for example if the control is non-targeted IP, or negative control. In this case, data can be simulated by usingsparsity=c(0.6, 0, 0)for three groups.- verbose
logicalindicating whether to print verbose output.- ...
additional arguments are ignored.
See also
Other jamses SE utilities:
geomx_to_se(),
se_collapse_by_column(),
se_collapse_by_row(),
se_detected_rows(),
se_normalize(),
se_rbind(),
se_to_assay_data(),
se_to_assay_names(),
se_to_rowcoldata(),
simulate_se_test()
Examples
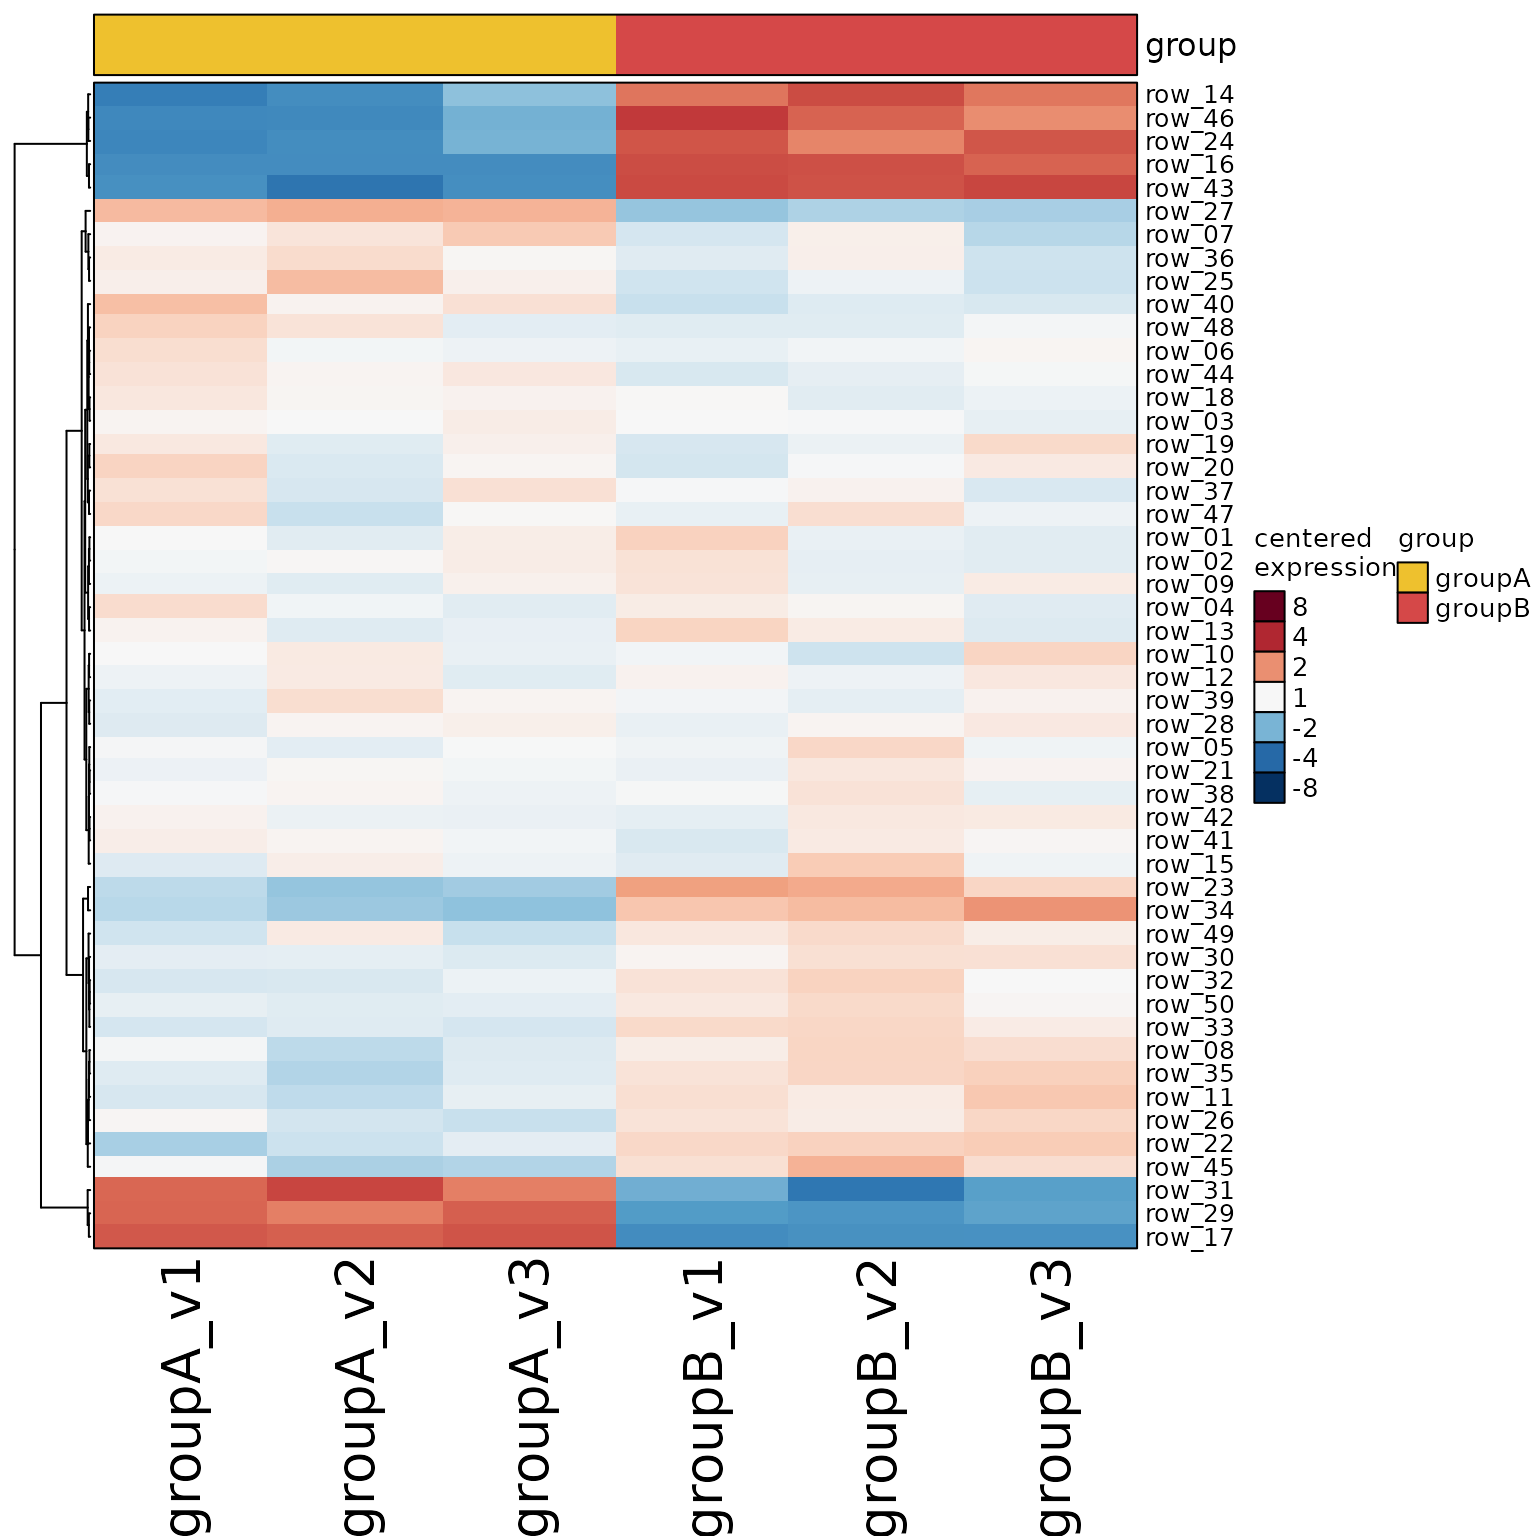
se <- make_se_test();
heatmap_se(se)
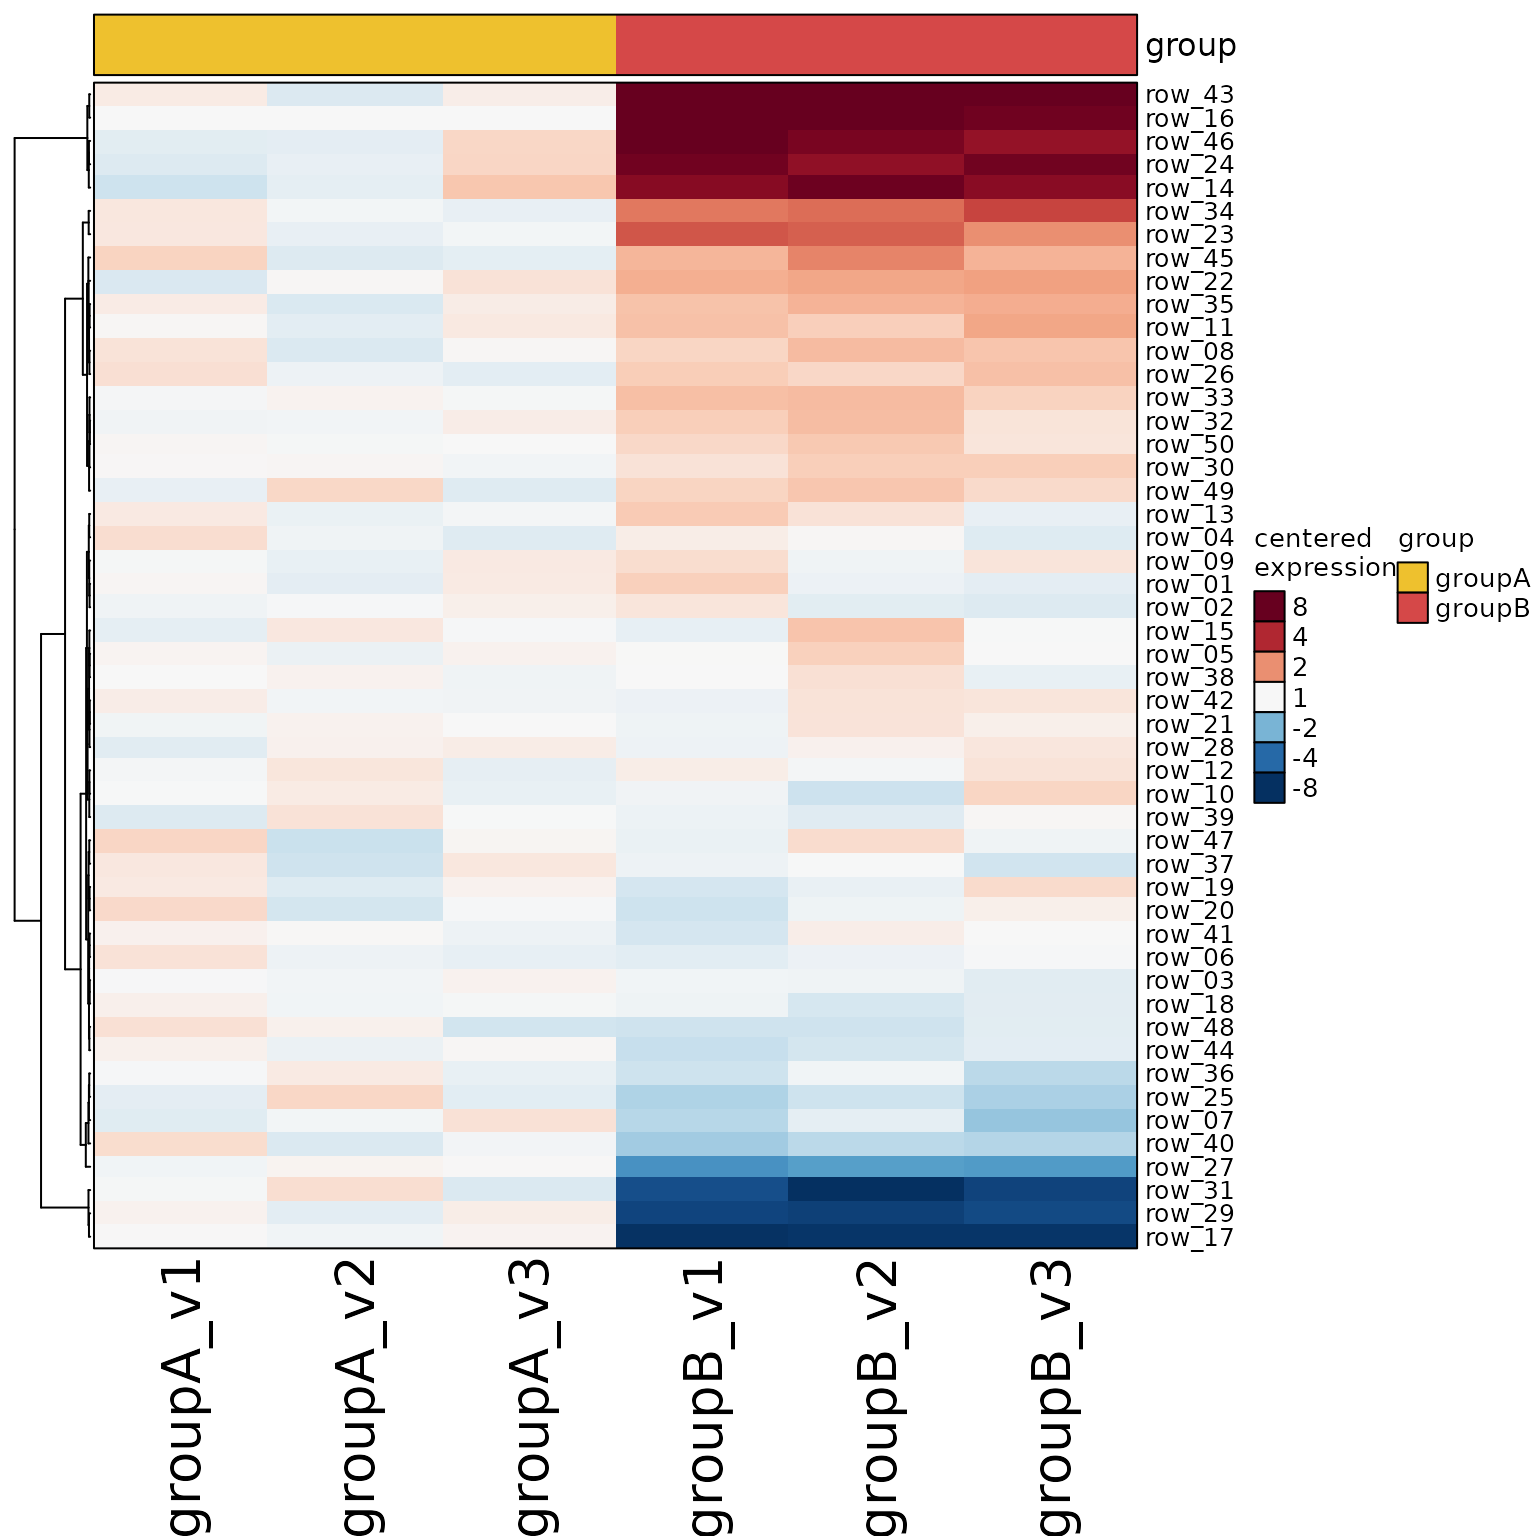
 heatmap_se(se, controlSamples=1:3)
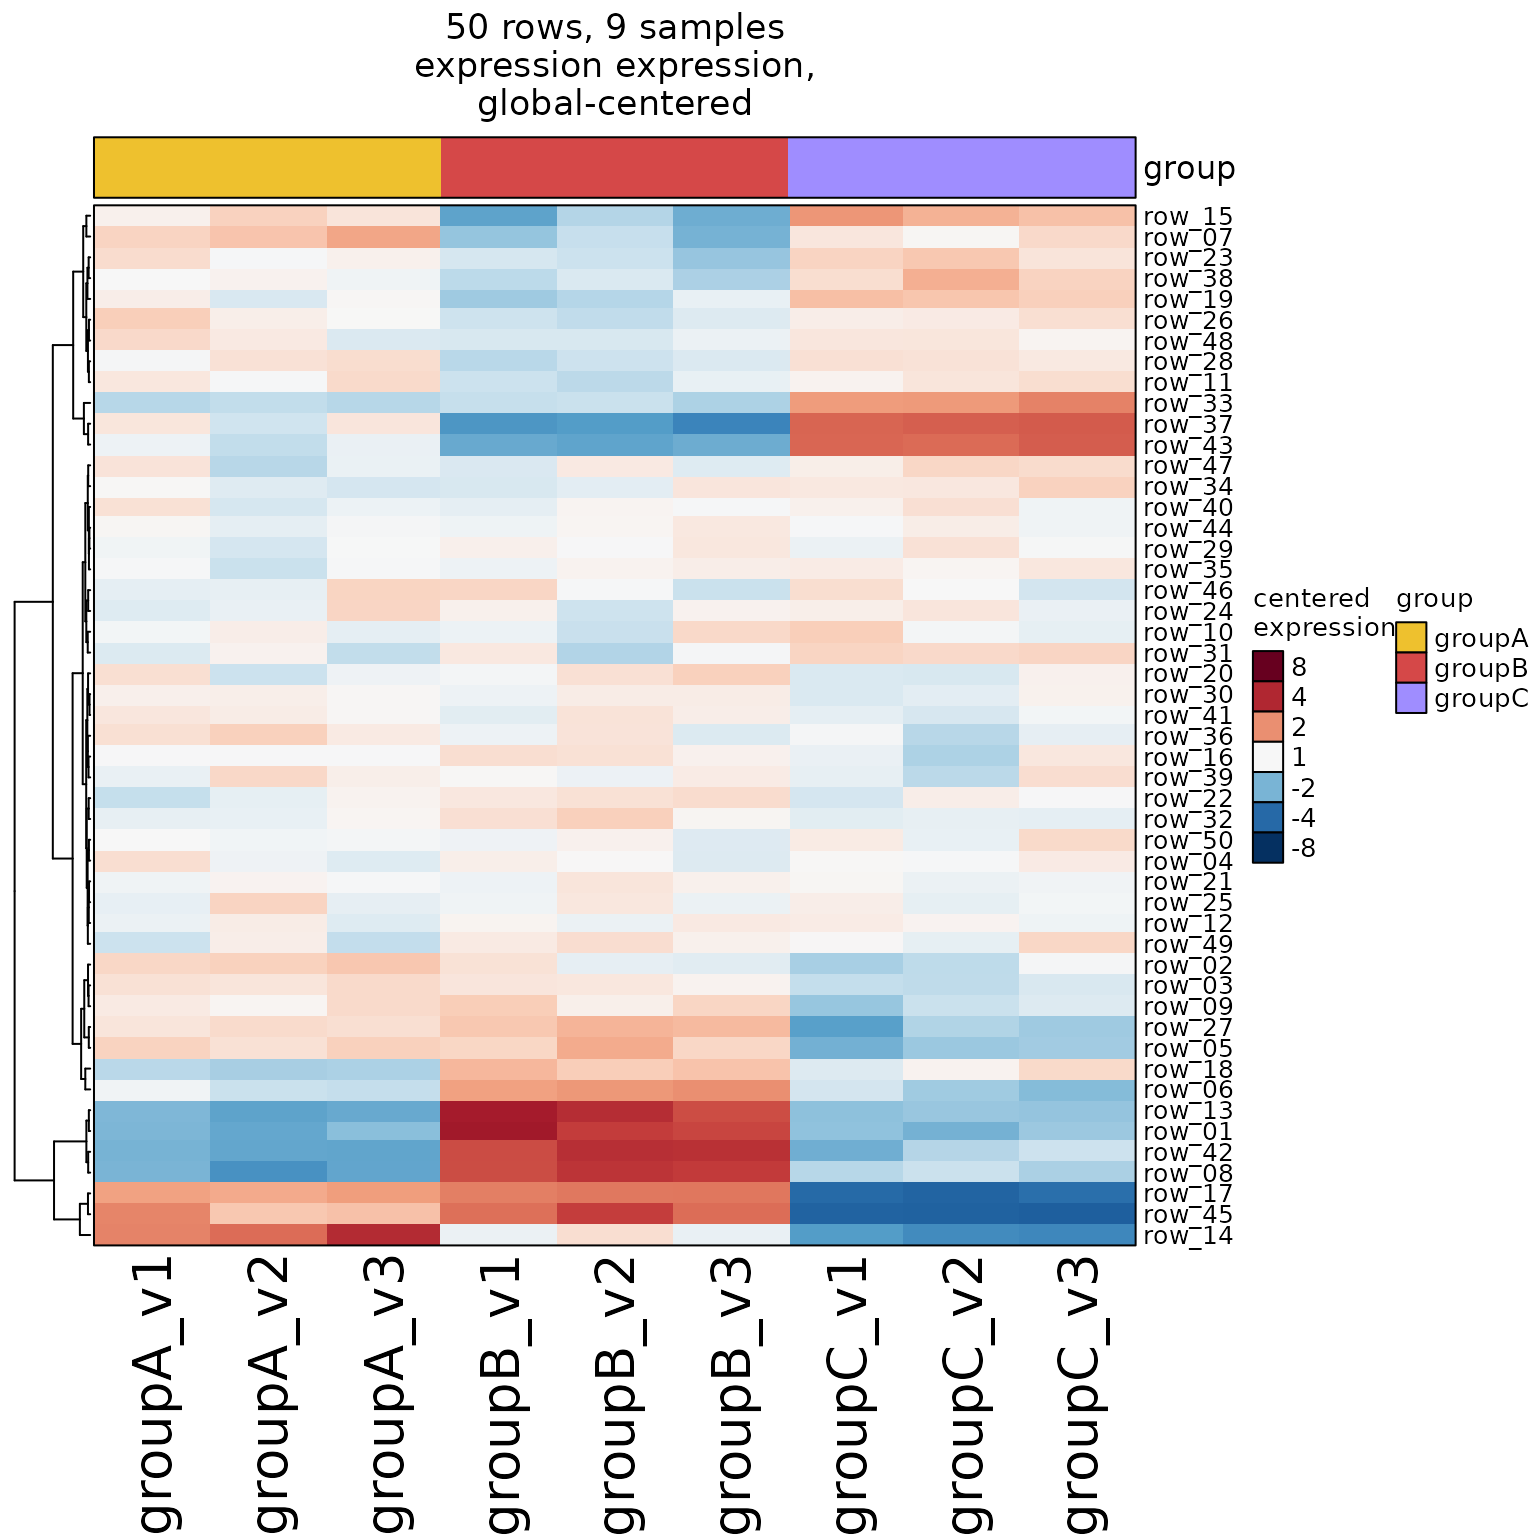
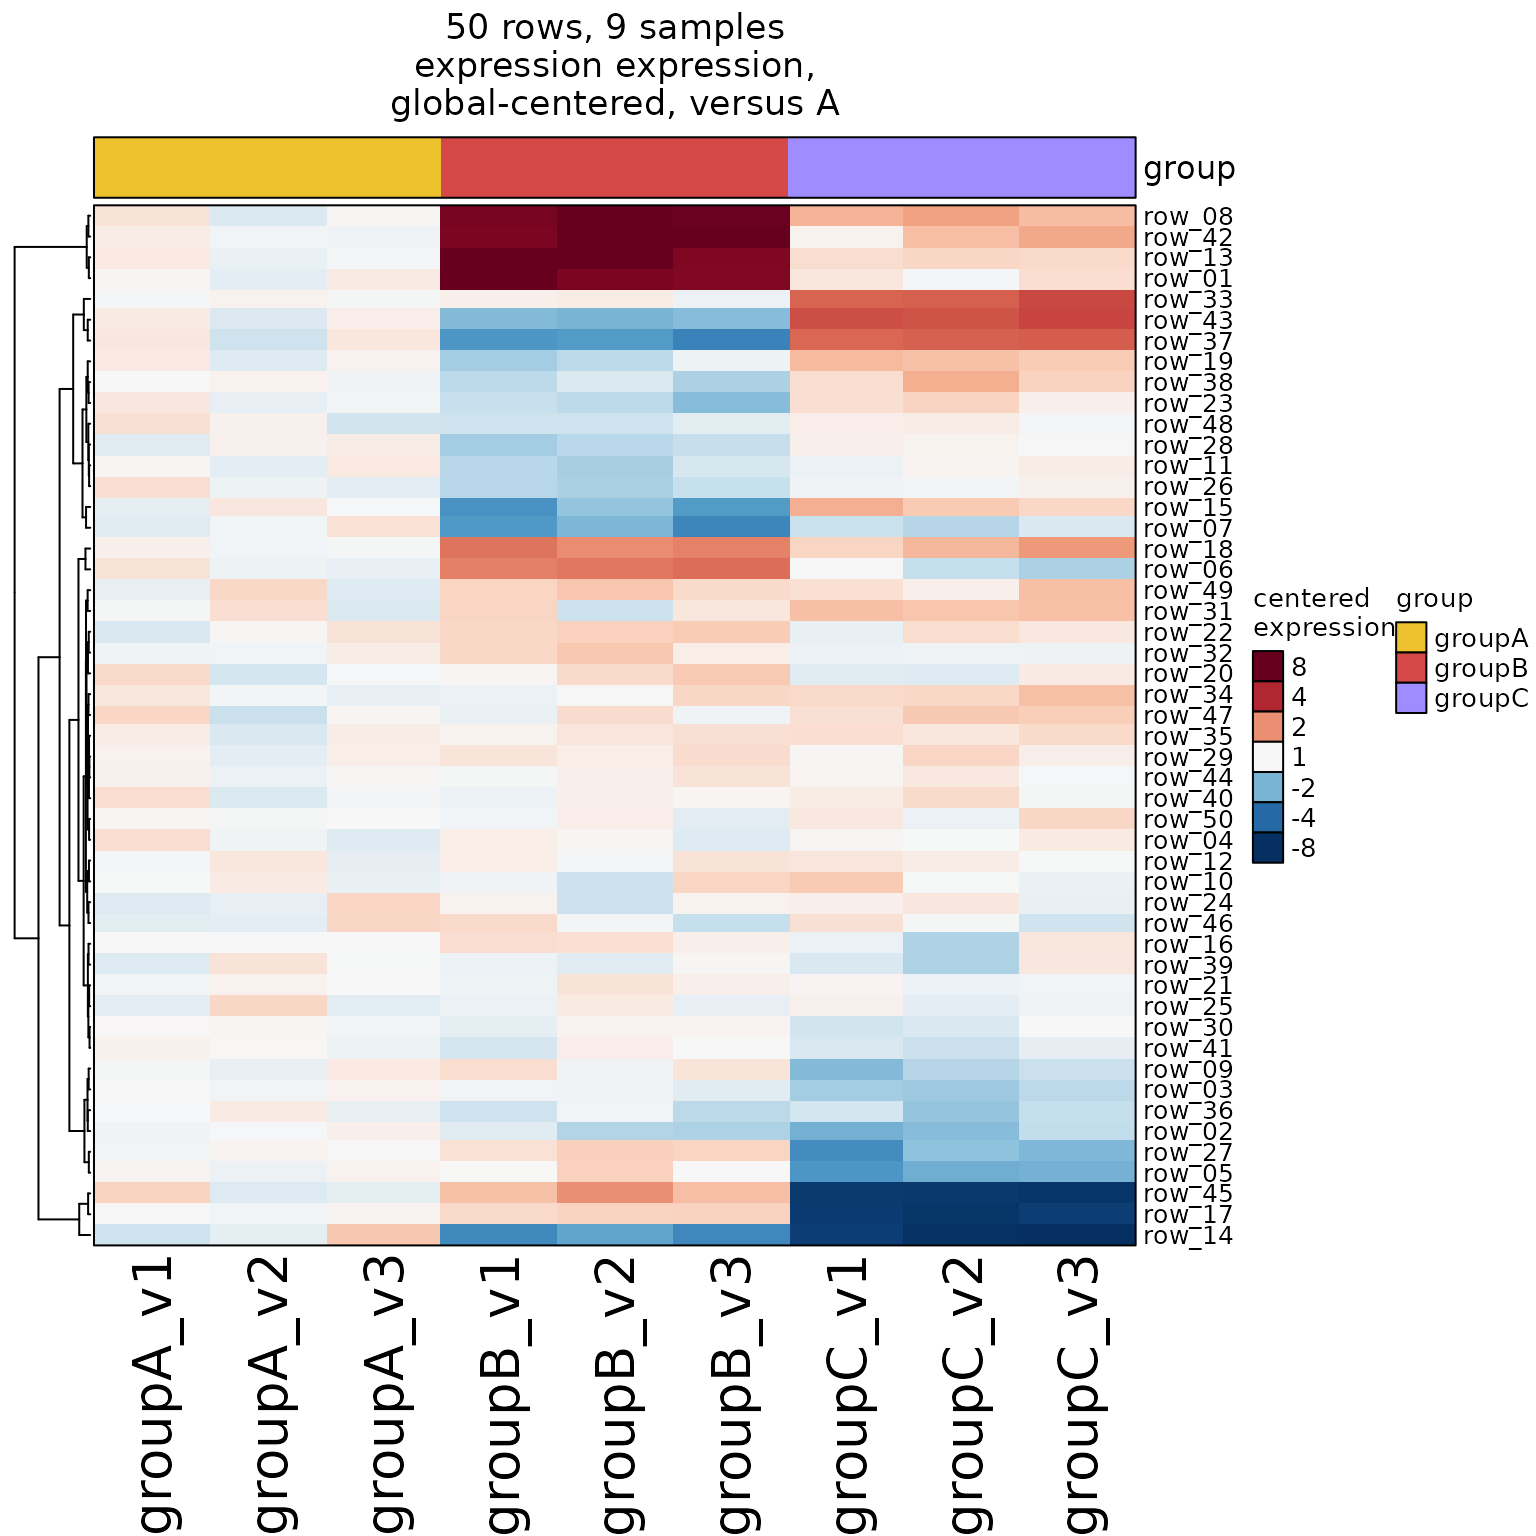
 se <- make_se_test(ngroups=3, assay_name="expression");
heatmap_se(se, apply_hm_column_title=TRUE)
se <- make_se_test(ngroups=3, assay_name="expression");
heatmap_se(se, apply_hm_column_title=TRUE)
 heatmap_se(se, controlSamples=1:3, control_label="versus A", apply_hm_column_title=TRUE)
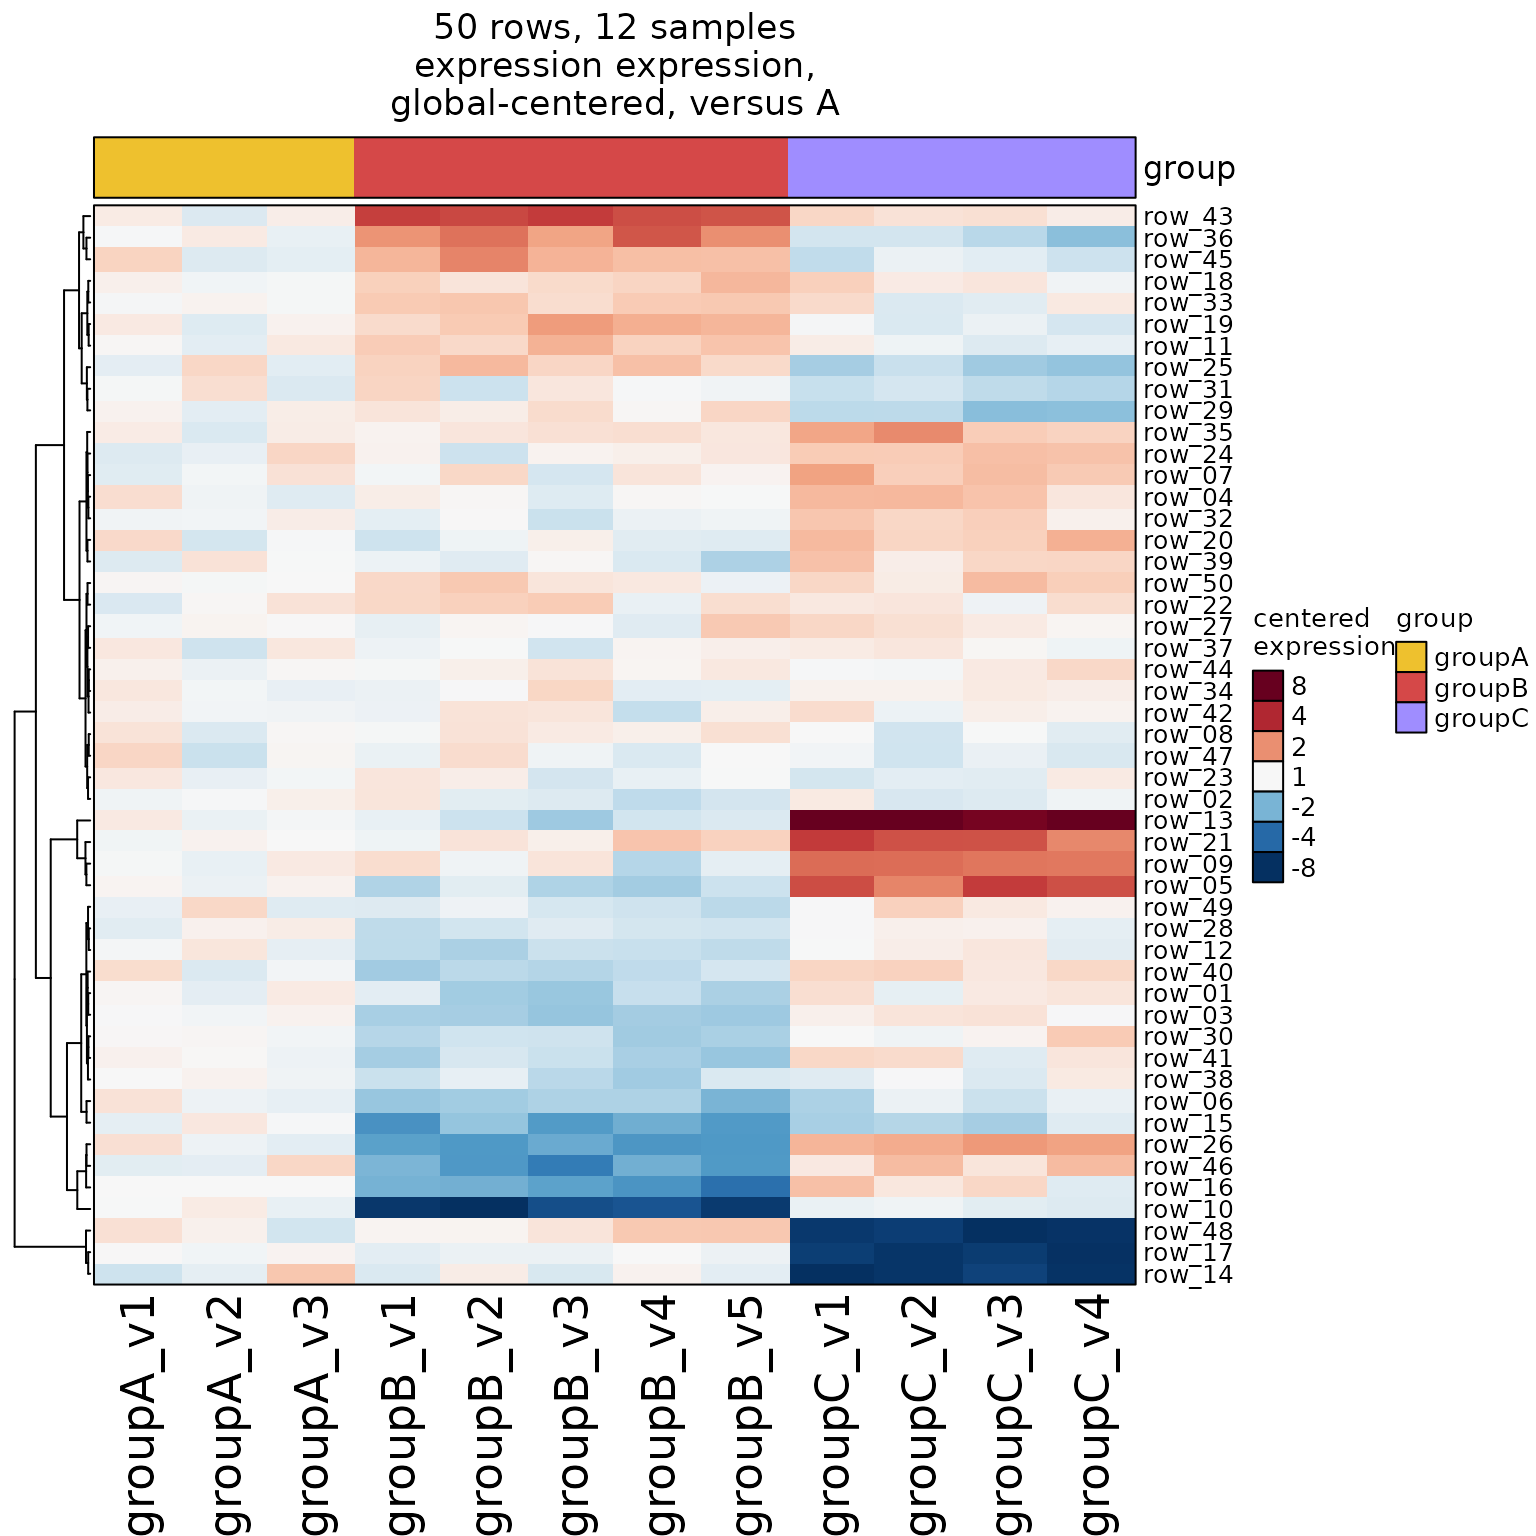
 se <- make_se_test(ngroups=3, assay_name="expression", nreps=c(3, 5, 4));
heatmap_se(se, controlSamples=1:3, control_label="versus A", apply_hm_column_title=TRUE)
se <- make_se_test(ngroups=3, assay_name="expression", nreps=c(3, 5, 4));
heatmap_se(se, controlSamples=1:3, control_label="versus A", apply_hm_column_title=TRUE)
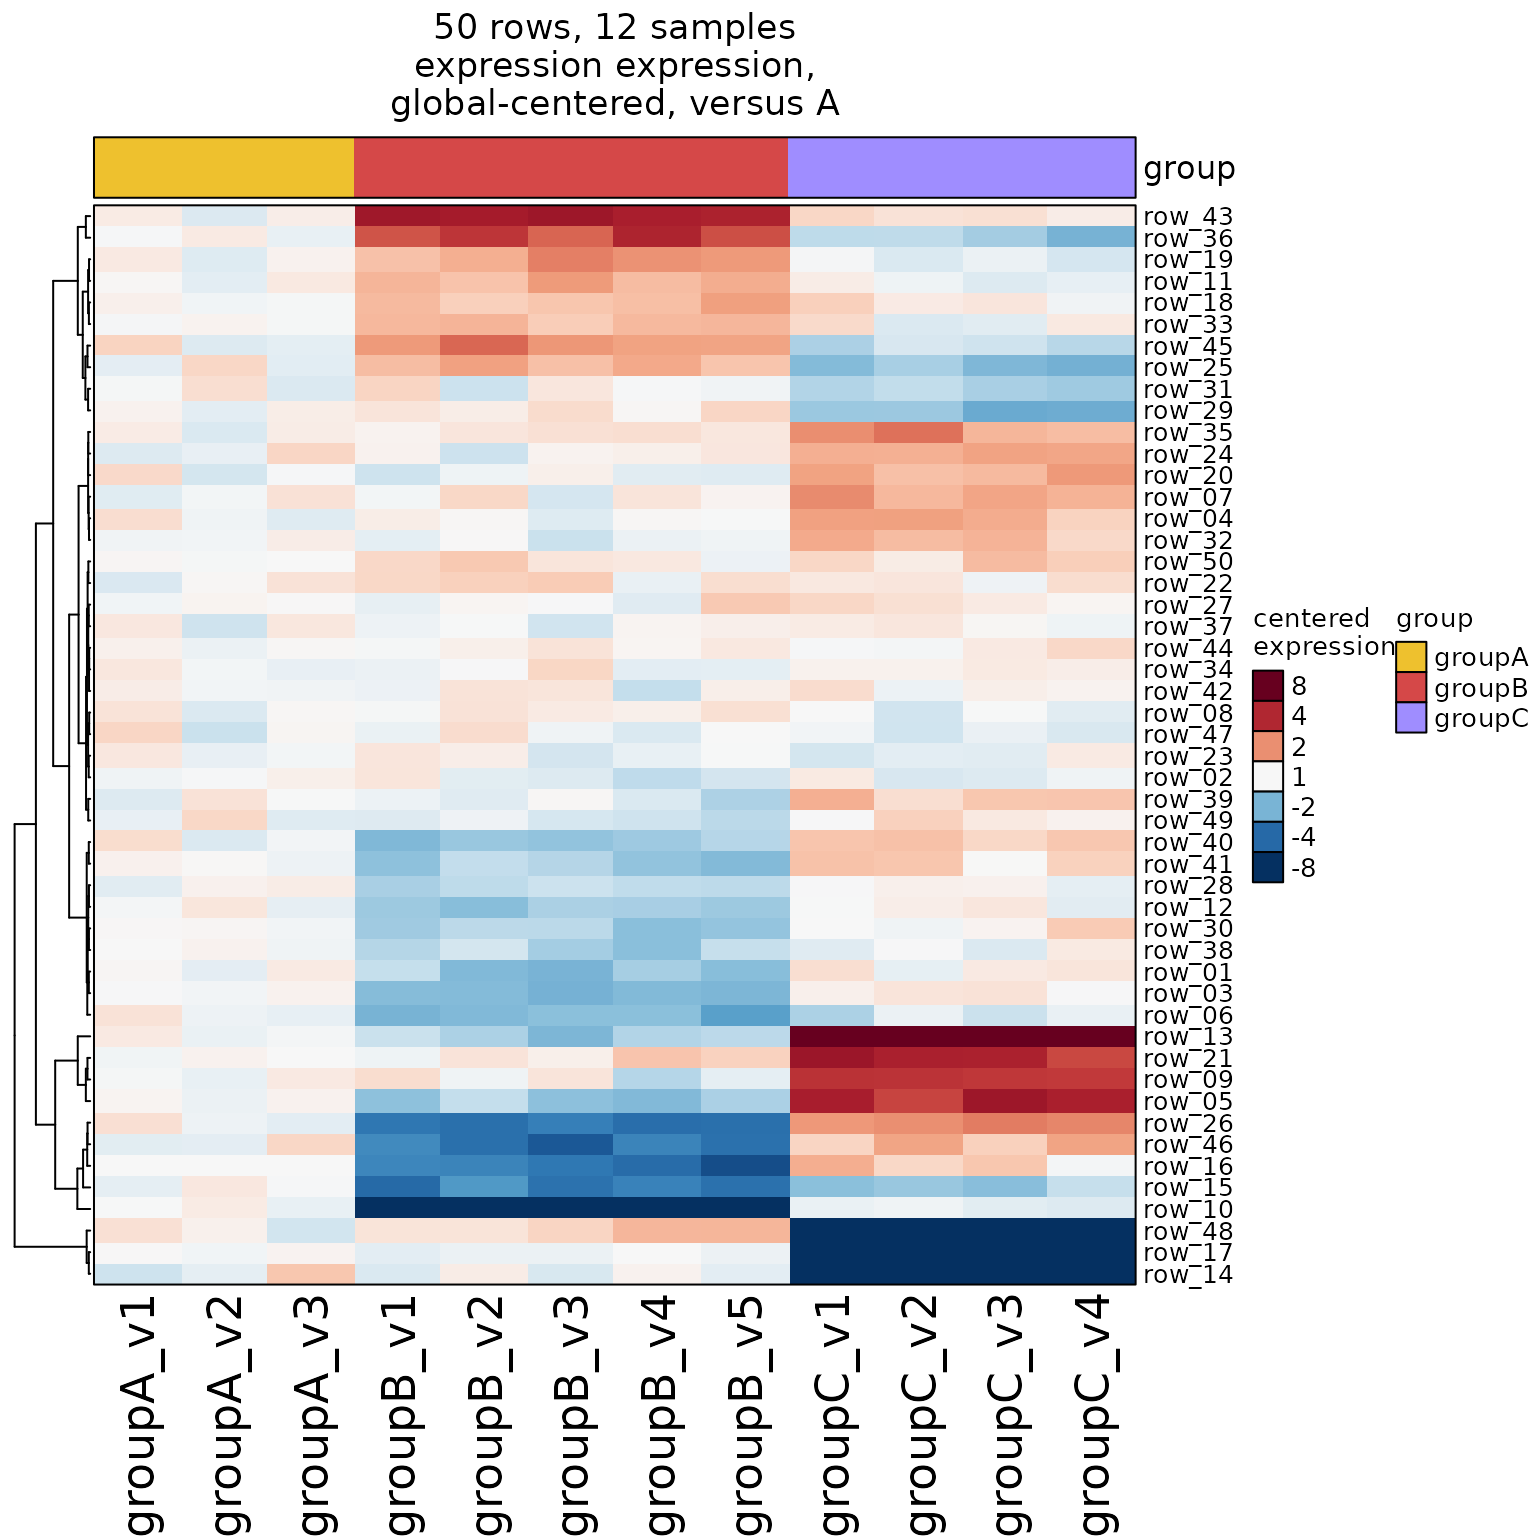
 se <- make_se_test(ngroups=3, assay_name="expression", nreps=c(3, 5, 4), hit_max=4);
heatmap_se(se, controlSamples=1:3, control_label="versus A", apply_hm_column_title=TRUE)
se <- make_se_test(ngroups=3, assay_name="expression", nreps=c(3, 5, 4), hit_max=4);
heatmap_se(se, controlSamples=1:3, control_label="versus A", apply_hm_column_title=TRUE)
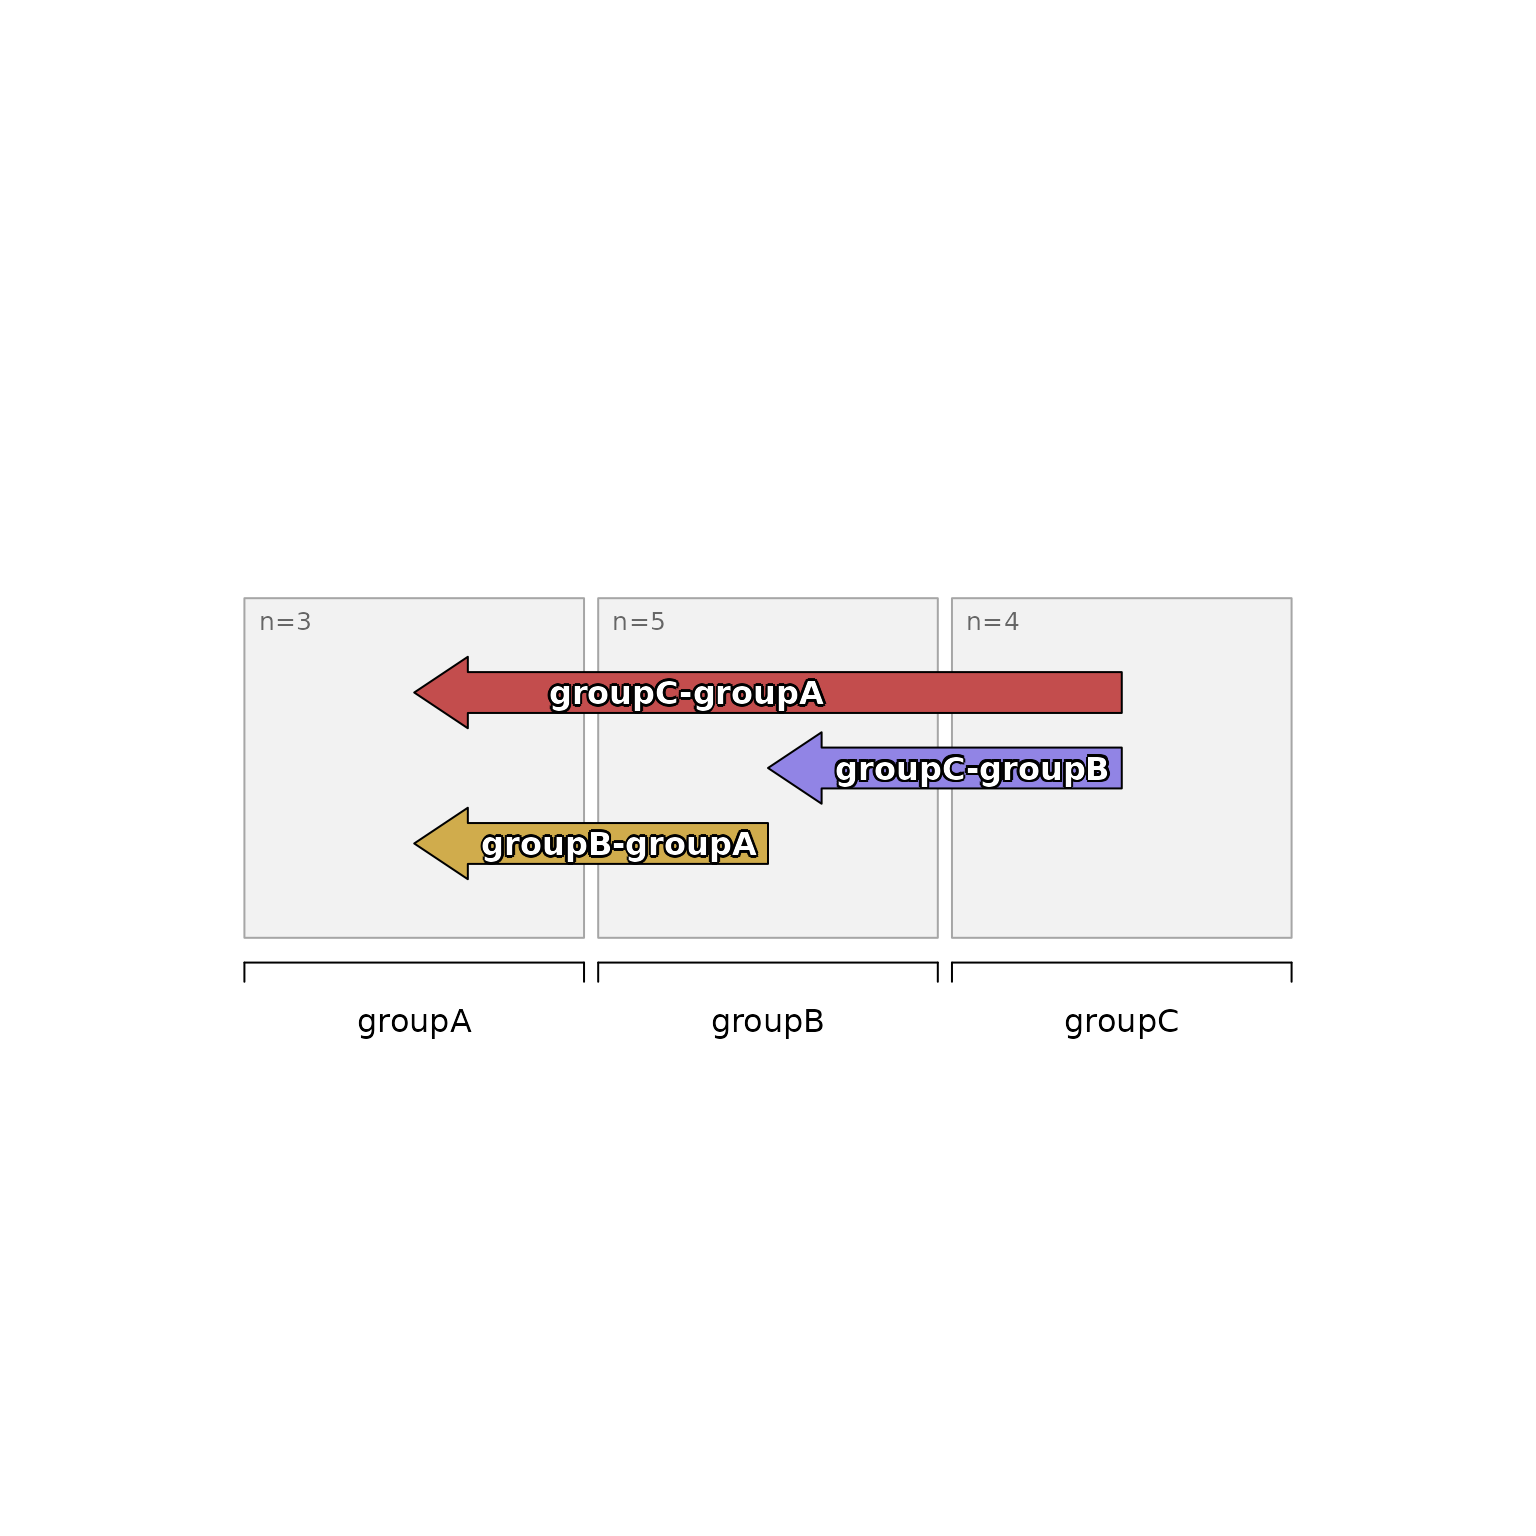
 sedesign <- groups_to_sedesign(SummarizedExperiment::colData(se)[, "group", drop=FALSE])
plot_sedesign(sedesign)
sedesign <- groups_to_sedesign(SummarizedExperiment::colData(se)[, "group", drop=FALSE])
plot_sedesign(sedesign)
 sestats <- se_contrast_stats(se=se, sedesign=sedesign, assay_names="expression")
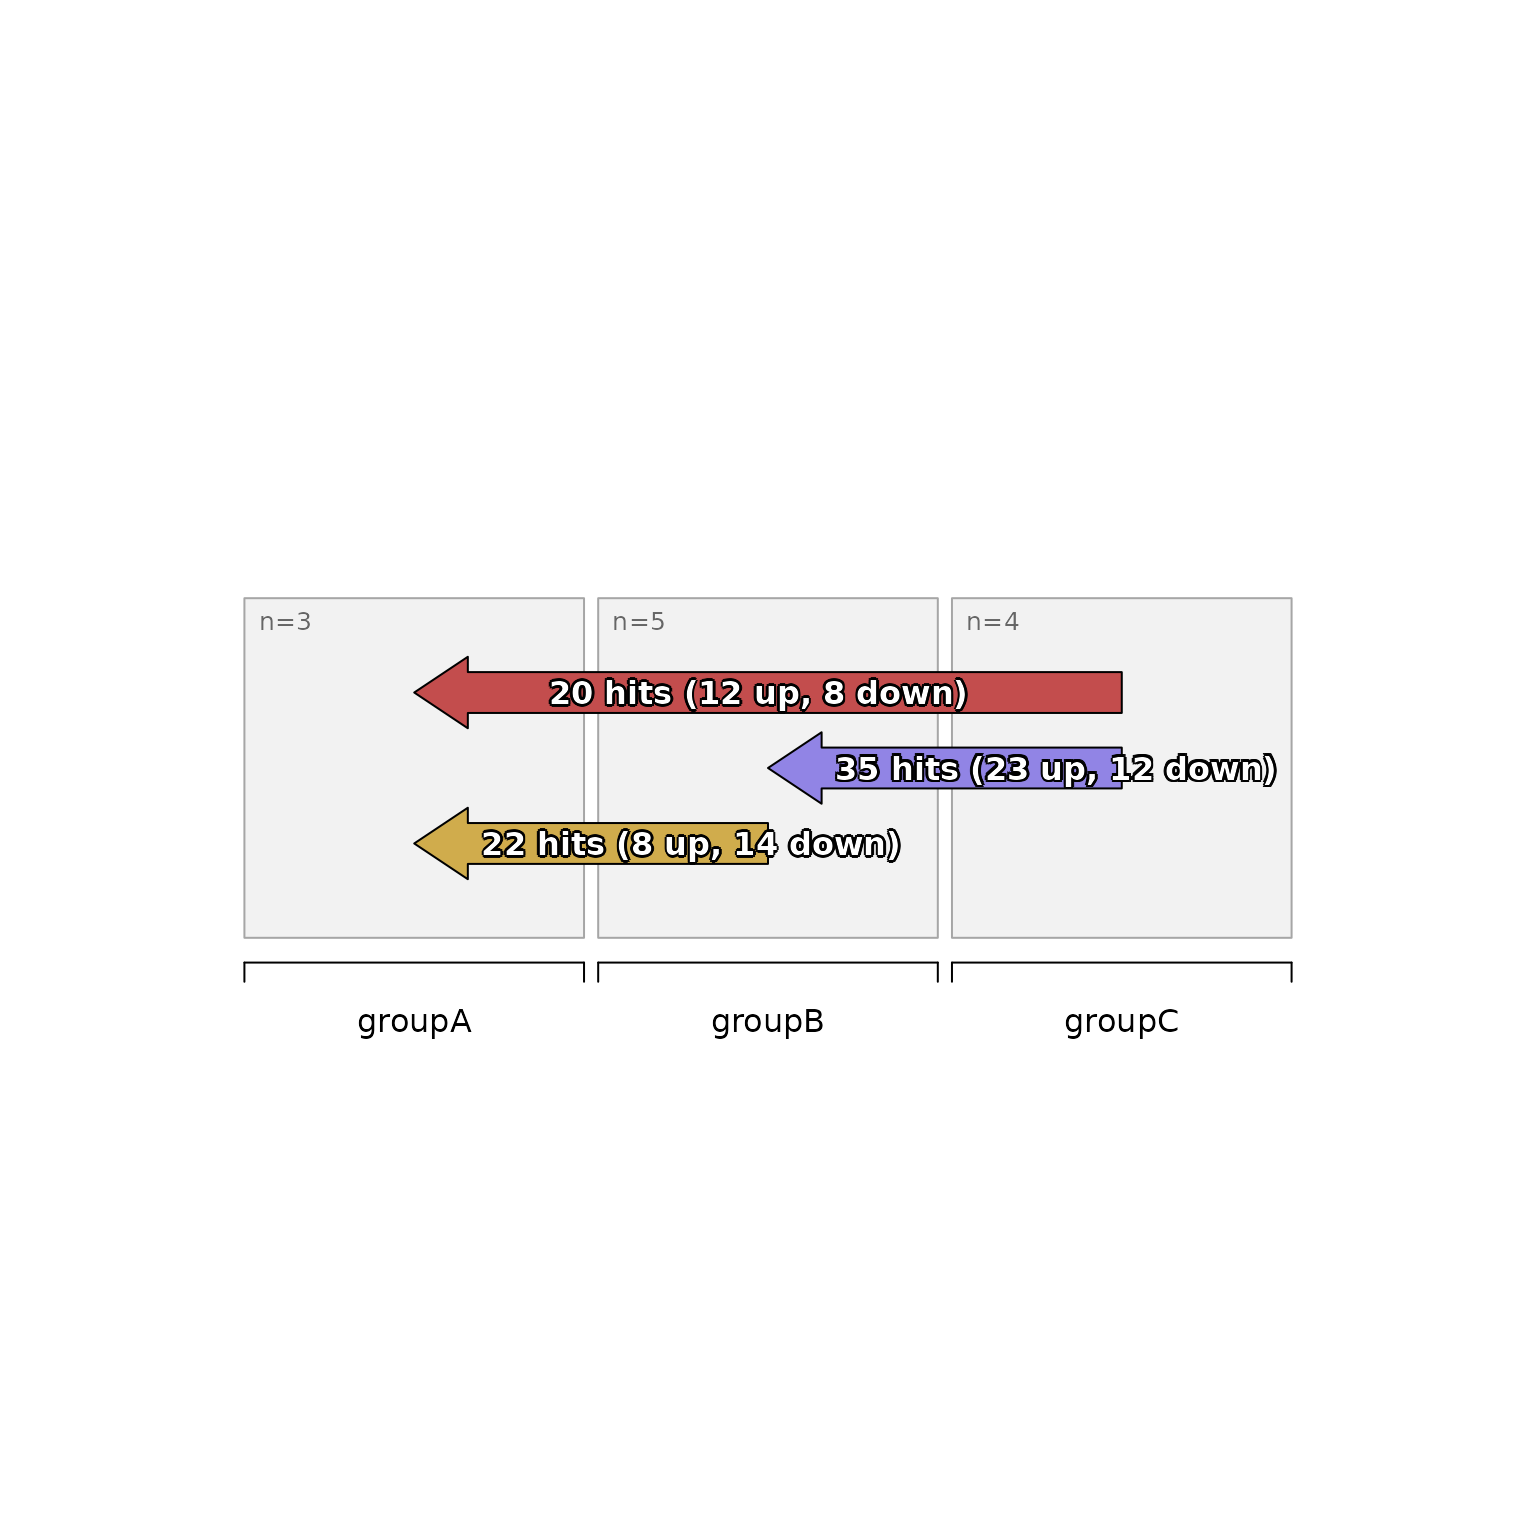
plot_sedesign(sedesign, sestats=sestats,
contrast_style="none", sestats_style="label")
sestats <- se_contrast_stats(se=se, sedesign=sedesign, assay_names="expression")
plot_sedesign(sedesign, sestats=sestats,
contrast_style="none", sestats_style="label")
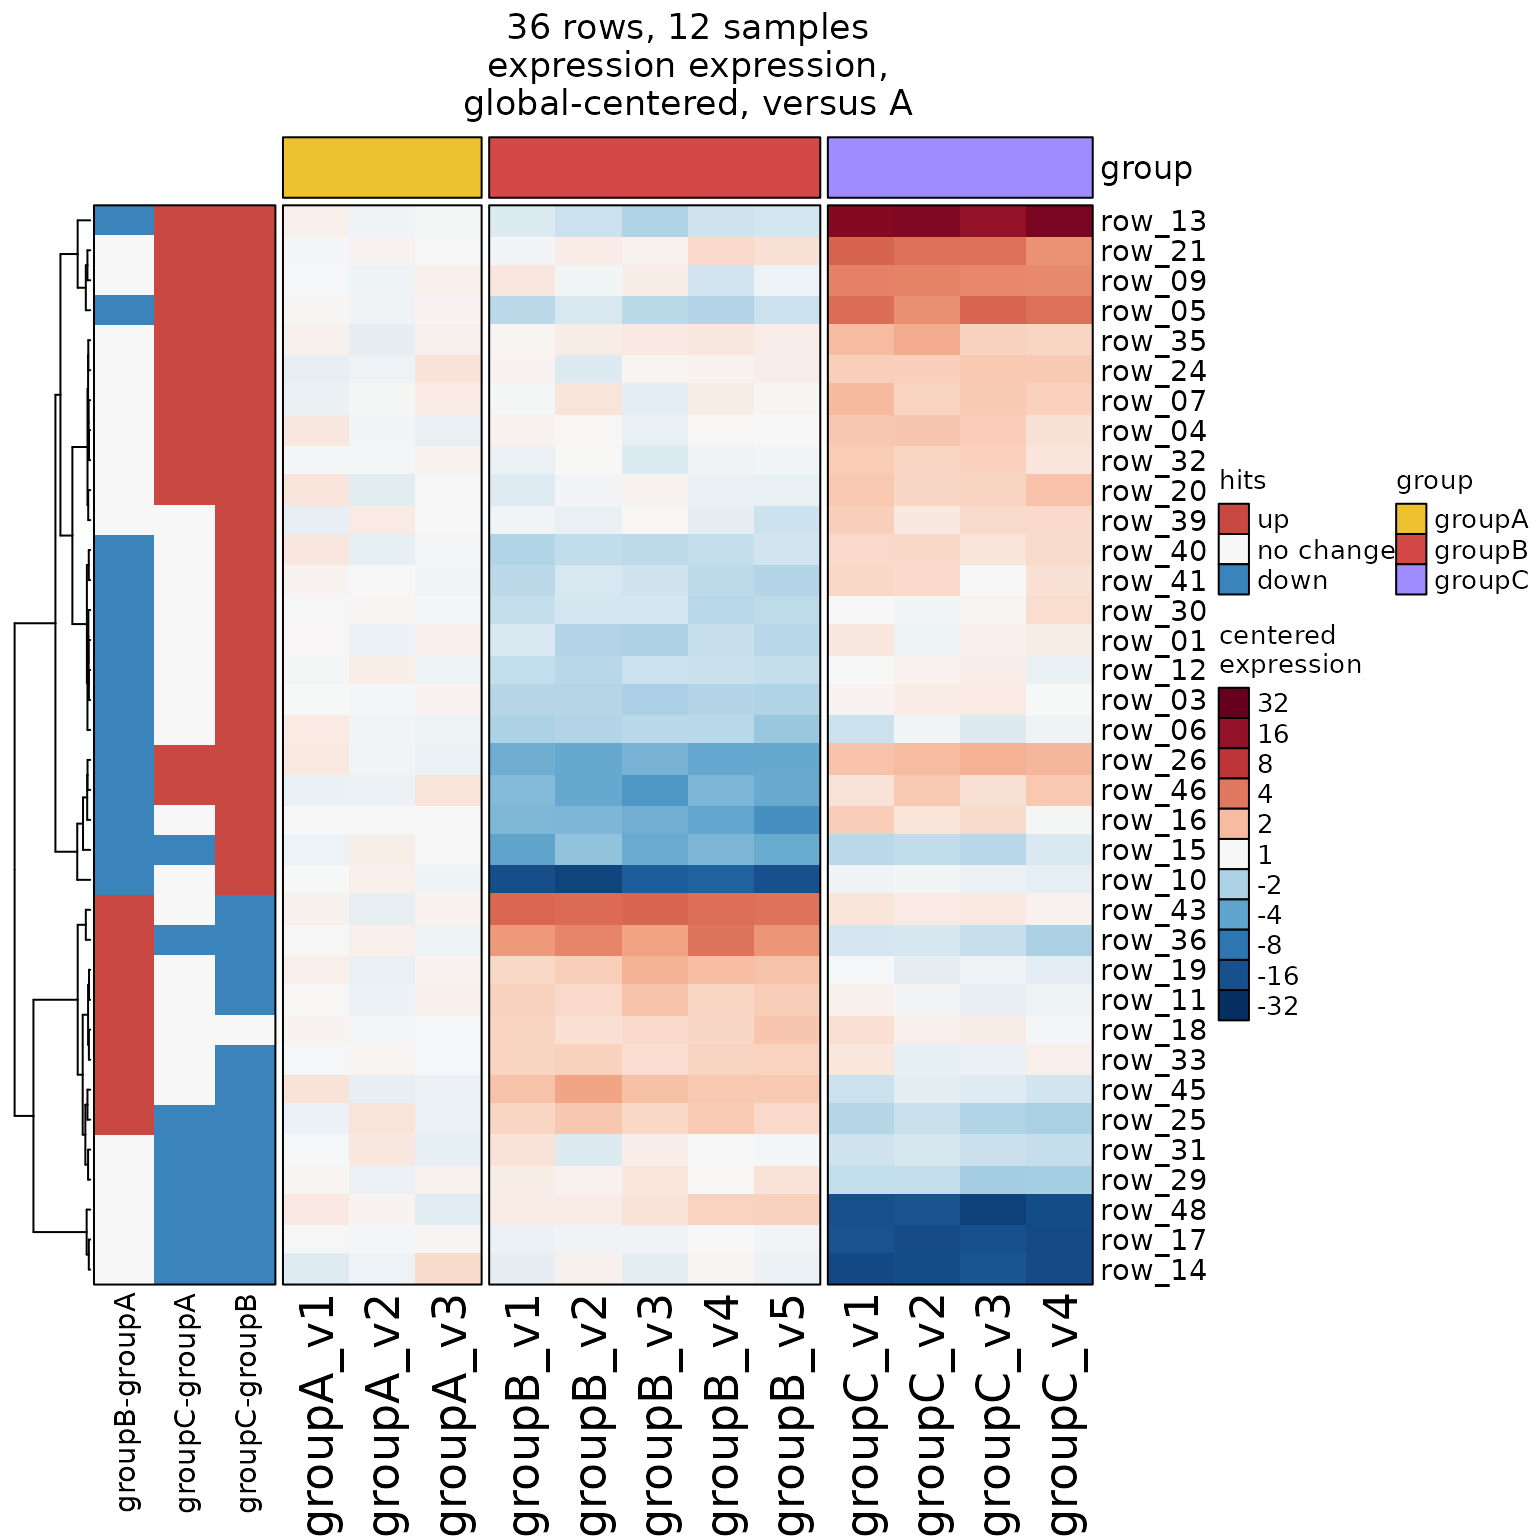
 heatmap_se(se, controlSamples=1:3, control_label="versus A",
column_split="group",
apply_hm_column_title=TRUE, sestats=sestats, color_max=5)
heatmap_se(se, controlSamples=1:3, control_label="versus A",
column_split="group",
apply_hm_column_title=TRUE, sestats=sestats, color_max=5)
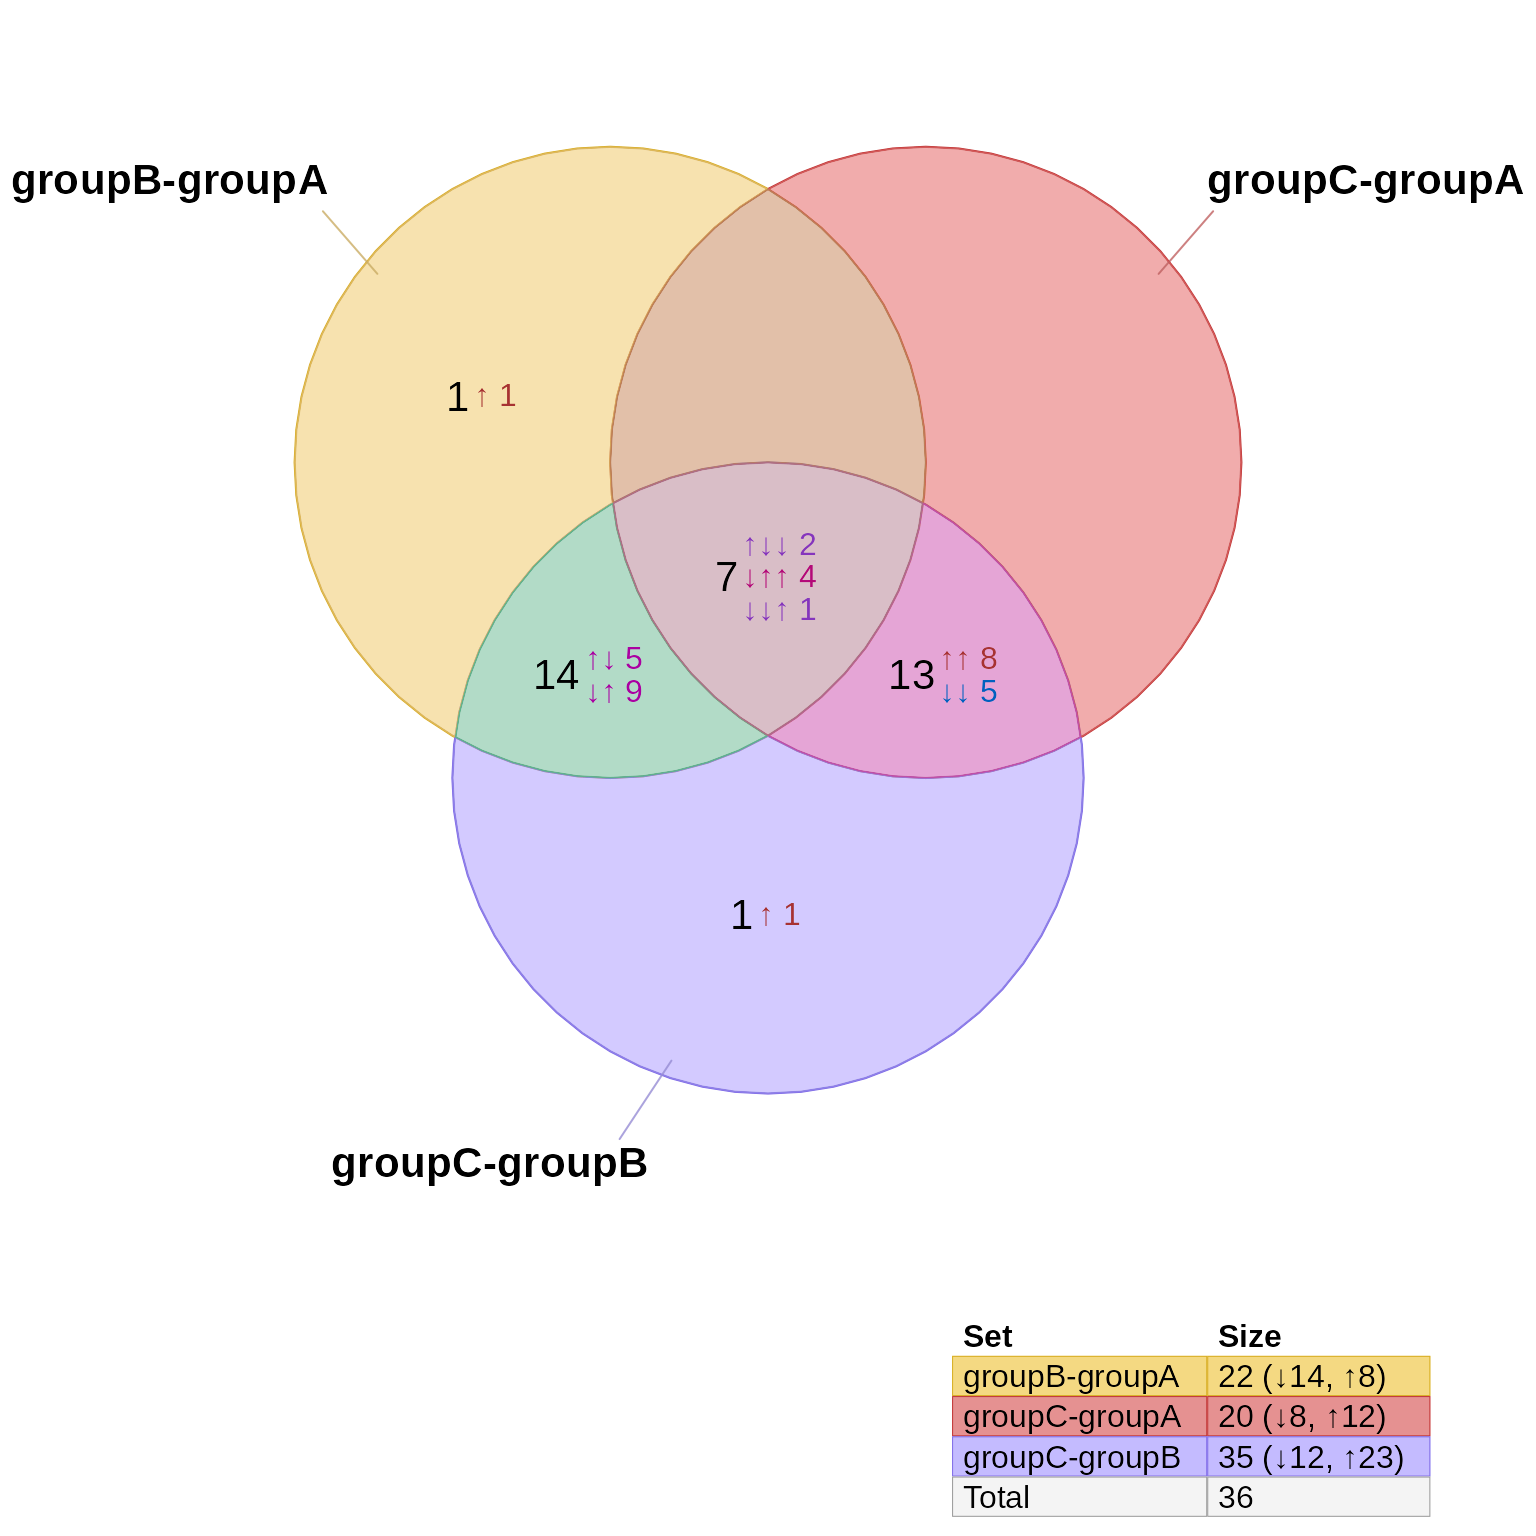
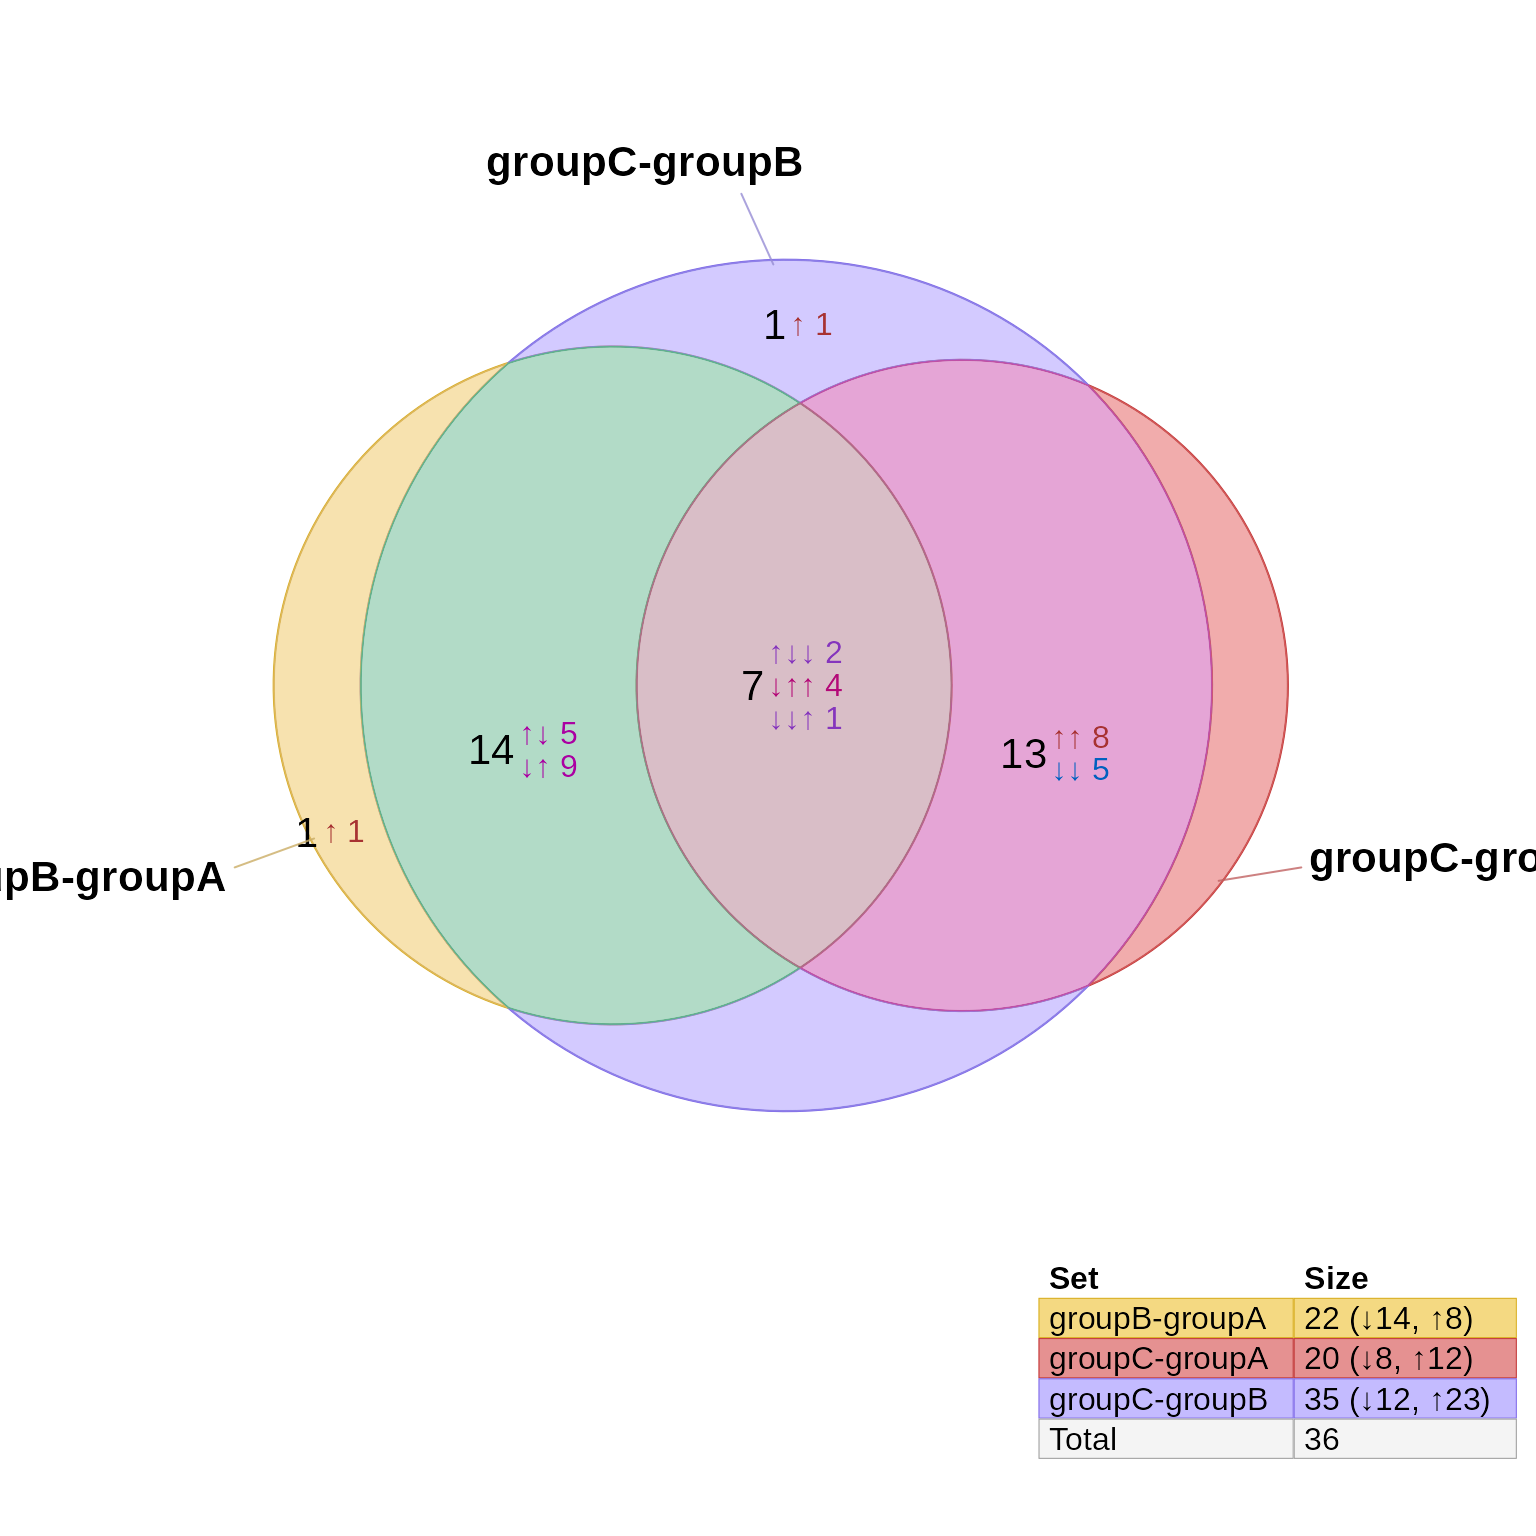
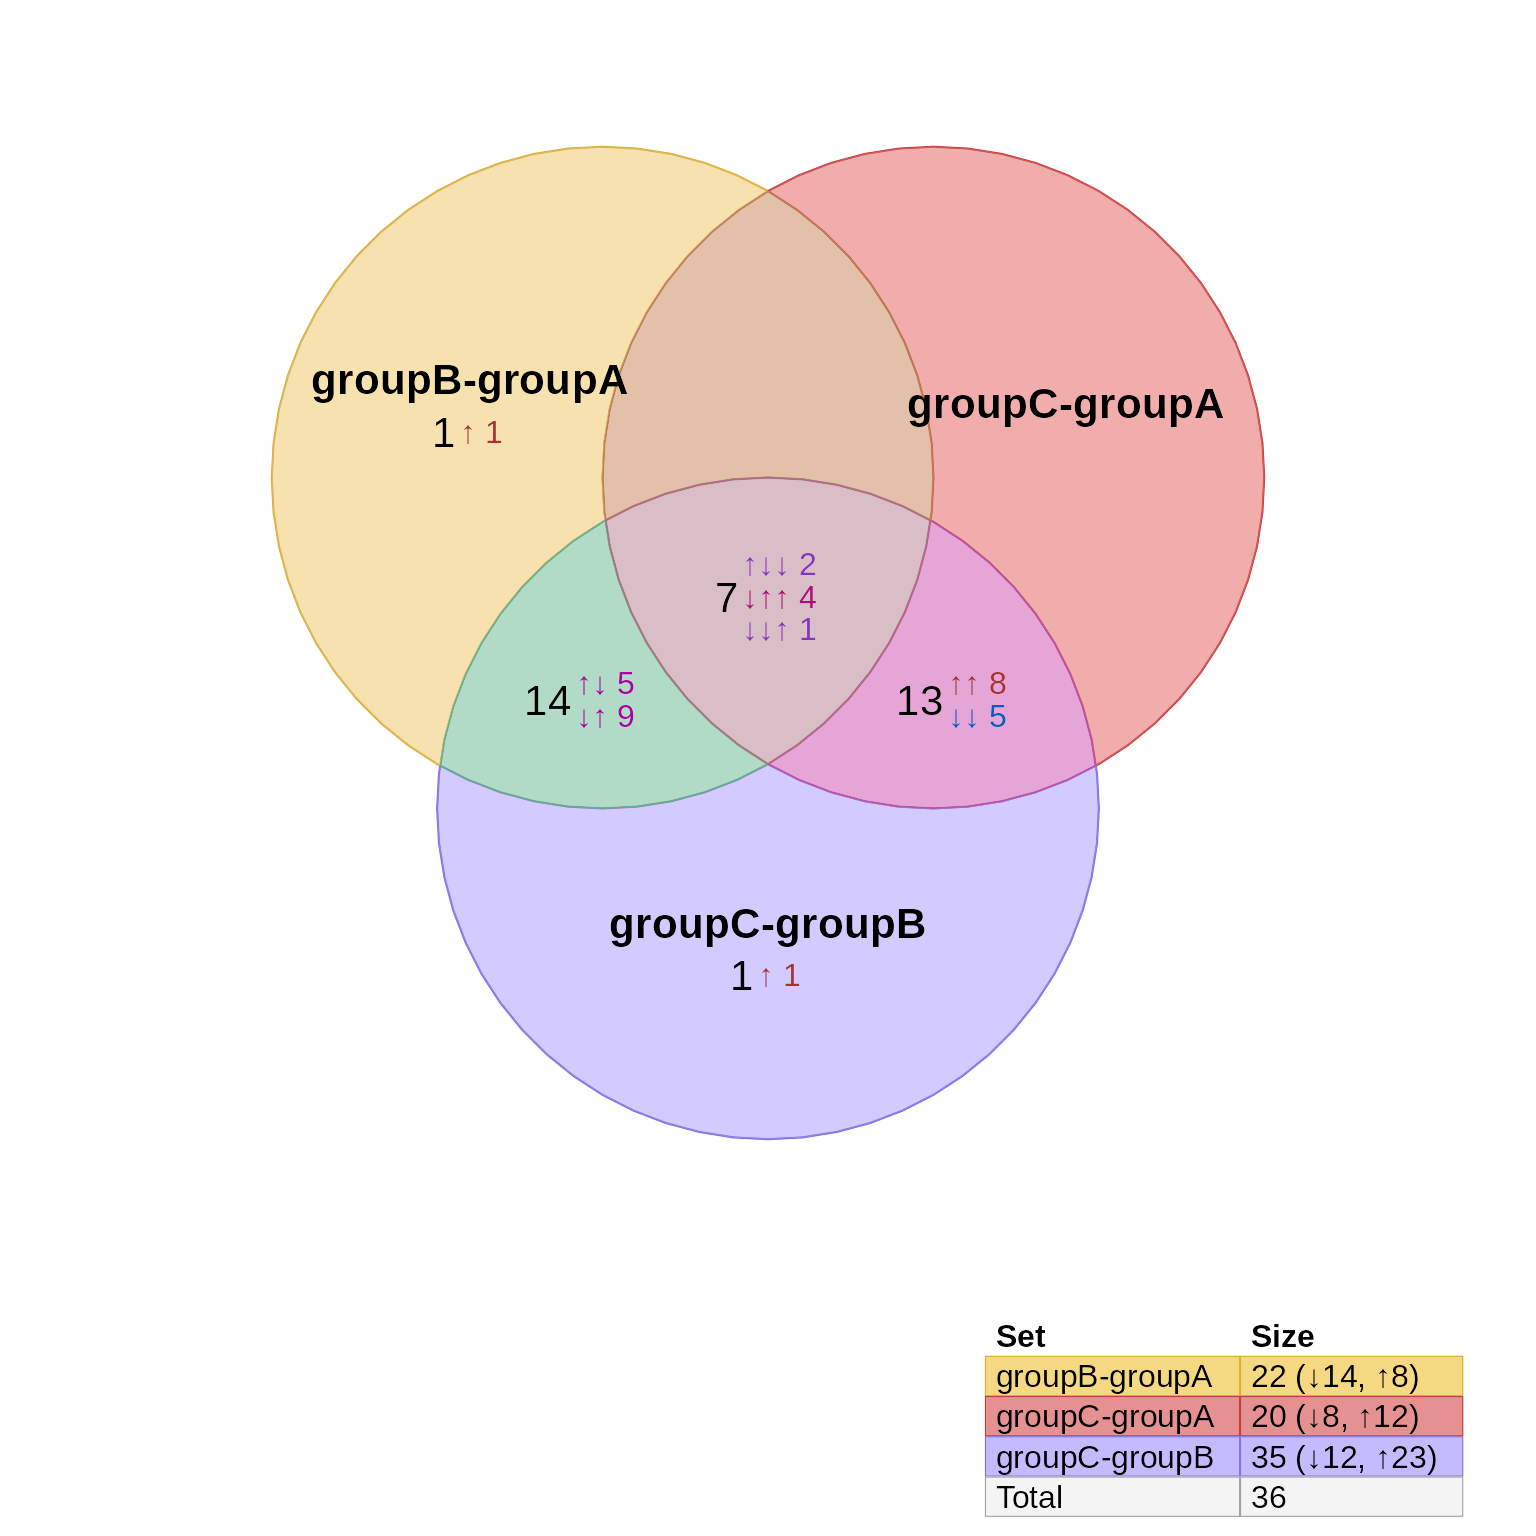
 if (jamba::check_pkg_installed("venndir")) {
venndir::venndir(hit_array_to_list(sestats), overlap_type="each")
venndir::venndir(hit_array_to_list(sestats), overlap_type="each", proportional=TRUE)
venndir::venndir(hit_array_to_list(sestats), overlap_type="each", show_labels="ncs")
}
if (jamba::check_pkg_installed("venndir")) {
venndir::venndir(hit_array_to_list(sestats), overlap_type="each")
venndir::venndir(hit_array_to_list(sestats), overlap_type="each", proportional=TRUE)
venndir::venndir(hit_array_to_list(sestats), overlap_type="each", show_labels="ncs")
}
 # data.frame summary
sestats_to_dfs(sestats)
#> Error in sestats_to_dfs(sestats): could not find function "sestats_to_dfs"
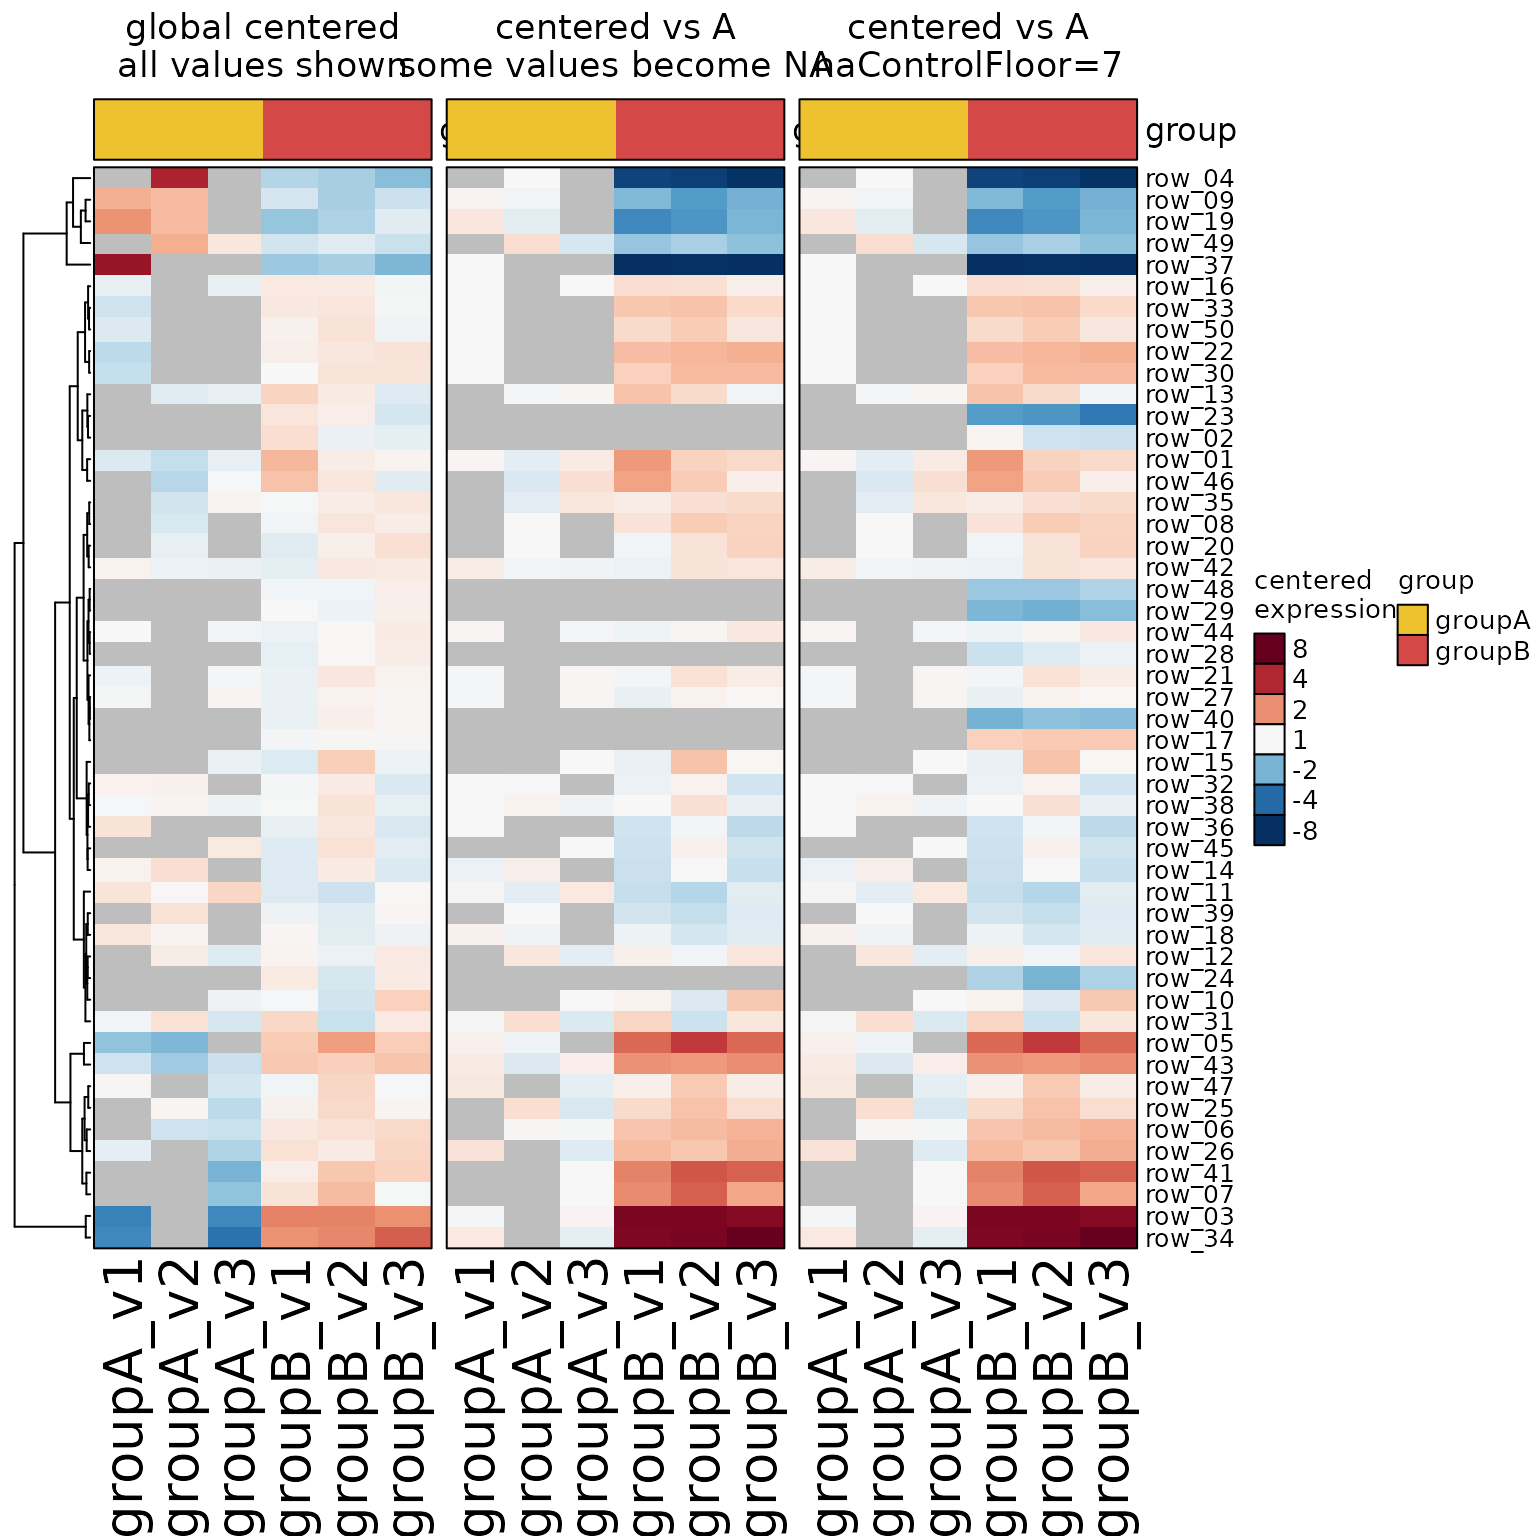
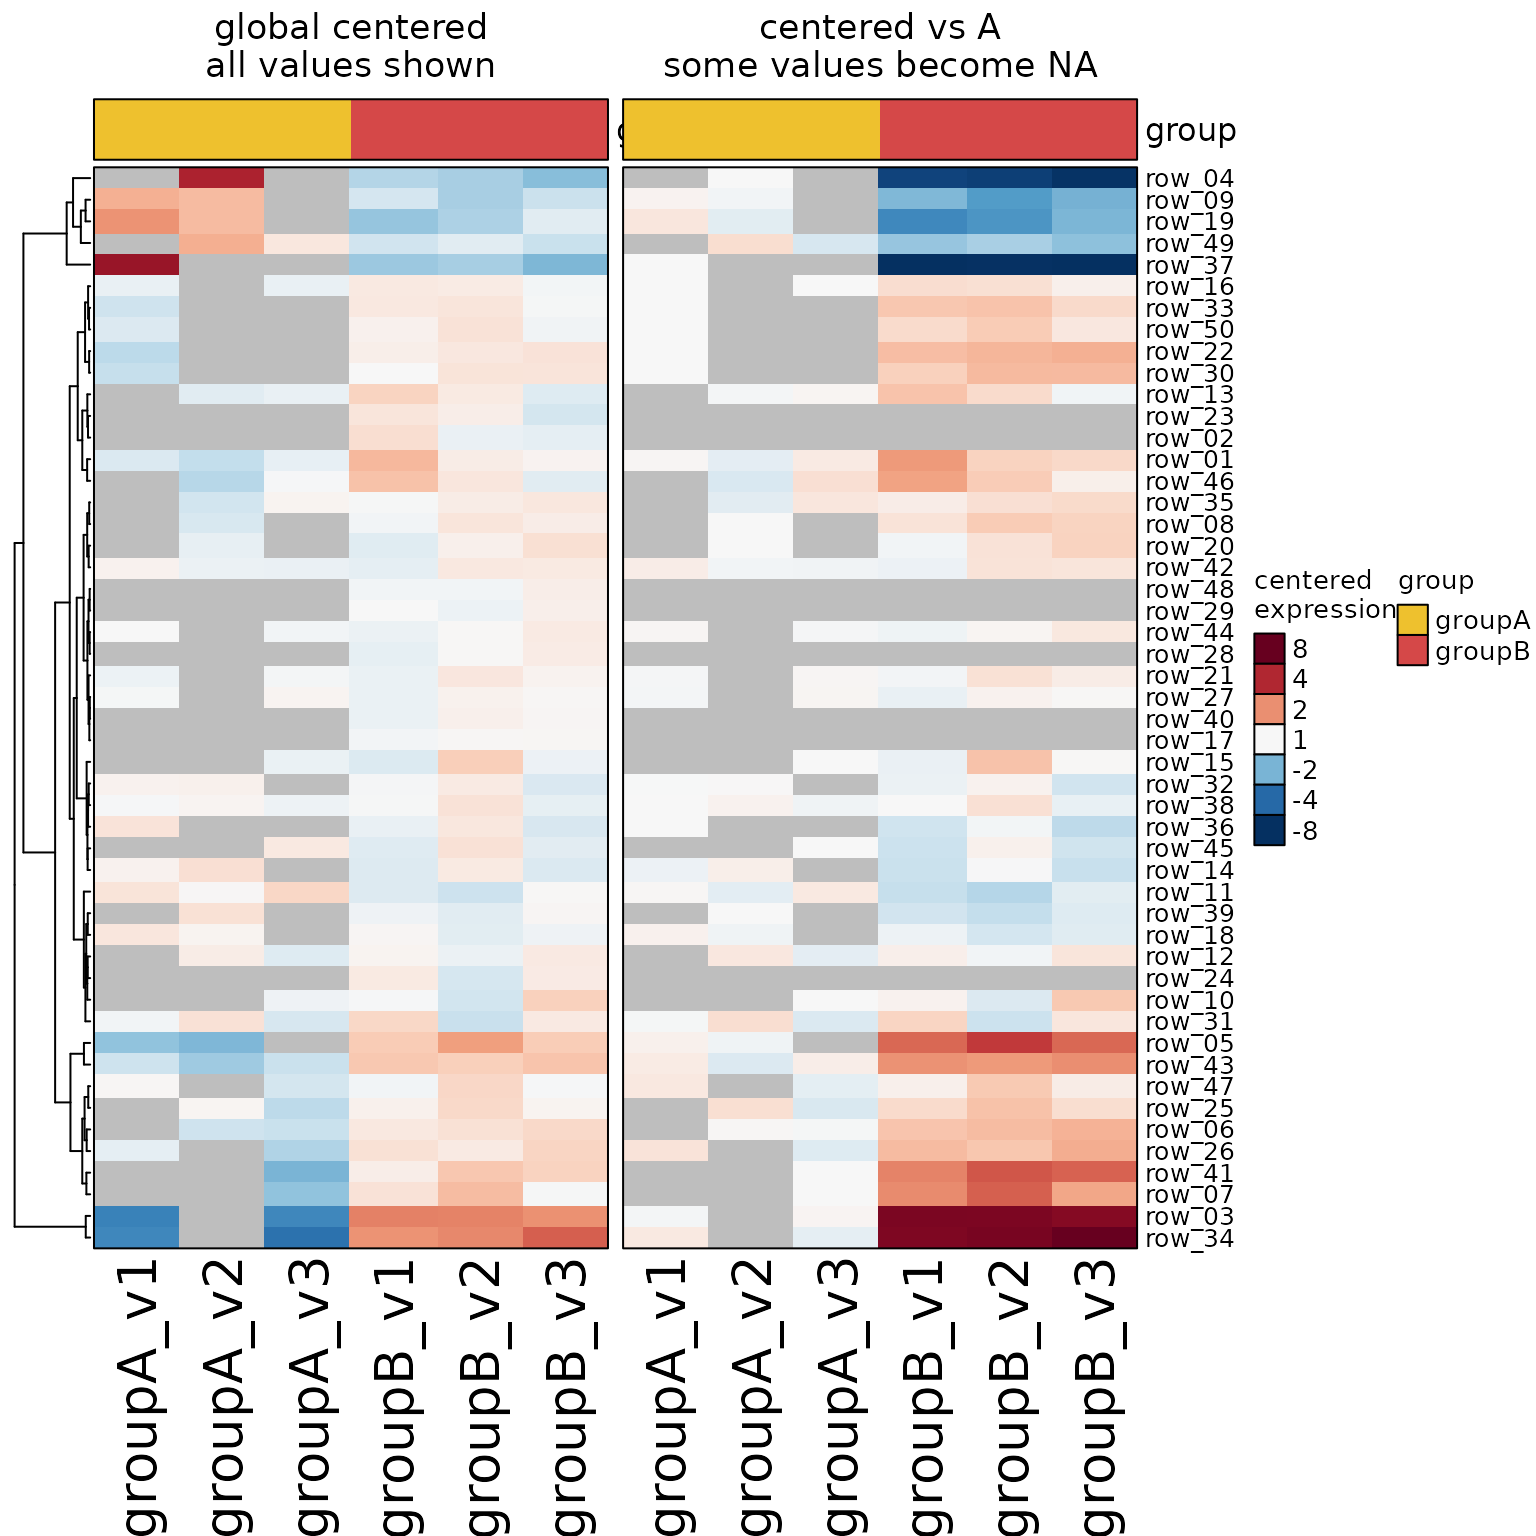
# demonstrate sparsity
se2 <- make_se_test(sparsity=c(0.5, 0));
hm2a <- heatmap_se(se2,
column_title="global centered\nall values shown")
# when centering versus a sparse control group, some values can be lost:
hm2b <- heatmap_se(se2, controlSamples=1:3,
column_title="centered vs A\nsome values become NA")
hm2a + hm2b
#> Warning: Heatmap/annotation names are duplicated: centered expression
# data.frame summary
sestats_to_dfs(sestats)
#> Error in sestats_to_dfs(sestats): could not find function "sestats_to_dfs"
# demonstrate sparsity
se2 <- make_se_test(sparsity=c(0.5, 0));
hm2a <- heatmap_se(se2,
column_title="global centered\nall values shown")
# when centering versus a sparse control group, some values can be lost:
hm2b <- heatmap_se(se2, controlSamples=1:3,
column_title="centered vs A\nsome values become NA")
hm2a + hm2b
#> Warning: Heatmap/annotation names are duplicated: centered expression
 # use naControlFloor
hm2c <- heatmap_se(se2,
column_title="centered vs A\nnaControlFloor=7",
naControlFloor=7, naControlAction="floor", controlSamples=1:3)
hm2a + hm2b + hm2c
#> Warning: Heatmap/annotation names are duplicated: centered expression
#> Warning: Heatmap/annotation names are duplicated: centered expression, centered
#> expression
# use naControlFloor
hm2c <- heatmap_se(se2,
column_title="centered vs A\nnaControlFloor=7",
naControlFloor=7, naControlAction="floor", controlSamples=1:3)
hm2a + hm2b + hm2c
#> Warning: Heatmap/annotation names are duplicated: centered expression
#> Warning: Heatmap/annotation names are duplicated: centered expression, centered
#> expression