Calculate major and minor tick marks for log-scale axis
Arguments
- side
integervalue indicating which axis to produce tick marks, 1=bottom, 2=left, 3=top, 4=right.- lims
numericvector length=2, indicating specific numeric range to use for tick marks.- logBase
numericvalue indicating the logarithmic base, assumed to be applied to the numericlimslimits, or the axis range, previously.- displayBase
numericvalue indicating the base used to position axis labels, typicallydisplayBase=10is used to draw labels at typical positions.- logStep
integervalue indicating the number of log steps between major axis label positions. TypicallylogStep=1will draw a label every log position based upondisplayBase, for exampledisplayBase=10andlogStep=1will usec(1,10,100,1000); anddisplayBase=10andlogStep=2would usec(1,100,10000).- minorWhich
integervector of values to label, where those integer values are between 1 anddisplayBase, for exampledisplayBase=10may label onlyc(2,5), which implies minor tick labels atc(2, 5, 20, 50, 200, 500). Any minor labels which would otherwise equal a major tick position are removed. By default, whendisplayBase=2,minorWhich=c(1.5)which has the effect of drawing one minor label between each two-fold major tick label.- asValues
logicalindicating whether to create exponentiated numeric labels. WhenasValues=FALSE, it createsexpressionobjects which include the exponential value. UseasValues=FALSEandlogAxisType="pvalue"to draw P-value labels.- offset
numericvalue added during log transformation, typically of the formlog(1 + x)whereoffset=1. The offset is used to determine the accurate numeric label such that values of0are properly labeled by the original numeric value.- symmetricZero
logicalindicating whether numeric values are symmetric around zero. For example, log fold changes should usesymmetricZero=TRUEwhich ensures a log2 value of-2is labeled-4to indicate a negative four fold change. IfsymmetricZero=FALSEa log2 value of-2would be labeled0.0625.- col, col.ticks
charactercolor used for the axis label, and axis tick marks, respectively, default "black".- combine
logical, default FALSE, whether to combine major and minor ticks into one continuous set of major tick marks.- logAxisType
characterstring indicating the type of log axis:normal: typical axis style and orientation
flipped: used for reverse orientation
pvalue: used for
-log10(pvalue)orientation.
- verbose
logical indicating whether to print verbose output.
- ...
additional parameters are ignored.
Value
list of axis tick positions, and corresponding labels,
for major and minor ticks. Note that labels may be numeric,
character, or expression. Specifically when expression
the graphics::axis() must be called once per label.
majorTicks:
numericposition of each major tick markminorTicks:
numericposition of each minor tick markallTicks:
numericposition of each major tick markmajorLabels: label to show for each tick mark
minorLabels: label to show for each tick mark
minorSet: the
numericsteps requested for minor ticksminorWhich: the
numericsteps requested for minor labelsallLabelsDF:
data.framewith all tick marks and labels, with colname"use"indicating whether the label is displayed beside each tick mark.
Details
This function is called by minorLogTicksAxis(), and
it may be better to use that function, or logFoldAxis()
or pvalueAxis() which has better preset options.
This function calculates log units for the axis of an existing base R plot. It calculates appropriate tick and label positions for:
major steps, which are typically in log steps; and
minor steps, which are typically a subset of steps at one lower log order.
For example, log 10 steps would be: c(1, 10, 100, 1000),
and minor steps would be c(2, 5, 20, 50, 200, 500, 2000, 5000).
Motivation
This function is motivated to fill a few difficult cases:
Label axis ticks properly when used together with
offset. For examplelog2(1 + x)usesoffset=1. Other offsets can be used as relevant.Create axis labels which indicate negative fold change values, for example
-2in log2 fold change units would be labeled with fold change-4, and not0.0625.Use symmetric tick marks around x=0 when applied to log fold changes.
Display actual P-values when plotting
log10(Pvalue), which is common for volcano plots.
See also
Other jam practical functions:
breakDensity(),
call_fn_ellipsis(),
checkLightMode(),
check_pkg_installed(),
colNum2excelName(),
color_dither(),
exp2signed(),
getAxisLabel(),
isFALSEV(),
isTRUEV(),
jargs(),
kable_coloring(),
lldf(),
log2signed(),
middle(),
newestFile(),
printDebug(),
reload_rmarkdown_cache(),
renameColumn(),
rmInfinite(),
rmNA(),
rmNAs(),
rmNULL(),
setPrompt()
Examples
## This example shows how to draw axis labels manually,
## but the function minorLogTicksAxis() is easier to use.
xlim <- c(0,4);
nullPlot(xlim=xlim, doMargins=FALSE);
mlt <- minorLogTicks(1,
logBase=10,
offset=1,
minTick=0);
maj <- subset(mlt$allLabelsDF, type %in% "major");
graphics::axis(1, las=2,
at=maj$tick, label=maj$text);
min <- subset(mlt$allLabelsDF, type %in% "minor");
graphics::axis(1, las=2, cex.axis=0.7,
at=min$tick, label=min$text,
col="blue");
graphics::text(x=log10(1+c(0,5,50,1000)), y=rep(1.7, 4),
label=c(0,5,50,1000), srt=90);
 nullPlot(xlim=c(-4,10), doMargins=FALSE);
abline(v=0, lty=2)
graphics::axis(3, las=2);
minorLogTicksAxis(1, logBase=2, displayBase=10, symmetricZero=TRUE);
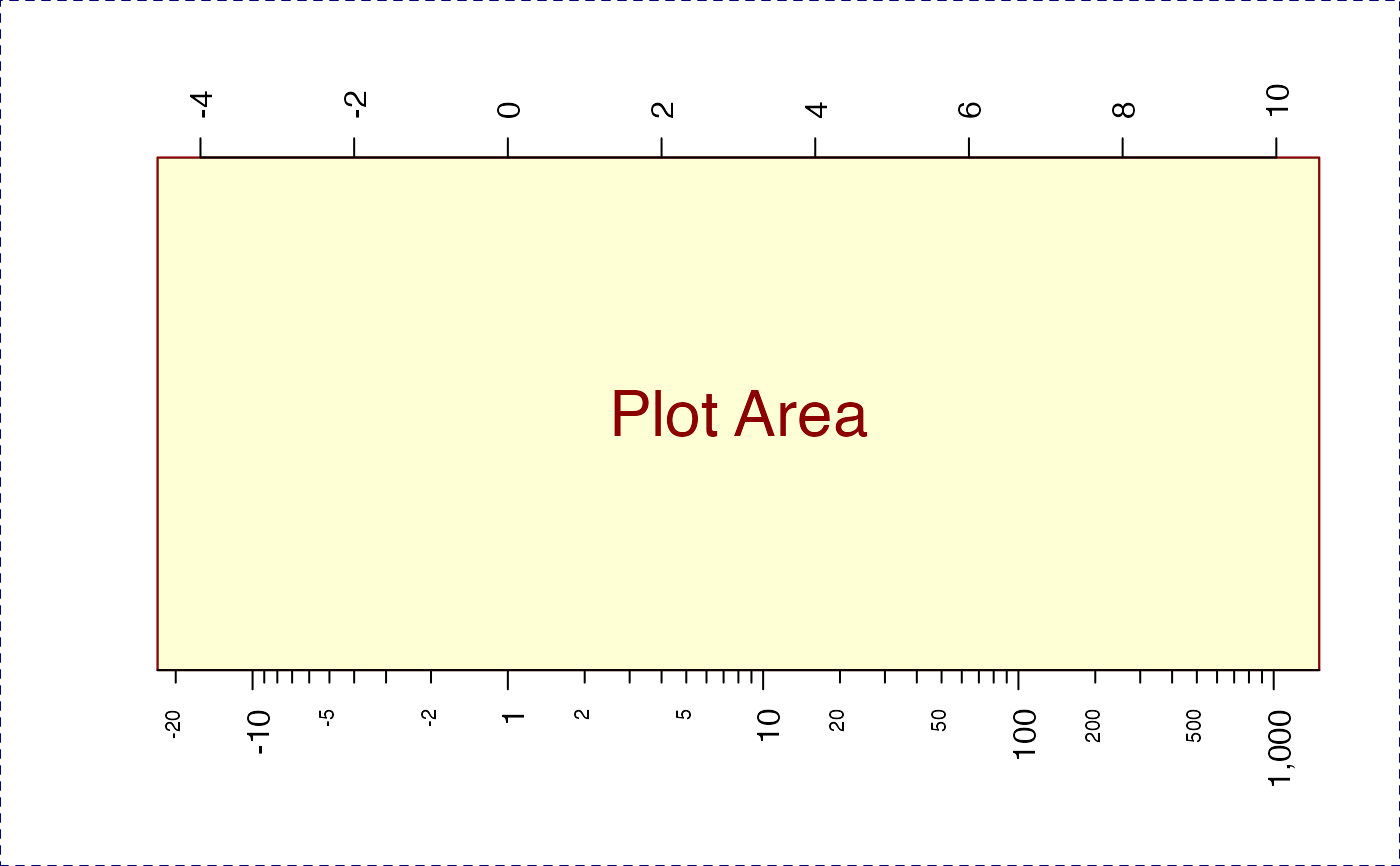
nullPlot(xlim=c(-4,10), doMargins=FALSE);
abline(v=0, lty=2)
graphics::axis(3, las=2);
minorLogTicksAxis(1, logBase=2, displayBase=10, symmetricZero=TRUE);
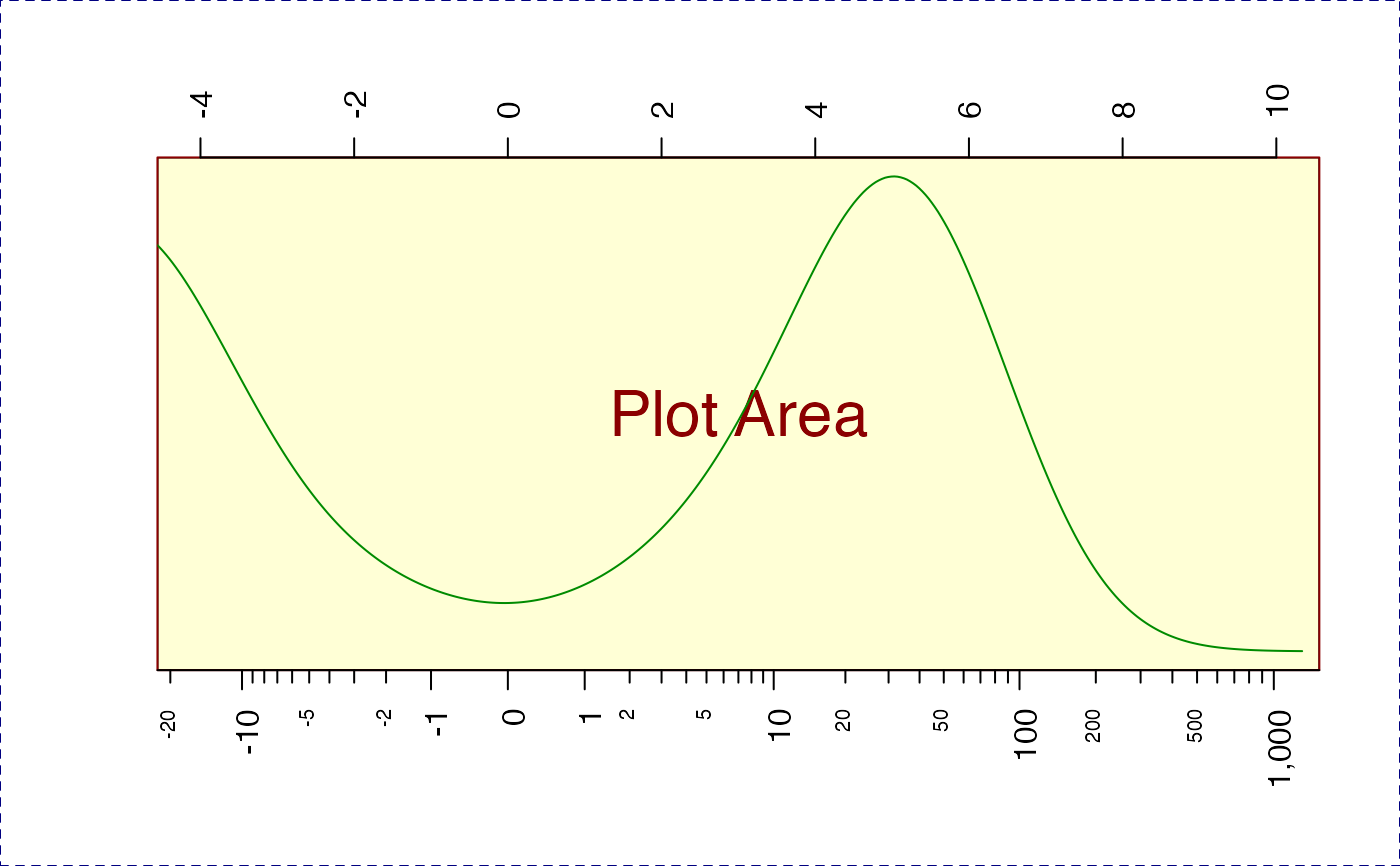
 nullPlot(xlim=c(-4,10), doMargins=FALSE);
graphics::axis(3, las=2);
minorLogTicksAxis(1, logBase=2, displayBase=10, offset=1);
x2 <- stats::rnorm(1000) * 40;
d2 <- stats::density(log2(1+abs(x2)) * ifelse(x2<0, -1, 1));
lines(x=d2$x, y=normScale(d2$y)+1, col="green4");
nullPlot(xlim=c(-4,10), doMargins=FALSE);
graphics::axis(3, las=2);
minorLogTicksAxis(1, logBase=2, displayBase=10, offset=1);
x2 <- stats::rnorm(1000) * 40;
d2 <- stats::density(log2(1+abs(x2)) * ifelse(x2<0, -1, 1));
lines(x=d2$x, y=normScale(d2$y)+1, col="green4");
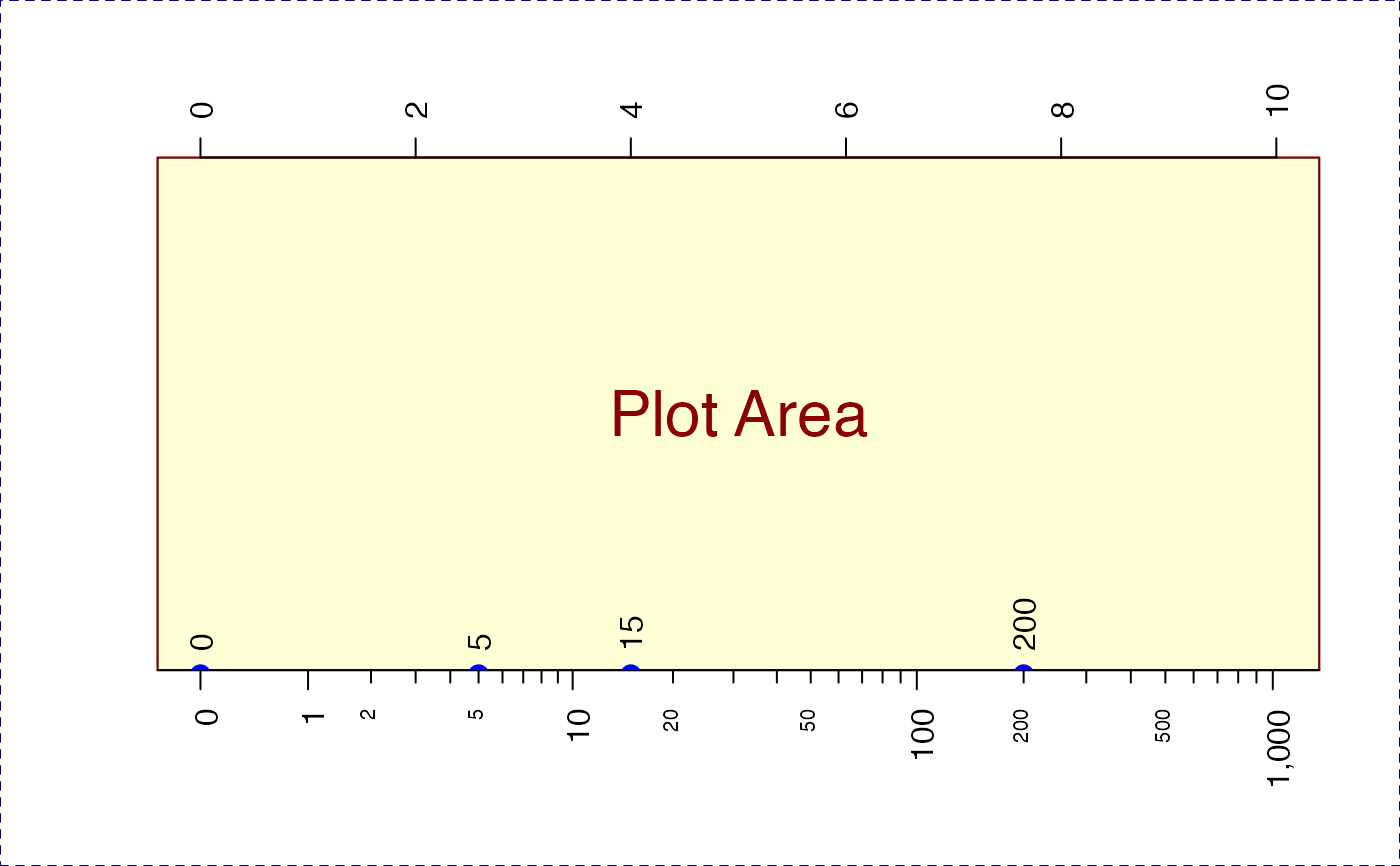
 nullPlot(xlim=c(0,10), doMargins=FALSE);
graphics::axis(3, las=2);
minorLogTicksAxis(1, logBase=2, displayBase=10, offset=1);
x1 <- c(0, 5, 15, 200);
graphics::text(y=rep(1.0, 4), x=log2(1+x1), label=x1, srt=90, adj=c(0,0.5));
graphics::points(y=rep(0.95, 4), x=log2(1+x1), pch=20, cex=2, col="blue");
nullPlot(xlim=c(0,10), doMargins=FALSE);
graphics::axis(3, las=2);
minorLogTicksAxis(1, logBase=2, displayBase=10, offset=1);
x1 <- c(0, 5, 15, 200);
graphics::text(y=rep(1.0, 4), x=log2(1+x1), label=x1, srt=90, adj=c(0,0.5));
graphics::points(y=rep(0.95, 4), x=log2(1+x1), pch=20, cex=2, col="blue");