Create a blank plot with optional labels for margins
Usage
nullPlot(
xaxt = "n",
yaxt = "n",
xlab = "",
ylab = "",
col = "transparent",
xlim = c(1, 2),
ylim = c(1, 2),
las = graphics::par("las"),
doBoxes = TRUE,
doUsrBox = doBoxes,
fill = "#FFFF9966",
doAxes = FALSE,
doMargins = TRUE,
marginUnit = c("lines", "inches"),
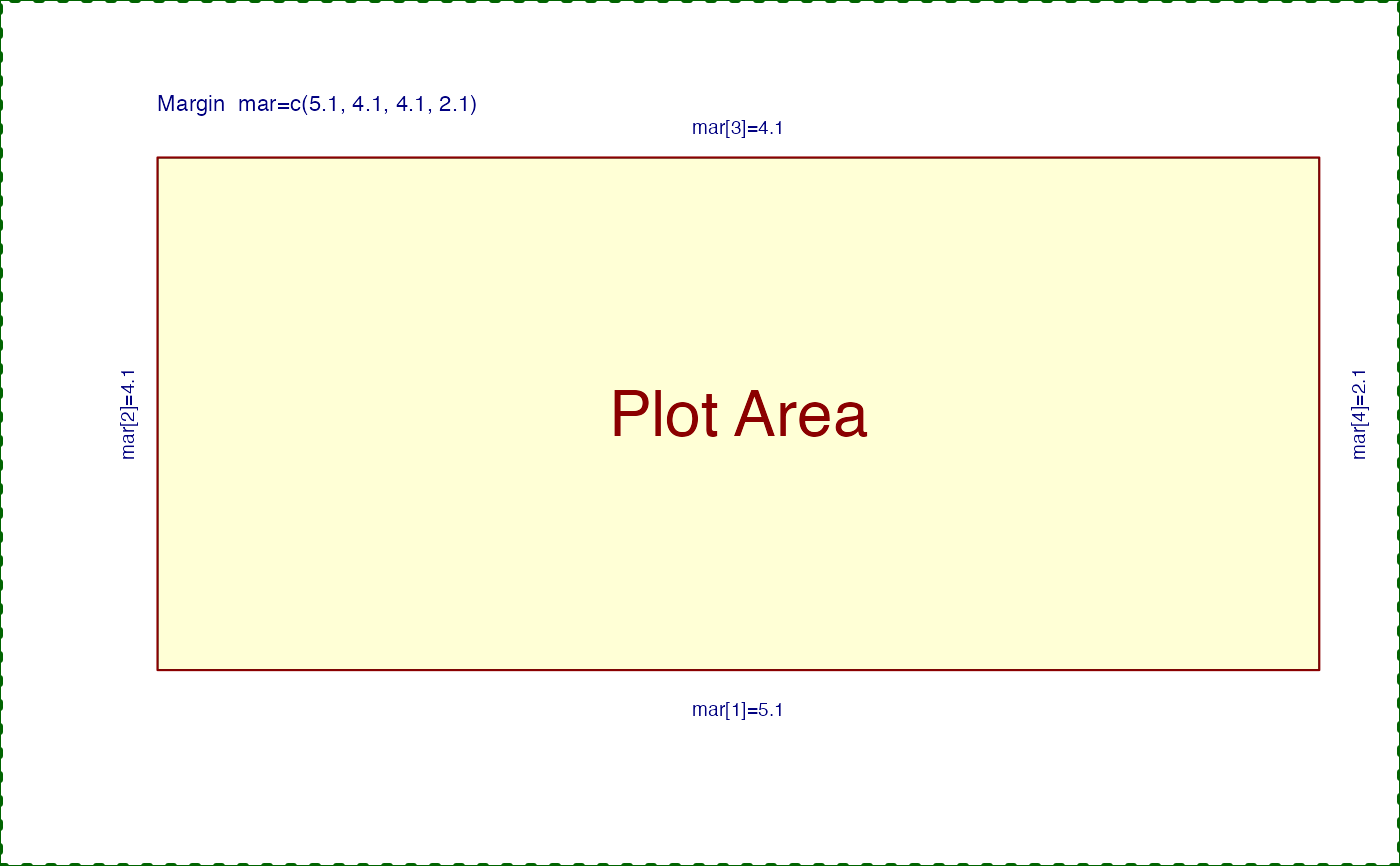
plotAreaTitle = "Plot Area",
plotSrt = 0,
plotNumPrefix = "",
bty = "n",
showMarginsOnly = FALSE,
add = FALSE,
...
)Arguments
- xaxt
charactervalue compatible withoptions("xaxt")- yaxt
charactervalue compatible withoptions("xaxt")- xlab
characterx-axis label- ylab
charactery-axis label- col
charactercolors passed toplot()- xlim
numericx-axis range- ylim
numericy-axis range- las
integervalue indicating whether axis labels should be parallel (1) or perpendicular (2) to the axis line.- doBoxes
logicalwhether to draw annotated boxes around the plot and inner and outer margins.- doUsrBox
logicalwhether to draw a colored bow indicating the exact plot space, using the functionusrBox().- fill
characterR color used to fill the background of the plot as used byusrBox().- doAxes
logicalwhether to draw default x- and y-axes.- doMargins
logicalwhether to label margins, only active when doBoxes=TRUE.- marginUnit
characterindicating the units used for margin labels.- plotAreaTitle
characterlabel printed in the center of the plot area.- plotSrt
numeric angle for the plotAreaTitle, which is good for labeling this plot with vertical text when displaying a plot panel inside a grid layout, where the plot is taller than it is wide.
- plotNumPrefix
characteror integer label appended as suffix to margin labels, which is useful when annotating multiple plots in a grid layout, where labels are sometimes quite close together. This label is but a simple attempt to sidestep the real problem of fitting labels inside each visual component.- bty
characterpassedplot(), default"n"suppresses the default box, which can then be optionally drawn based upon thedoBoxesparameter.- showMarginsOnly
logicalwhether to create a new plot or to annotate an existing active plot.- add
logicalwhether to add to an existing active R plot, or create a new plot window.- ...
additional arguments are ignored.
Value
no output, this function is called for the byproduct of creating a blank plot, optionally annotating the margins.
Details
This function creates an empty plot space, using the current
graphics::par() settings for margins, text size, etc. By default
it displays a box around the plot window, and labels the margins and
plot area for review. It can be useful as a visual display of various
base graphics settings, or to create an empty plot window with pre-defined
axis ranges. Lastly, one can use this function to create a "blank" plot
which uses a defined background color, which can be a useful precursor to
drawing an image density which may not cover the whole plot space.
See also
Other jam plot functions:
adjustAxisLabelMargins(),
coordPresets(),
decideMfrow(),
drawLabels(),
getPlotAspect(),
groupedAxis(),
imageByColors(),
imageDefault(),
minorLogTicksAxis(),
plotPolygonDensity(),
plotRidges(),
plotSmoothScatter(),
shadowText(),
shadowText_options(),
showColors(),
sqrtAxis(),
usrBox()