Determine square root axis tick mark positions, including positive and negative range values.
Usage
sqrtAxis(
  side = 1,
  x = NULL,
  pretty.n = 10,
  u5.bias = 1,
  big.mark = ",",
  plot = TRUE,
  las = 2,
  cex.axis = 0.6,
  ...
)
Arguments
- side
integervalue indicating the axis position, as used bygraphics::axis(), 1=bottom, 2=left, 3=top, 4=right. Note that whenxis supplied, the numeric range is defined using values inxand not the axis side.- x
optional
numericvector representing the numeric range to be labeled. When supplied, the numeric range ofxis used and not the axis side.- pretty.n
numericvalue indicating the number of desired tick marks, passed topretty().- u5.bias
numericvalue passed topretty()to influence the frequency of intermediate tick marks.- big.mark
charactervalue passed toformat()which helps visually distinguish numbers larger than 1000.- plot
logicalindicating whether to plot the axis tick marks and labels.- las, cex.axis
numericvalues passed tographics::axis()when drawing the axis. The custom defaultlas=2plots labels rotated perpendicular to the axis.- ...
additional parameters are passed to
pretty(), and tographics::axis()whenplot=TRUE.
Value
invisible numeric vector with axis positions, named
by normal space numeric labels. The primary use is to
add numeric axis tick marks and labels.
Details
This function calculates positions for tick marks for data
that has been transformed with sqrt(), specifically a directional
transformation like sqrt(abs(x)) * sign(x).
If x is supplied, it is used to define the numeric range, otherwise
the observed range is taken based upon side. If neither x nor side
is supplied, or if the numeric range is empty or zero width,
it returns NULL.
The main goal of this function is to provide reasonably placed tick marks using integer values.
See also
Other jam plot functions:
adjustAxisLabelMargins(),
coordPresets(),
decideMfrow(),
drawLabels(),
getPlotAspect(),
groupedAxis(),
imageByColors(),
imageDefault(),
minorLogTicksAxis(),
nullPlot(),
plotPolygonDensity(),
plotRidges(),
plotSmoothScatter(),
shadowText(),
shadowText_options(),
showColors(),
usrBox()
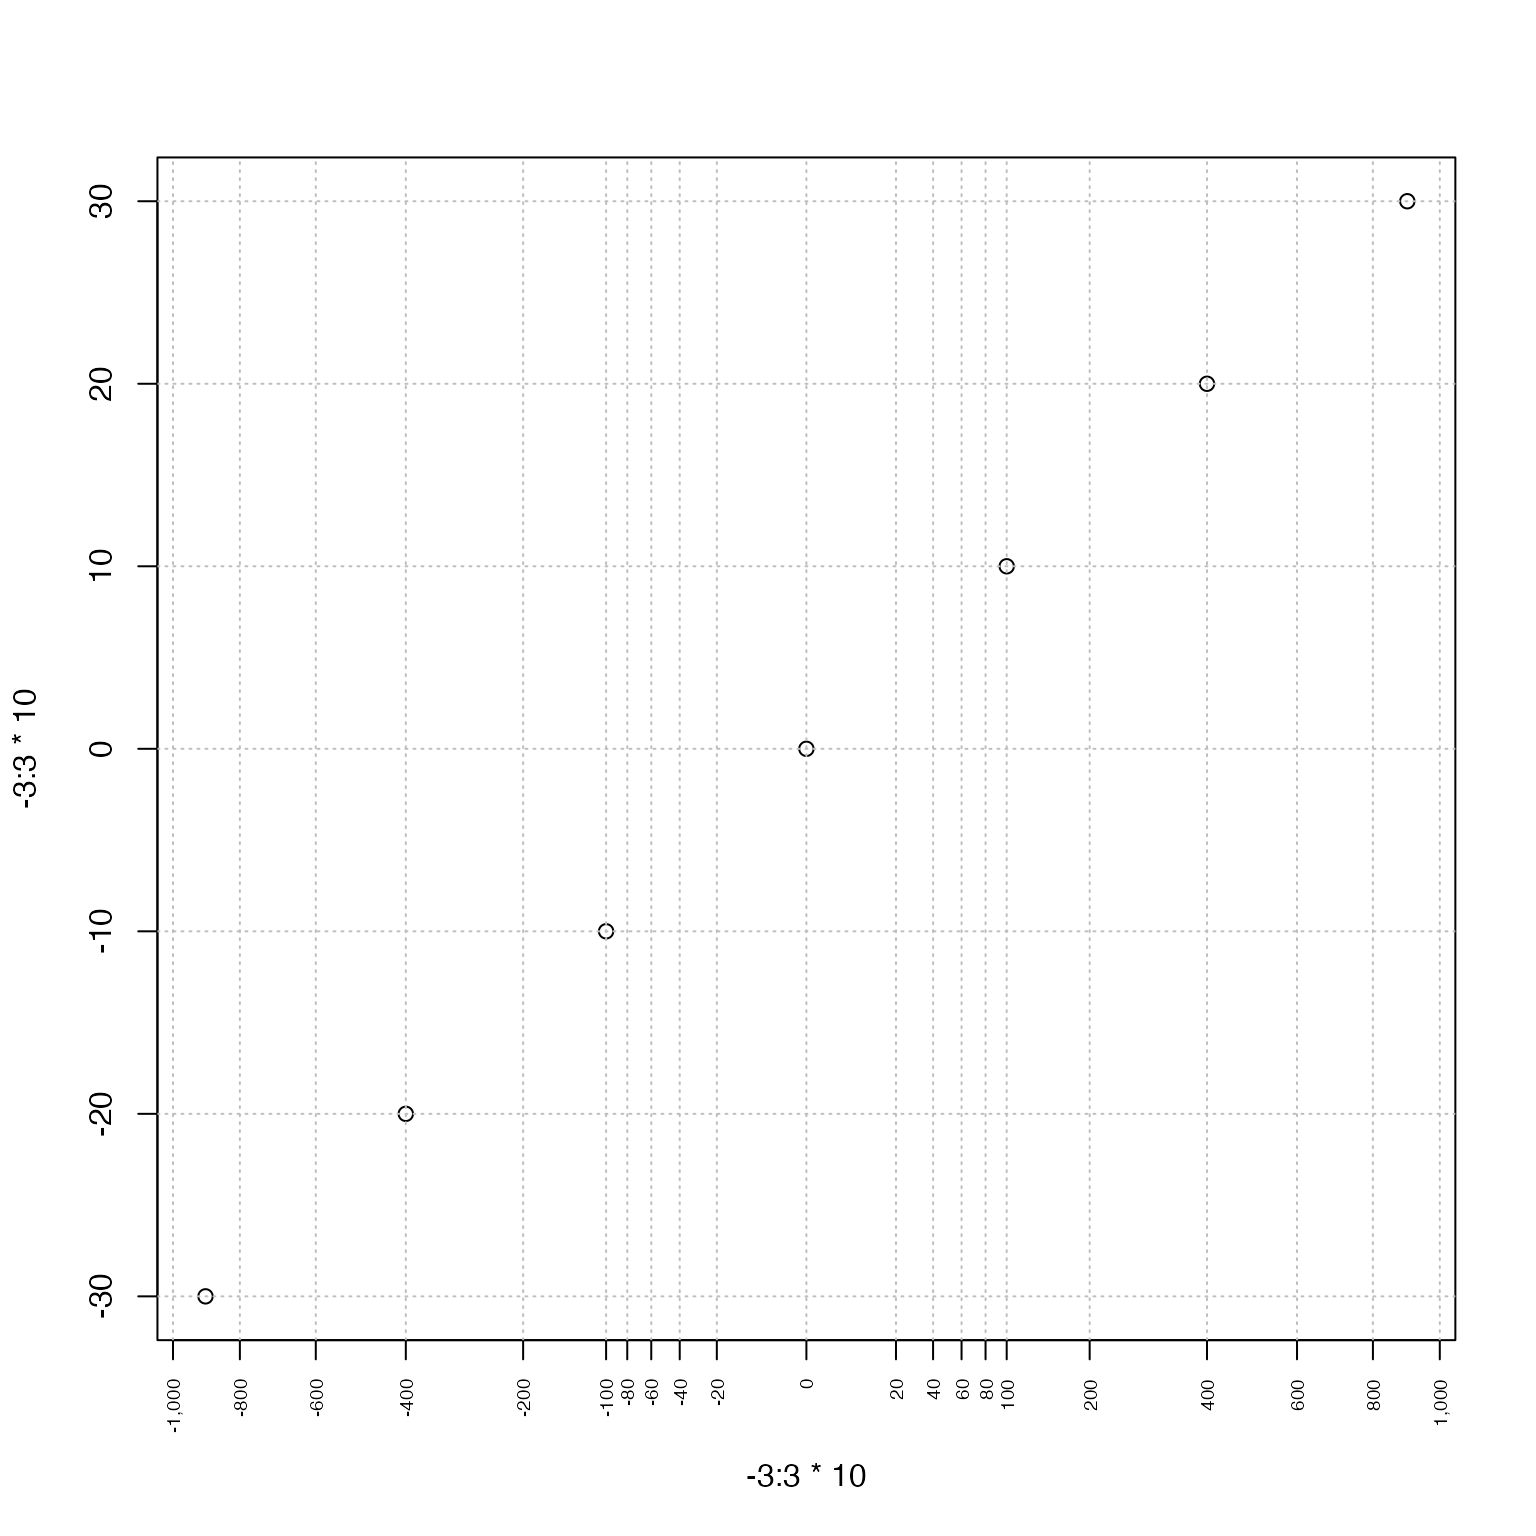
Examples
plot(-3:3*10, -3:3*10, xaxt="n")
x <- sqrtAxis(1)
abline(v=x, col="grey", lty="dotted")
abline(h=pretty(par("usr")[3:4]), col="grey", lty="dotted")


# slightly different label placement with u5.bias=0
plot(-3:3*10, -3:3*10, xaxt="n")
x <- sqrtAxis(1, u5.bias=0)
abline(v=x, col="grey", lty="dotted")
abline(h=pretty(par("usr")[3:4]), col="grey", lty="dotted")
# slightly different label placement with u5.bias=0
plot(-3:3*10, -3:3*10, xaxt="n")
x <- sqrtAxis(1, u5.bias=0)
abline(v=x, col="grey", lty="dotted")
abline(h=pretty(par("usr")[3:4]), col="grey", lty="dotted")