Decide plot panel rows, columns for graphics::par(mfrow)
Usage
decideMfrow(
  n,
  method = c("aspect", "wide", "tall"),
  doTest = FALSE,
  xyratio = 1,
  trimExtra = TRUE,
  ...
)
Arguments
- n
integernumber of plot panels- method
characterstring indicating the type of layout to favor.- "aspect"
uses the device size and aspect ratio of the plot to try to maintain roughly square plot panels.
- "wide"
tries to keep the columns and rows similar, erring on the side of more columns than rows.
- "tall"
tries to keep the columns and rows similar, erring on the side of more rows than columns.
- doTest
logicalwhether to provide a visual test. Note thatnis required as the number of plot panels requested.- xyratio
numericdefault 1, with the desired target x-to-y ratio. For example, to have plots slightly wider (x width) than tall (y height), usexyratio=1.3. The observed device aspect ratio is divided byxyratioto determine the target aspect ratio of plot panels.- trimExtra
logicaldefault TRUE, whether to trim blank rows or columns in the expected layout when it would be entirely blank. For example,n=4may producec(3, 2)output to meet the desired aspect ratio, however withtrimExtra=TRUEit would be reduced toc(2, 2)to minimize unused whitespace.- ...
additional parameters are ignored.
Value
numeric vector length=2, with the recommended number of plot
rows and columns, respectively. It is intended to be used directly
in this form: graphics::par("mfrow"=decideMfrow(n=5))
Details
This function returns the recommended rows and columns of panels
to be used in graphics::par("mfrow") with R base plotting. It attempts
to use the device size and plot aspect ratio to keep panels roughly
square. For example, a short-wide device would have more columns of panels
than rows; a tall-thin device would have more rows than columns.
The doTest=TRUE argument will create n number of
panels with the recommended layout, as a visual example.
Note this function calls getPlotAspect(),
therefore if no plot device is currently open,
the call to graphics::par() will open a new graphics device.
See also
Other jam plot functions:
adjustAxisLabelMargins(),
coordPresets(),
drawLabels(),
getPlotAspect(),
groupedAxis(),
imageByColors(),
imageDefault(),
minorLogTicksAxis(),
nullPlot(),
plotPolygonDensity(),
plotRidges(),
plotSmoothScatter(),
shadowText(),
shadowText_options(),
showColors(),
sqrtAxis(),
usrBox()
Examples
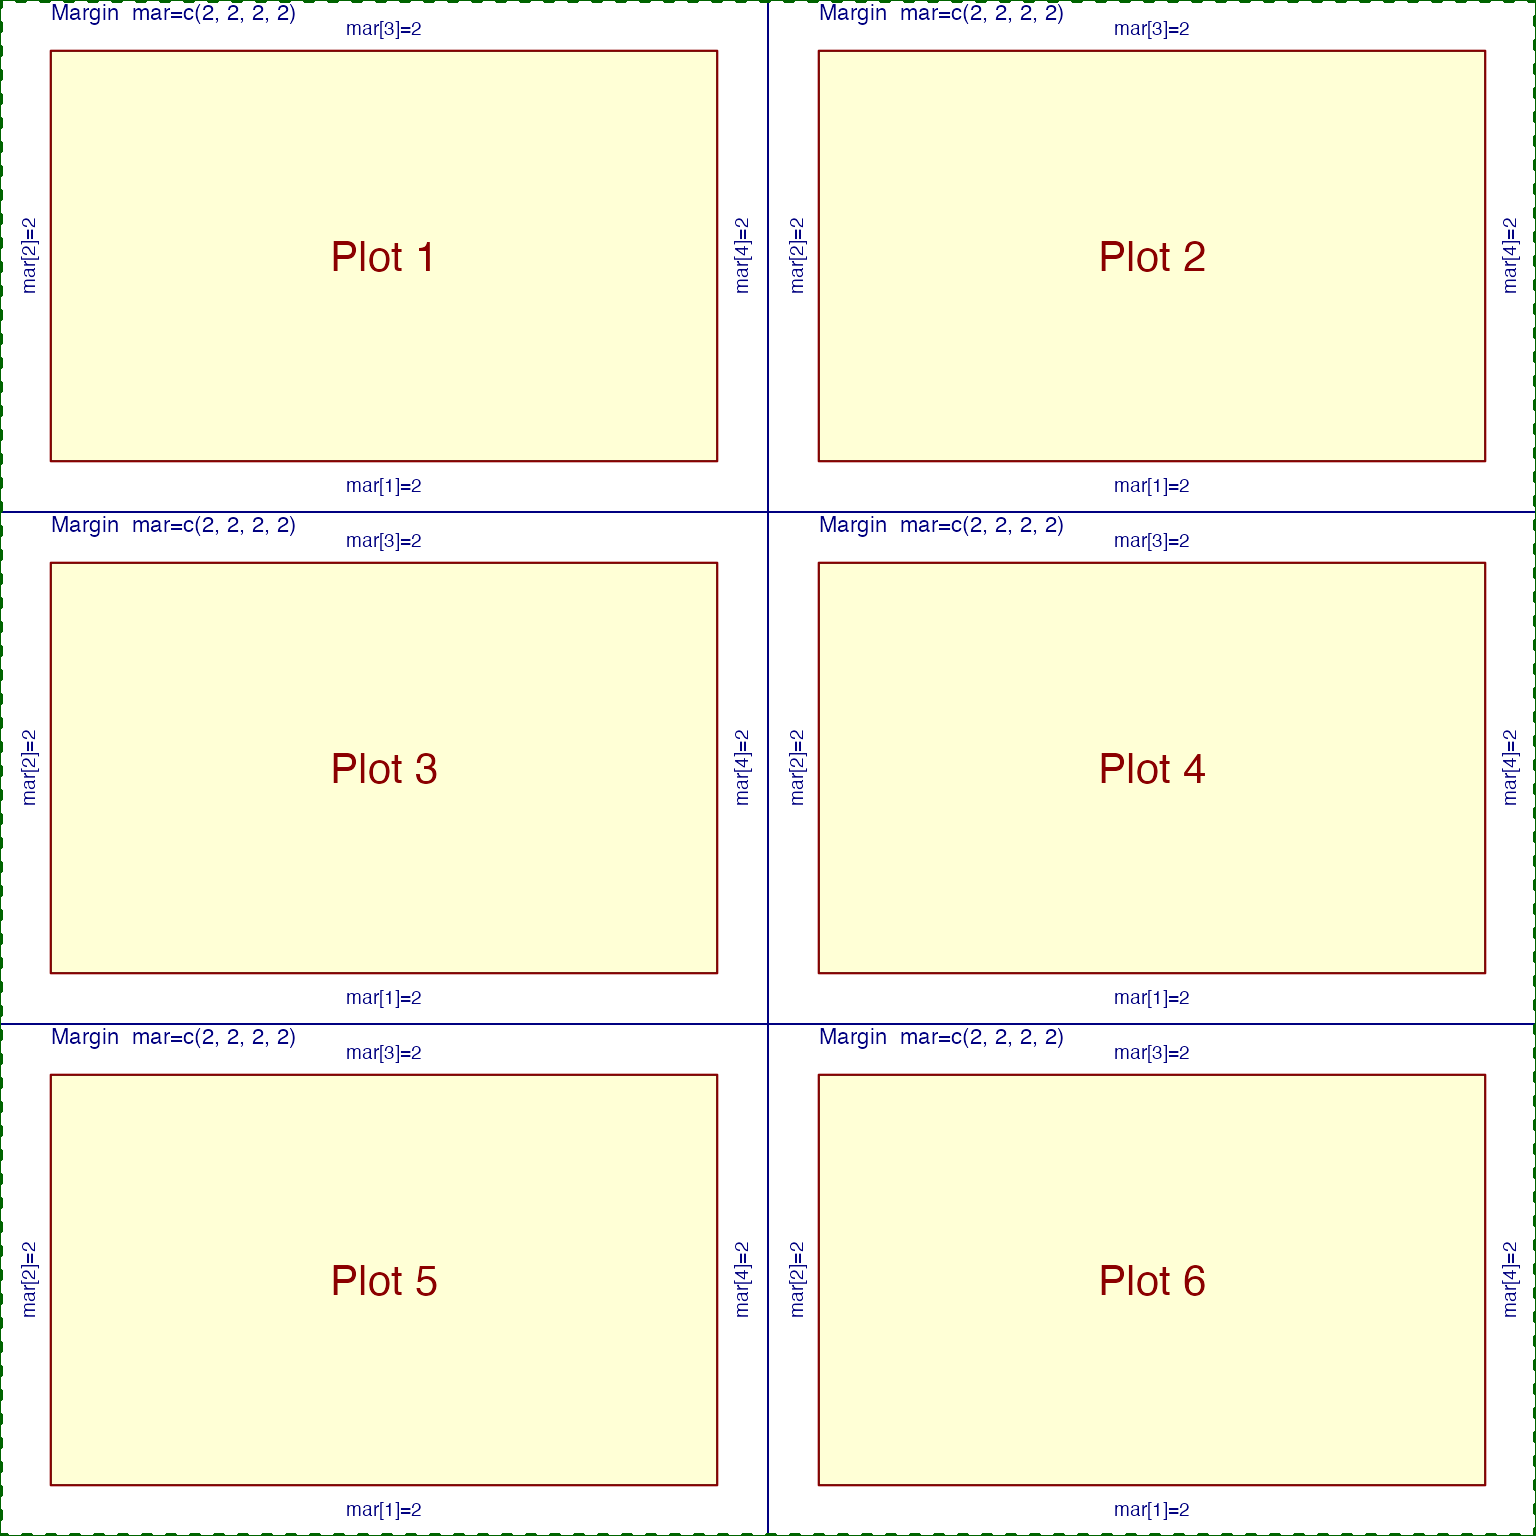
# display a test visualization showing 6 panels
withr::with_par(list("mar"=c(2, 2, 2, 2)), {
decideMfrow(n=6, doTest=TRUE);
})
 #> [1] 3 2
# use a custom target xyratio of plot panels
withr::with_par(list("mar"=c(2, 2, 2, 2)), {
decideMfrow(n=3, xyratio=3, doTest=TRUE);
})
#> [1] 3 2
# use a custom target xyratio of plot panels
withr::with_par(list("mar"=c(2, 2, 2, 2)), {
decideMfrow(n=3, xyratio=3, doTest=TRUE);
})
 #> [1] 3 1
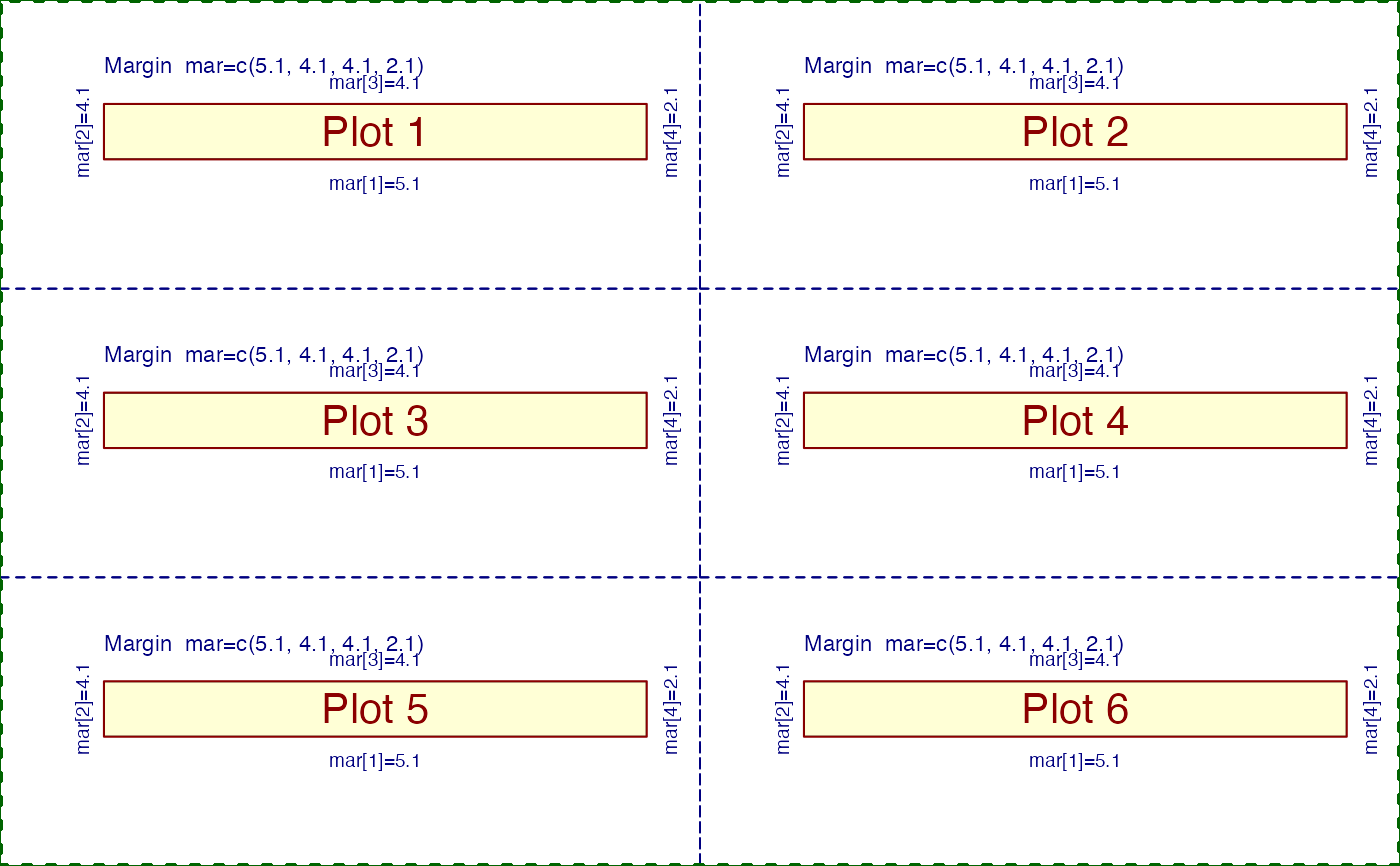
# a manual demonstration creating 6 panels
n <- 6;
withr::with_par(list(
"mar"=c(2, 2, 2, 2),
"mfrow"=decideMfrow(n)), {
for(i in seq_len(n)){
nullPlot(plotAreaTitle=paste("Plot", i));
}
})
#> [1] 3 1
# a manual demonstration creating 6 panels
n <- 6;
withr::with_par(list(
"mar"=c(2, 2, 2, 2),
"mfrow"=decideMfrow(n)), {
for(i in seq_len(n)){
nullPlot(plotAreaTitle=paste("Plot", i));
}
})