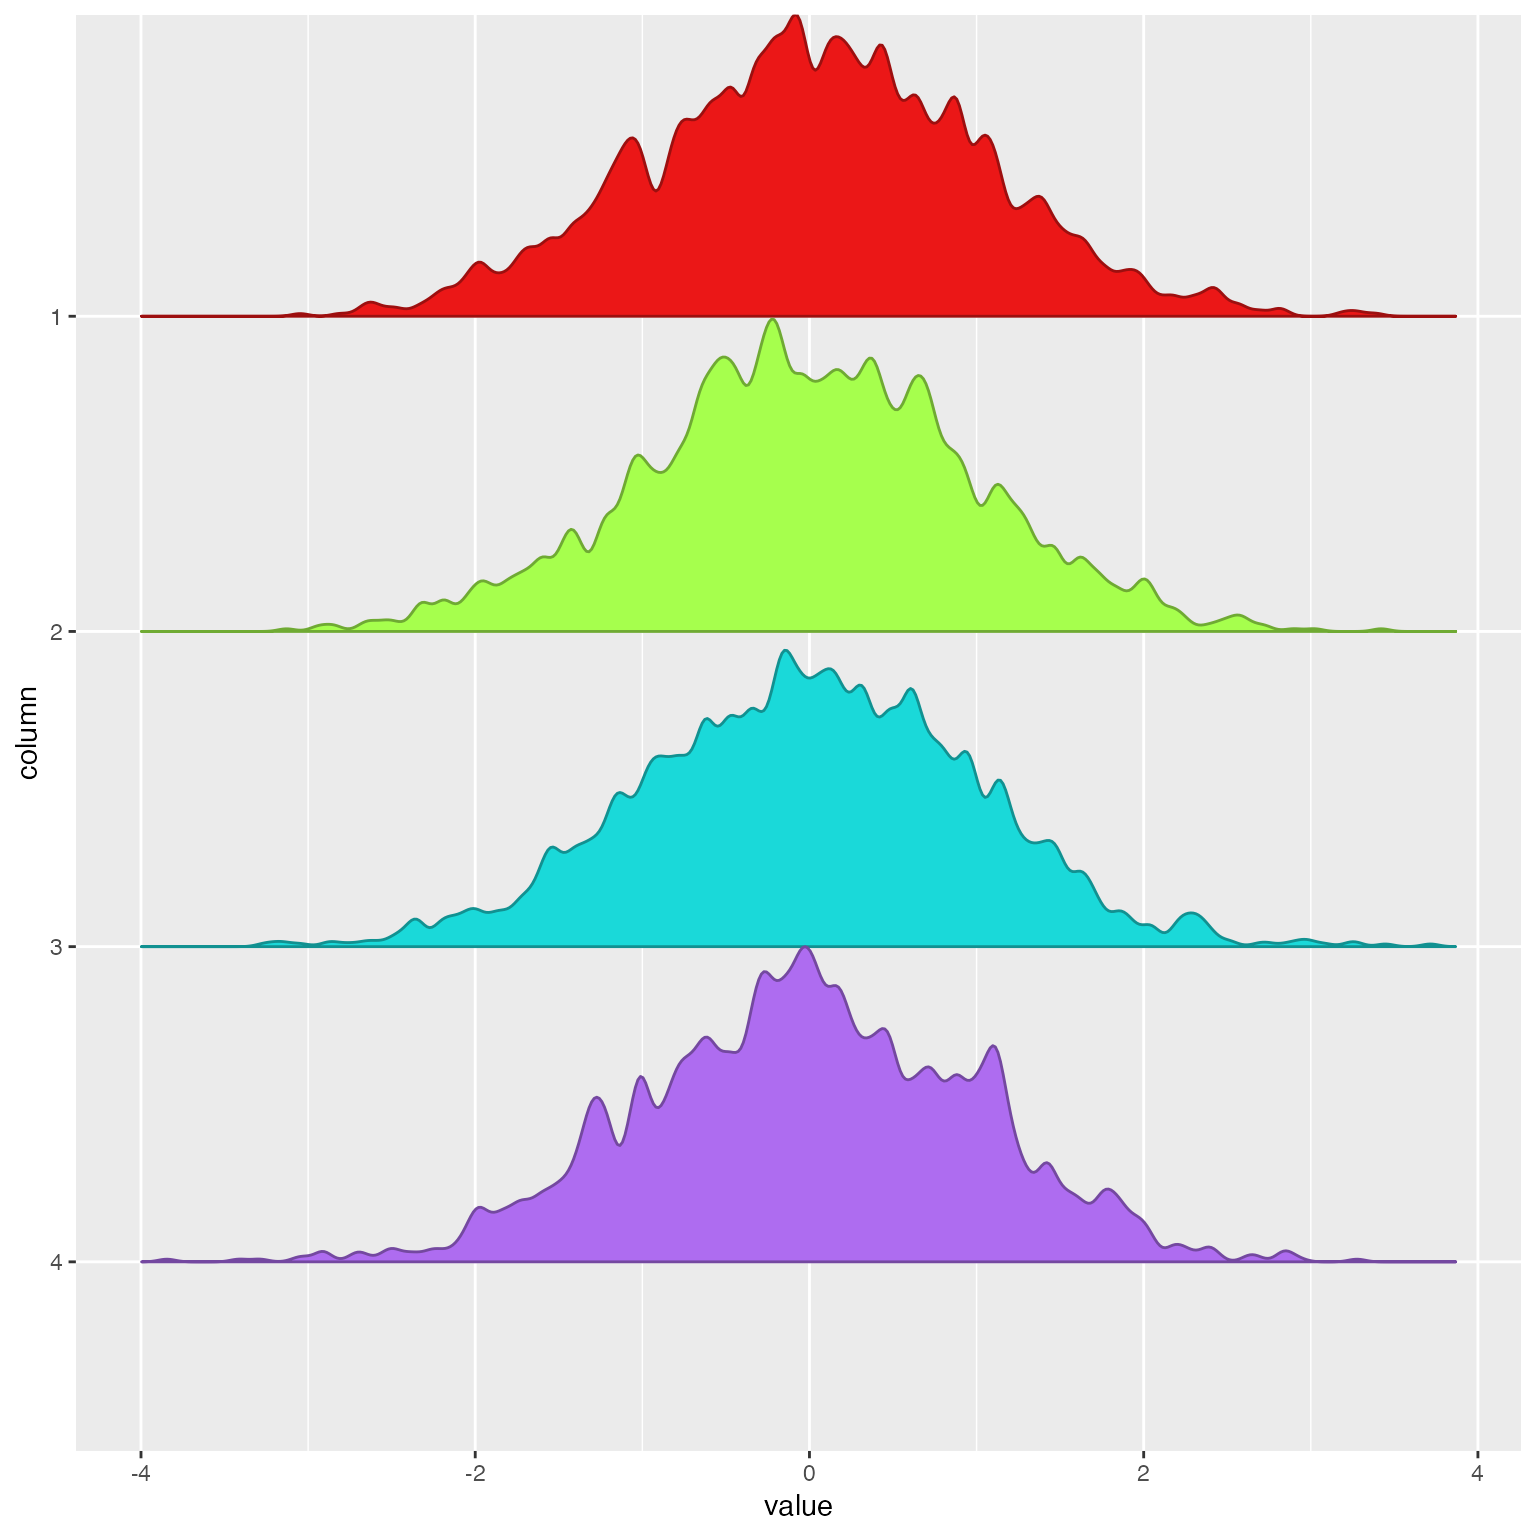
Plot ridges density plots for numeric matrix input
Arguments
- x
matrixwith numeric values, or alistofnumericvectors. In either case the data is converted to long-tall format before plotting.- xScale
characterstring indicating whether to transform the x-axis values:"none": no transformation"-log10": values are transformed withlog10(x)and x-axis labels are adjusted accordingly."log10": values are transformed withlog10(1 + x)except that negative values are transformed with-log10(1 - x). The x-axis labels are plotted to account for thelog10(1 + x)offset.
- xlab, ylab
characterstrings optionally used as x-axis and y-axis labels.- title, subtitle, caption
characterstring values optionally passed to the relevant downstreamggplot2functions.- xlim
passed to
ggplot2::xlim()to define the x-axis range.- color_sub
charactervector named bycolnames(x), or whenxis alist,names(color_sub)should containnames(x), used to define specific colors for each ridge plot.- rel_min_height
numericvalues passed toggridges::geom_density_ridges2()- bandwidth
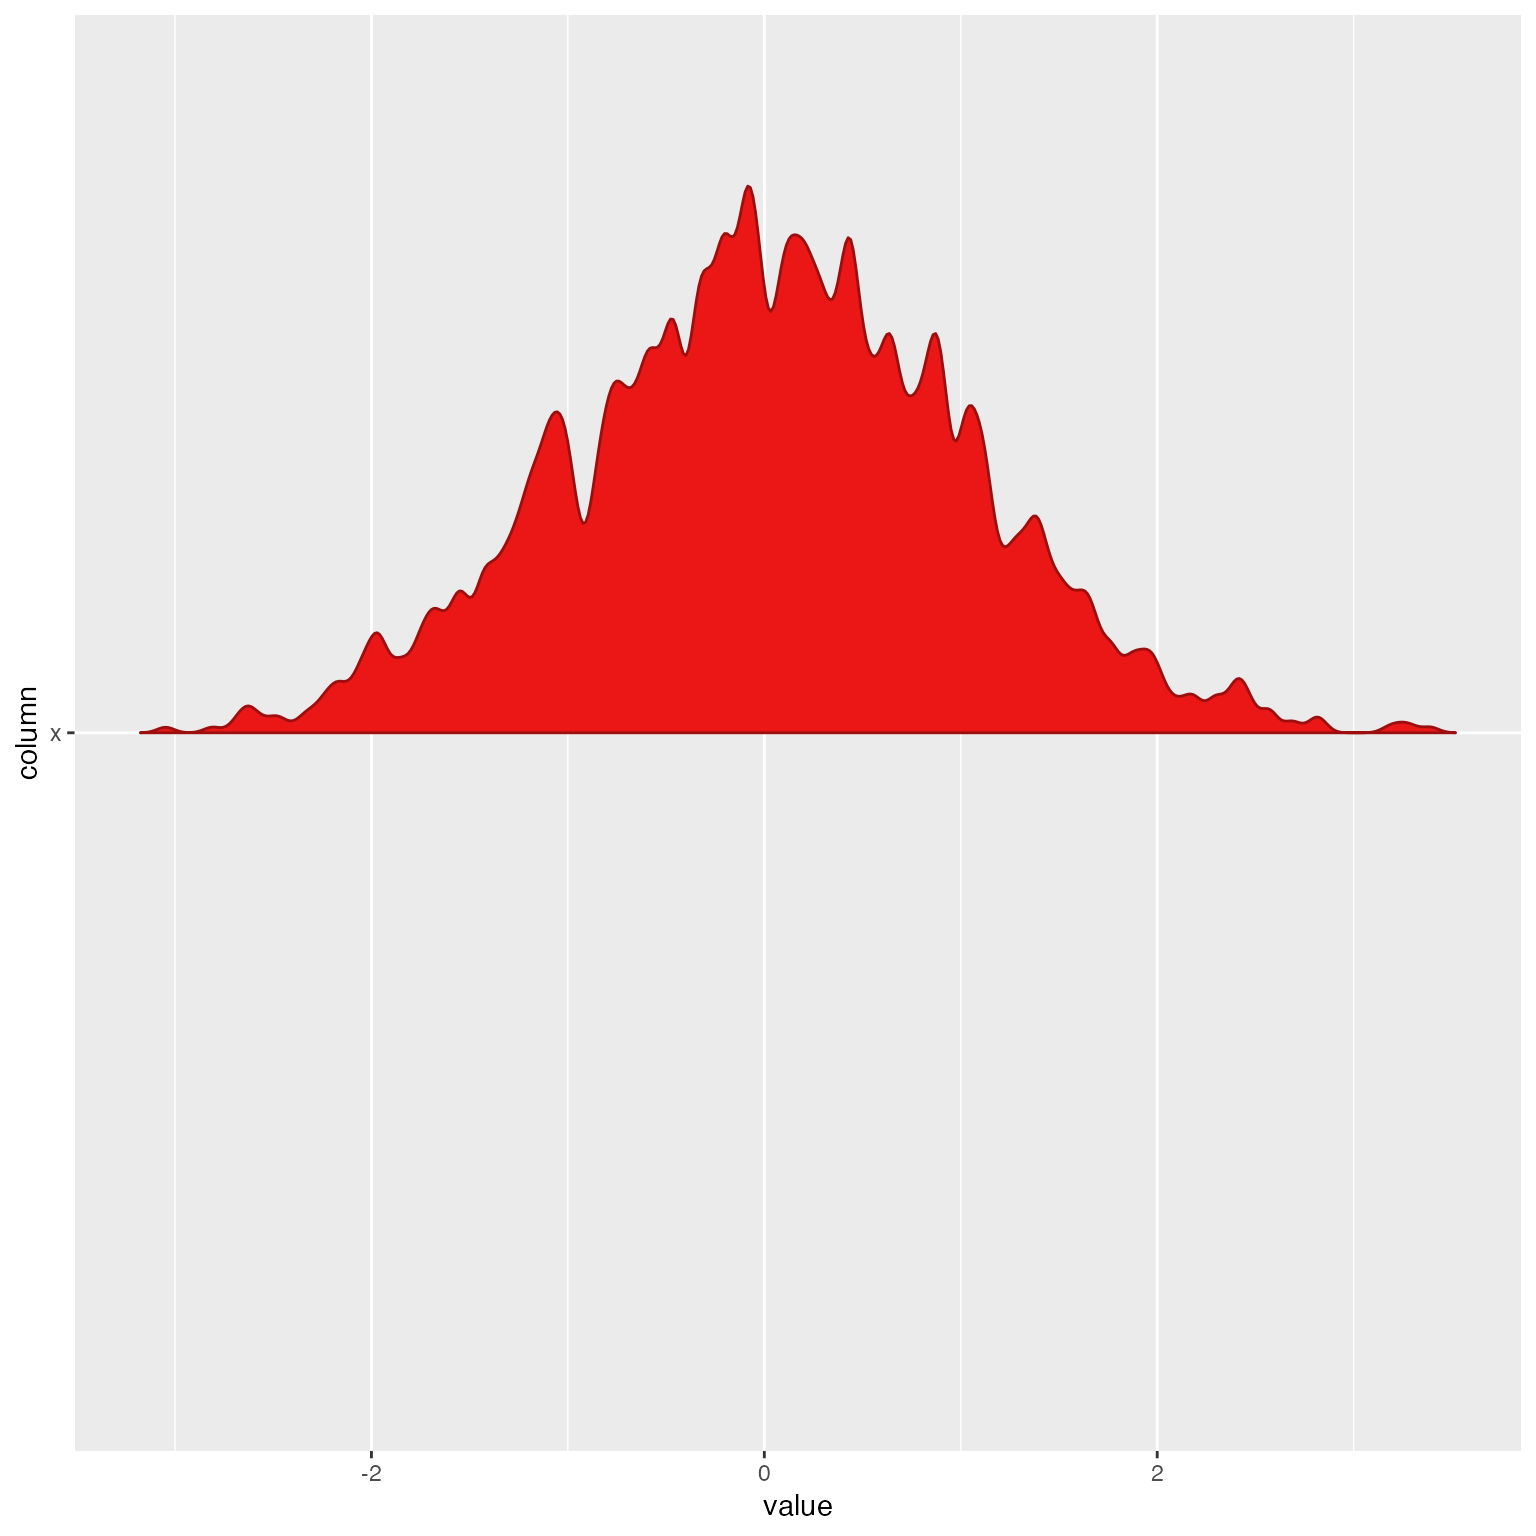
numericvalue used to define the bandwidth density whenshare_bandwidth=TRUEwhich is default. The bandwidth affects the level of detail presented in each ridgeline, and when shared across ridgelinesshare_bandwidth=TRUEthen each ridgeline will use the same consistent level of detail. In this case, it is passed toggridges::geom_density_ridges2(). Note whenbandwidth=NULLa default value is derived from the range of data to be plotted.- adjust
numericused to adjust the default bandwidth only whenbandwidth=NULL. It is intended as a convenient method to adjust the level of detail.- scale
numericpassed directly toggridges::geom_density_ridges2().logicalindicating whether to supplyggridges::geom_density_ridges2()a specificbandwidthto use for all ridgelines. Whenshare_bandwidth=FALSEthen each ridgeline is presented using the default bandwidth inggridges::geom_density_ridges2().- ...
additional arguments are ignored.
Details
This function is a convenient wrapper for ggridges::geom_density_ridges2(),
intended to be analogous to plotPolygonDensity() which differs
by plotting each item in a separate plot panel using base graphics.
This function plots each item as a ridgeline plot in the same
plot window using ggplot2::ggplot().
See also
Other jam plot functions:
adjustAxisLabelMargins(),
coordPresets(),
decideMfrow(),
drawLabels(),
getPlotAspect(),
groupedAxis(),
imageByColors(),
imageDefault(),
minorLogTicksAxis(),
nullPlot(),
plotPolygonDensity(),
plotSmoothScatter(),
shadowText(),
shadowText_options(),
showColors(),
sqrtAxis(),
usrBox()