Sample exon coverage data GRanges
Details
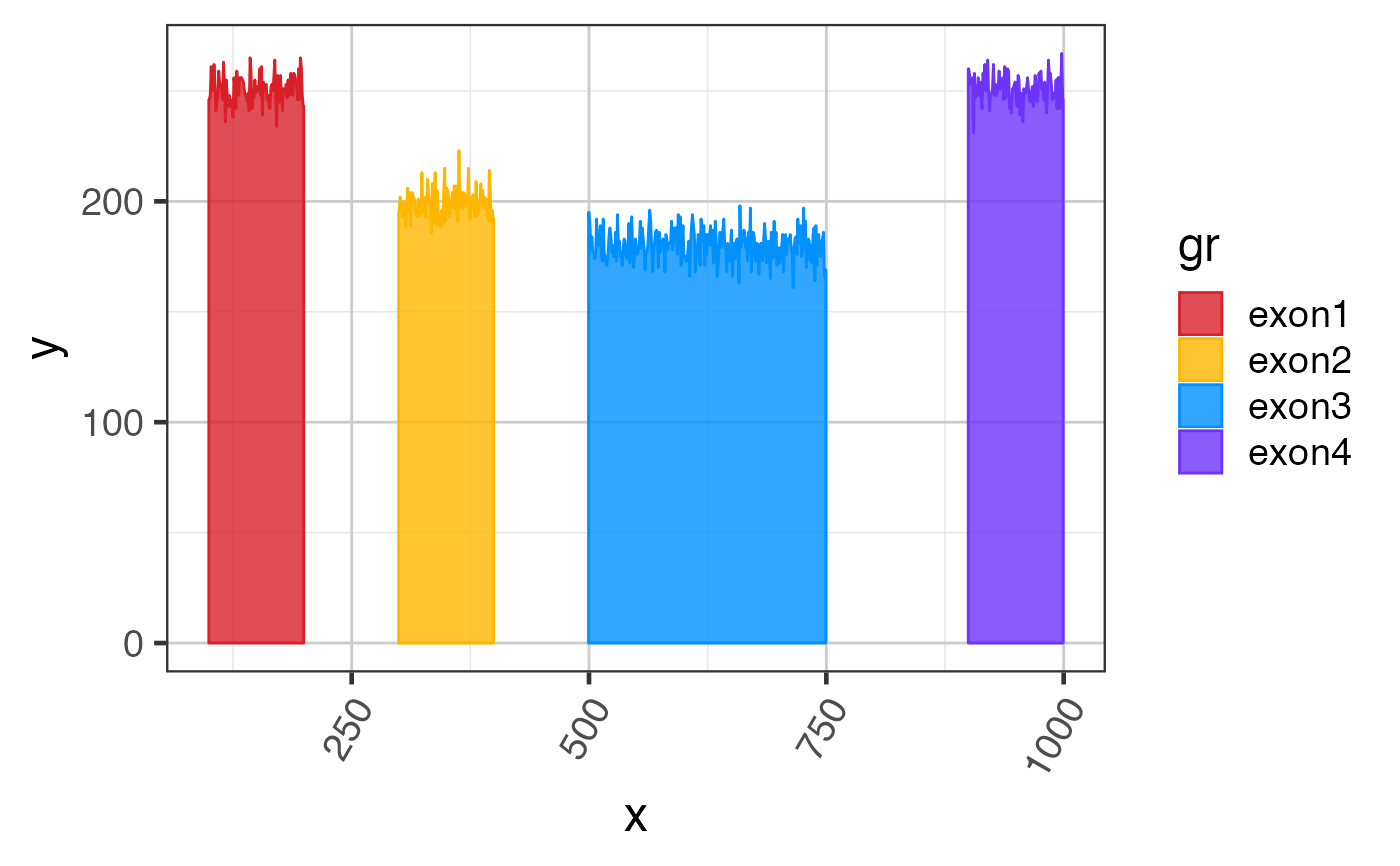
This dataset represents exon GRanges with an additional column with NumericList values representing RNA-seq read coverage across these exons.
See also
Other Splicejam data:
sjenvtest,
test_cov_wide_gr,
test_exon_gr,
test_exon_wide_gr,
test_junc_gr,
test_junc_wide_gr
Examples
suppressPackageStartupMessages(library(GenomicRanges));
suppressPackageStartupMessages(library(ggplot2));
data(test_exon_gr);
# The steps below demonstrate how to create coverage data manually
test_cov_gr <- test_exon_gr;
set.seed(123);
cov_values <- c(250, 200, 180, 250);
values(test_cov_gr)[,"sample_A"] <- NumericList(
lapply(seq_along(test_exon_gr), function(i){
cov_values[i] +
round(rnorm(GenomicRanges::width(test_exon_gr)[i])*7)
}));
test_cov_gr;
#> GRanges object with 4 ranges and 2 metadata columns:
#> seqnames ranges strand | gene_name sample_A
#> <Rle> <IRanges> <Rle> | <character> <NumericList>
#> exon1 chr1 100-199 + | TestGene1 246,248,261,...
#> exon2 chr1 300-399 + | TestGene1 195,202,198,...
#> exon3 chr1 500-749 + | TestGene1 195,189,178,...
#> exon4 chr1 900-999 + | TestGene1 260,257,253,...
#> -------
#> seqinfo: 1 sequence from an unspecified genome; no seqlengths
# You can plot coverage using exoncov2polygon()
exondf <- exoncov2polygon(test_cov_gr, covNames="sample_A");
gg3 <- ggplot(exondf,
aes(x=x, y=y, group=gr, fill=gr, color=gr)) +
ggforce::geom_shape(alpha=0.8,
stat="unpack_polygon") +
colorjam::theme_jam() +
colorjam::scale_fill_jam() +
colorjam::scale_color_jam();
print(gg3);
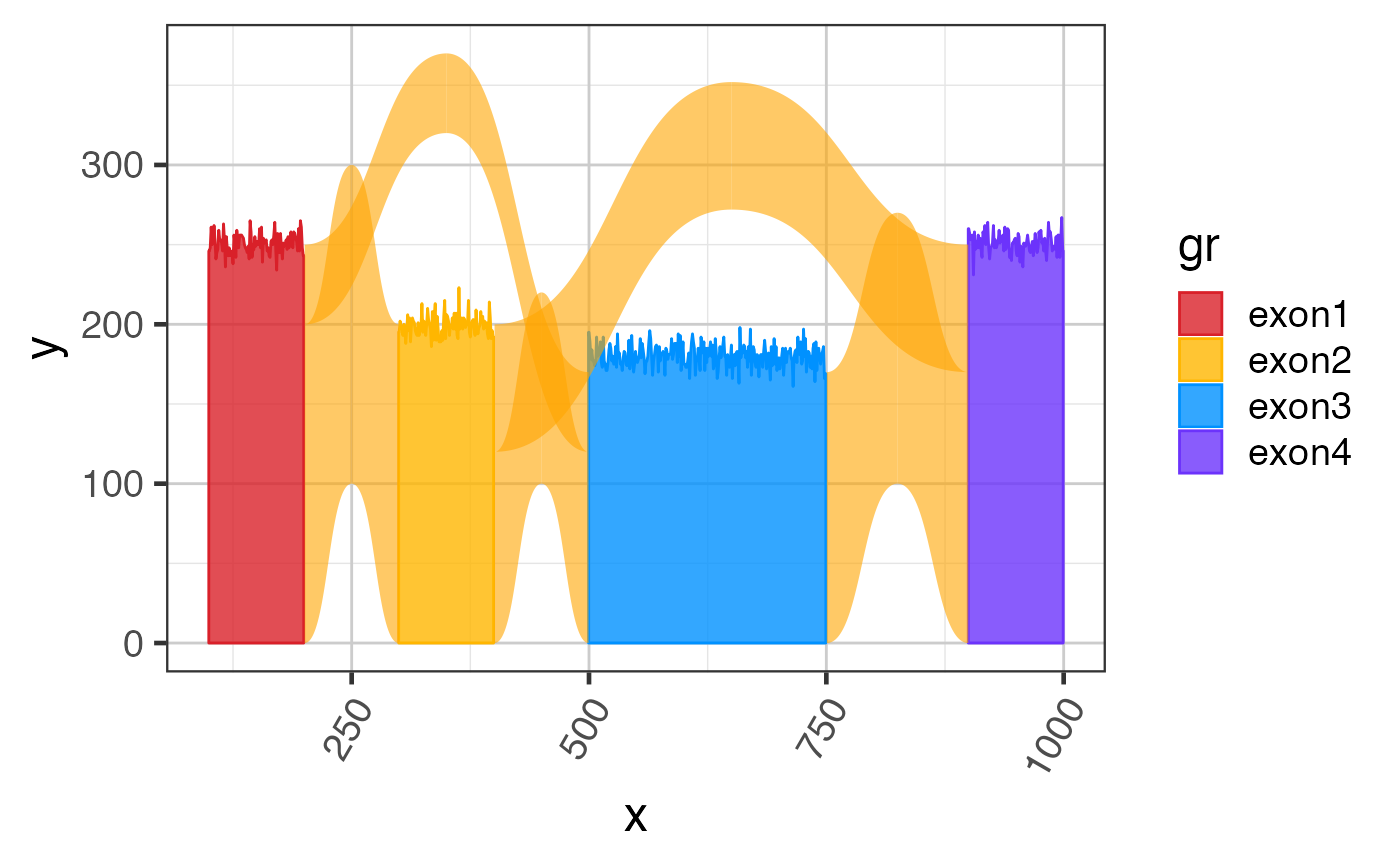
 # you can add junctions to exons in one plot
junc_df <- grl2df(test_junc_gr, shape="junction")
gg3 +
ggforce::geom_diagonal_wide(data=junc_df,
inherit.aes=FALSE,
show.legend=FALSE,
fill="orange",
aes(x=x, y=y, group=id),
alpha=0.6)
# you can add junctions to exons in one plot
junc_df <- grl2df(test_junc_gr, shape="junction")
gg3 +
ggforce::geom_diagonal_wide(data=junc_df,
inherit.aes=FALSE,
show.legend=FALSE,
fill="orange",
aes(x=x, y=y, group=id),
alpha=0.6)