Sample exon coverage data GRanges with wide introns
test_cov_wide_gr
Format
An object of class GRanges of length 4.
Details
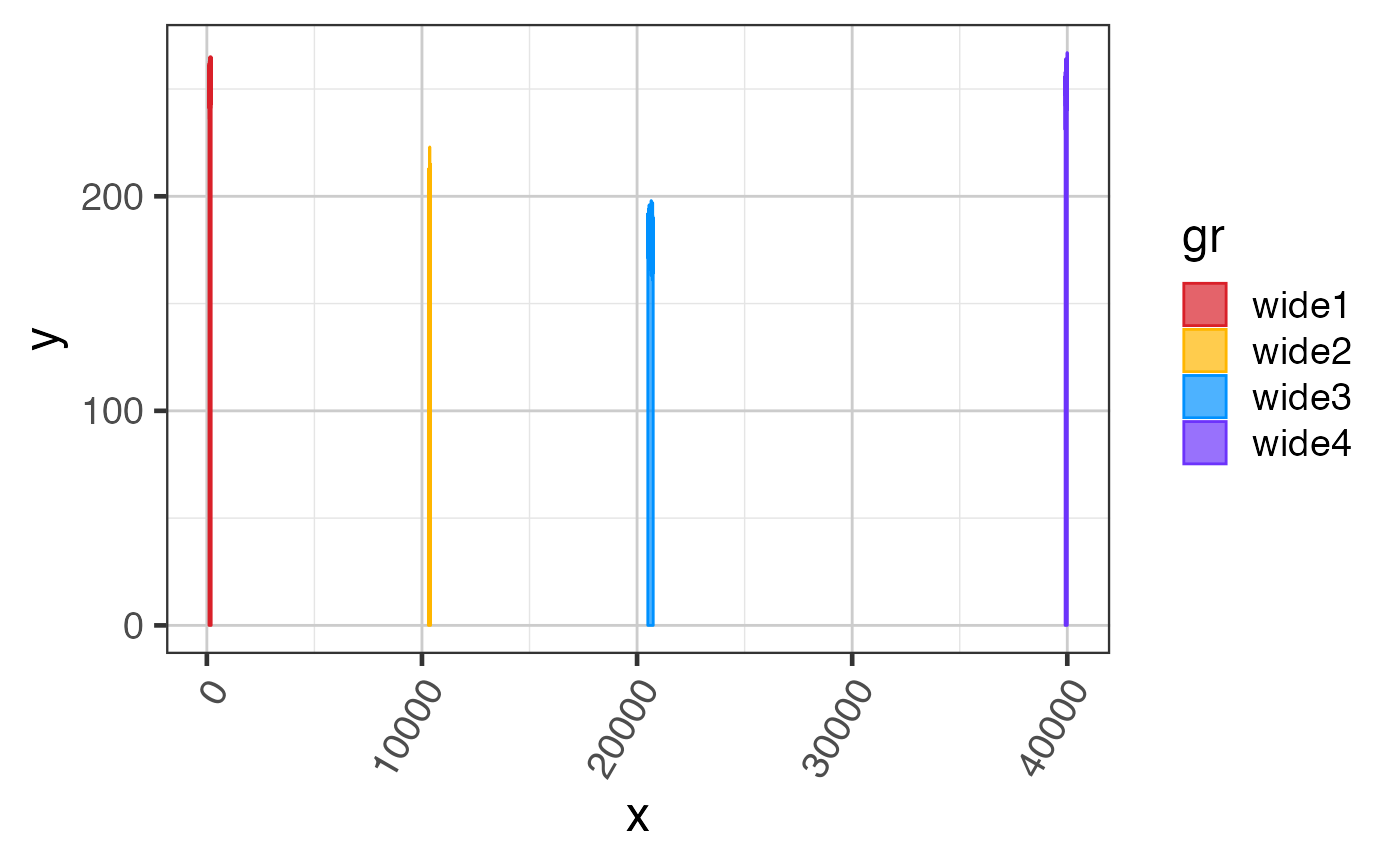
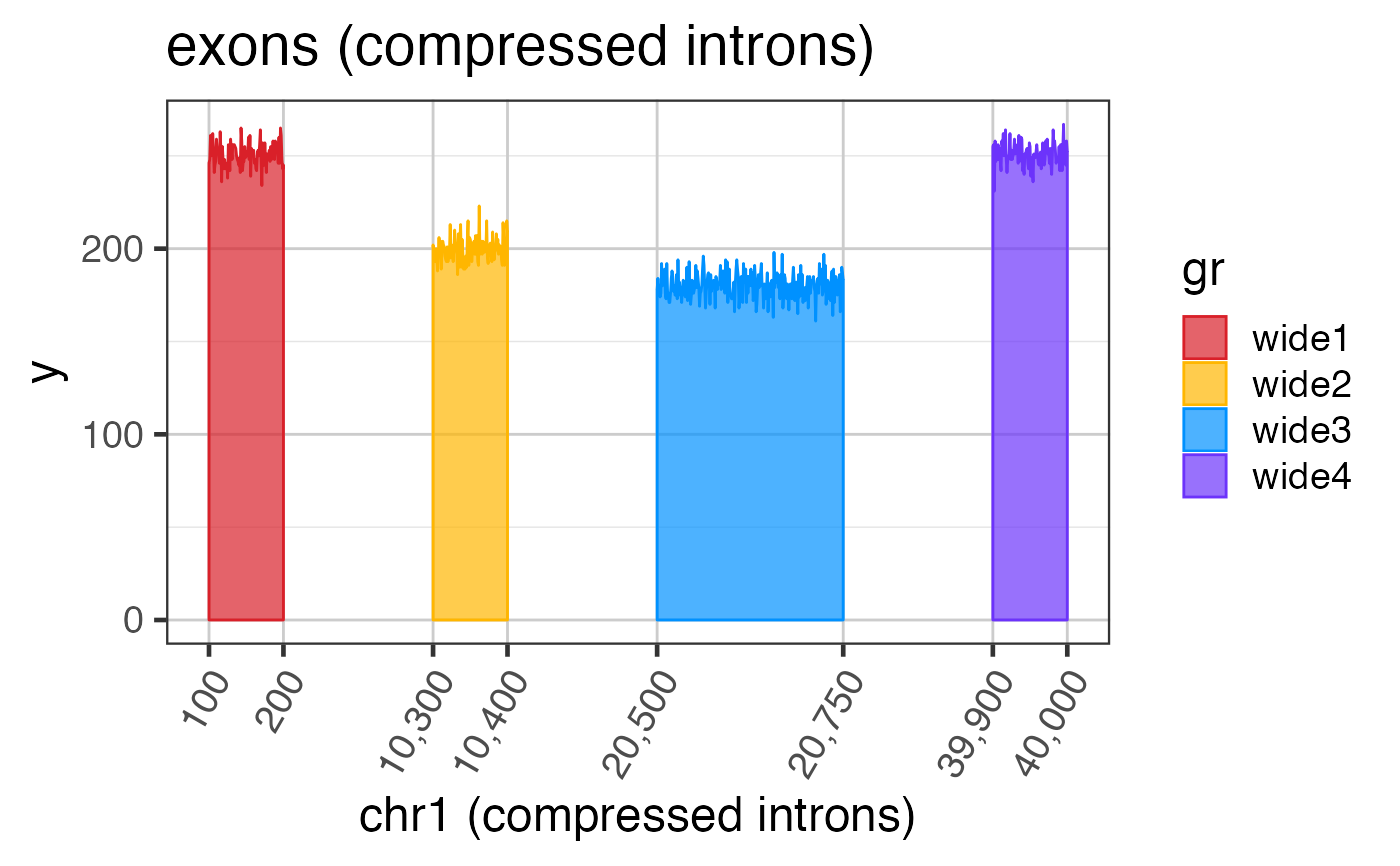
This dataset represents exon GRanges with an additional column with NumericList values representing RNA-seq read coverage across these exons.
Intron and exon sizes are more consistent with mammalian gene structure, and are intended to demonstrate the challenge with visualizing exon coverage data on a genomic scale. See examples for steps to compress the intron sizes.
See also
Other splicejam data:
test_cov_gr,
test_exon_gr,
test_exon_wide_gr,
test_junc_gr,
test_junc_wide_gr
Examples
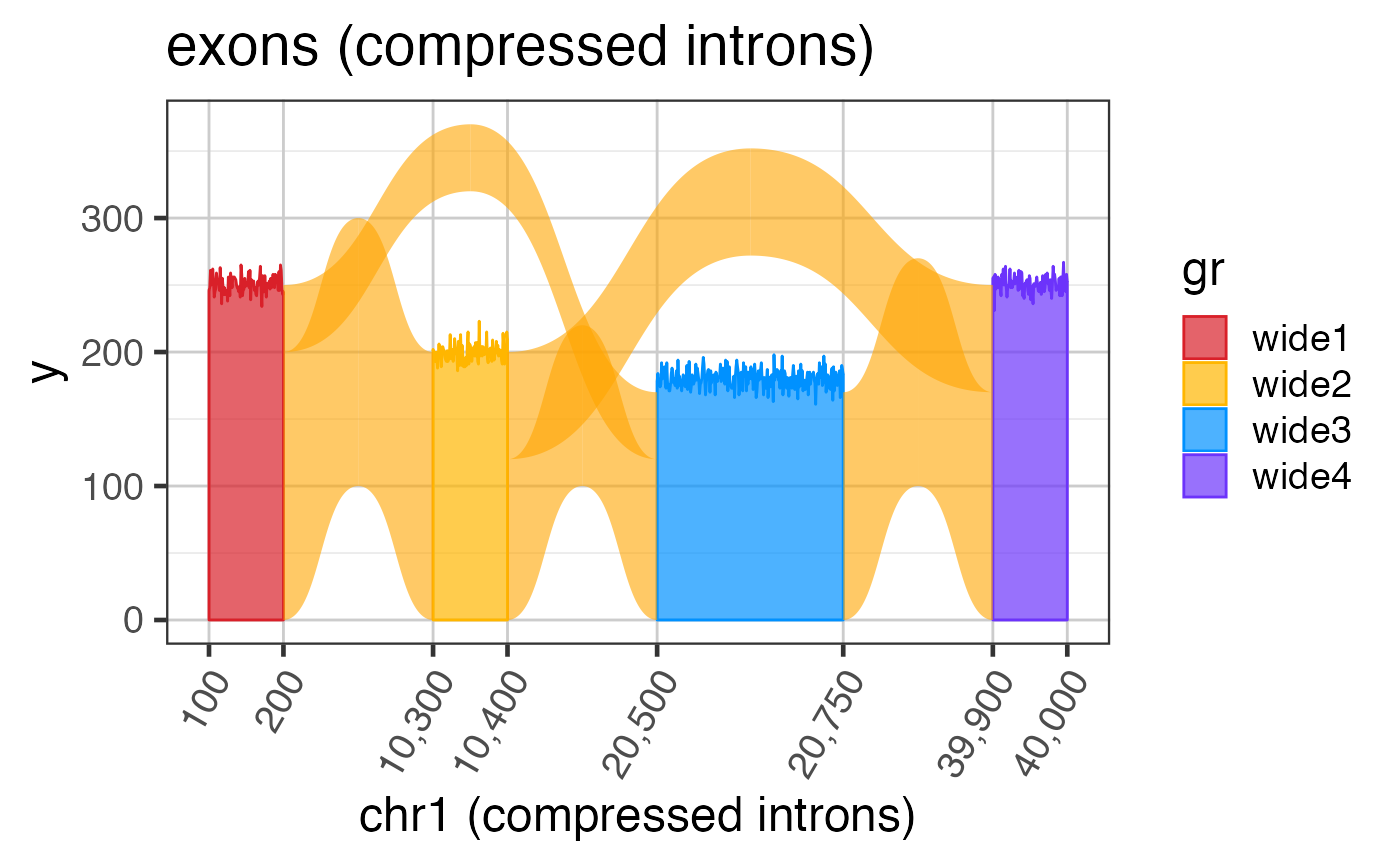
# The steps below demonstrate how to create coverage data manually suppressPackageStartupMessages(library(GenomicRanges)); suppressPackageStartupMessages(library(ggplot2)); data(test_cov_gr); data(test_exon_wide_gr); test_cov_wide_gr <- test_cov_gr; ranges(test_cov_wide_gr) <- ranges(test_exon_wide_gr); # You can plot coverage using exoncov2polygon() widecovdf <- exoncov2polygon(test_cov_wide_gr, covNames="sample_A"); ggWide3 <- ggplot(widecovdf, aes(x=x, y=y, group=gr, fill=gr, color=gr)) + ggforce::geom_shape(alpha=0.7) + colorjam::theme_jam() + colorjam::scale_fill_jam() + colorjam::scale_color_jam(); print(ggWide3);# Now compress the introns keeping axis labels ref2c <- make_ref2compressed(test_cov_wide_gr, nBreaks=10); ggWide3c <- ggWide3 + scale_x_continuous(trans=ref2c$trans_grc) + xlab("chr1 (compressed introns)") + ggtitle("exons (compressed introns)"); print(ggWide3c);# you can add junctions to exons in one plot junc_wide_c_df <-grl2df(test_junc_wide_gr, shape="junction", ref2c=ref2c); ggWide3c + ggforce::geom_diagonal_wide(data=junc_wide_c_df, inherit.aes=FALSE, show.legend=FALSE, fill="orange", aes(x=x, y=y, group=id), alpha=0.6)


