4.4 Automatic Text Contrast
In the previous section Figure 4.4,
the overlap fill defined by 'label.fill' was set to blue.
Text colors were also manually changed using label.color
to improve visual contrast. This step may be automated
by using make_color_contrast().
Given a set of input text colors in argument x, and
background colors in y, the function returns
a vector of colors to contrast with the background.
The purpose is to retain some color saturation, as opposed
to returning either white or black, while also
prioritizing visual clarity.
An optional argument bg can be used to define the canvas
background color, which is useful when the colors in y
have partial transparency, and would also partly show
the canvas color.
Two additional arguments to make_color_contrast() may be
relevant: L_lo=40 and L_hi=95, which control the output color
darkness and lightness, respectively.
Adjustments may be passed through venndir() using '...' ellipses
to modify the color saturation, for example: venndir(setlist, L_hi=85).
The argument do_plot=TRUE is used to visualize the input and
output colors for review.
x <- c("red3", "blue", "gold", "pink", "black");
xc1 <- make_color_contrast(x, y="royalblue3", do_plot=TRUE);

xc2 <- make_color_contrast(x, y="#FFF9EE", do_plot=TRUE);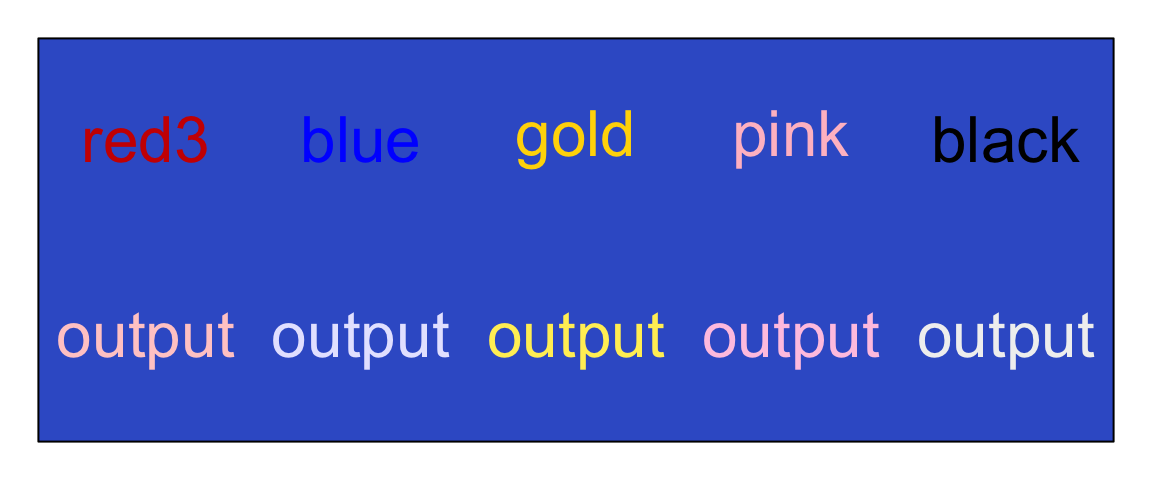
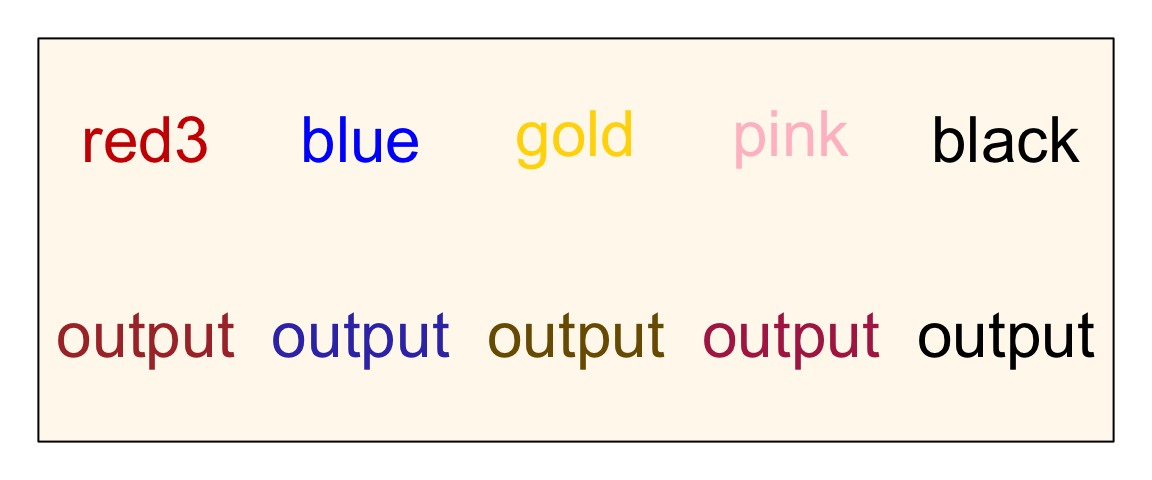
Figure 4.5: Two examples with blue background (top) and off-white background (bottom). In each plot, the top row labels indicate the input colors, the bottom row labels are the output colors adjusted to improve contrast.
Putting these techniques together, the example in
Figure 4.6 uses
modify_venndir_overlap() together with make_color_contrast()
to ensure text labels have visual contrast.
v <- venndir(make_venn_test(do_signed=TRUE), do_plot=FALSE)

new_bg <- "darkgreen";
current_colors <- c("black", "firebrick", "dodgerblue3", "purple4");

v2 <- modify_venndir_overlap(v,
   overlap_set="set_A&set_C",
   params=list(
      label.fill=new_bg,
      label.border="black",
      label.color=make_color_contrast(current_colors, new_bg),
      label.count="outside",
      innerborder=new_bg,
      innerborder.lwd=3)
   )
plot(v2)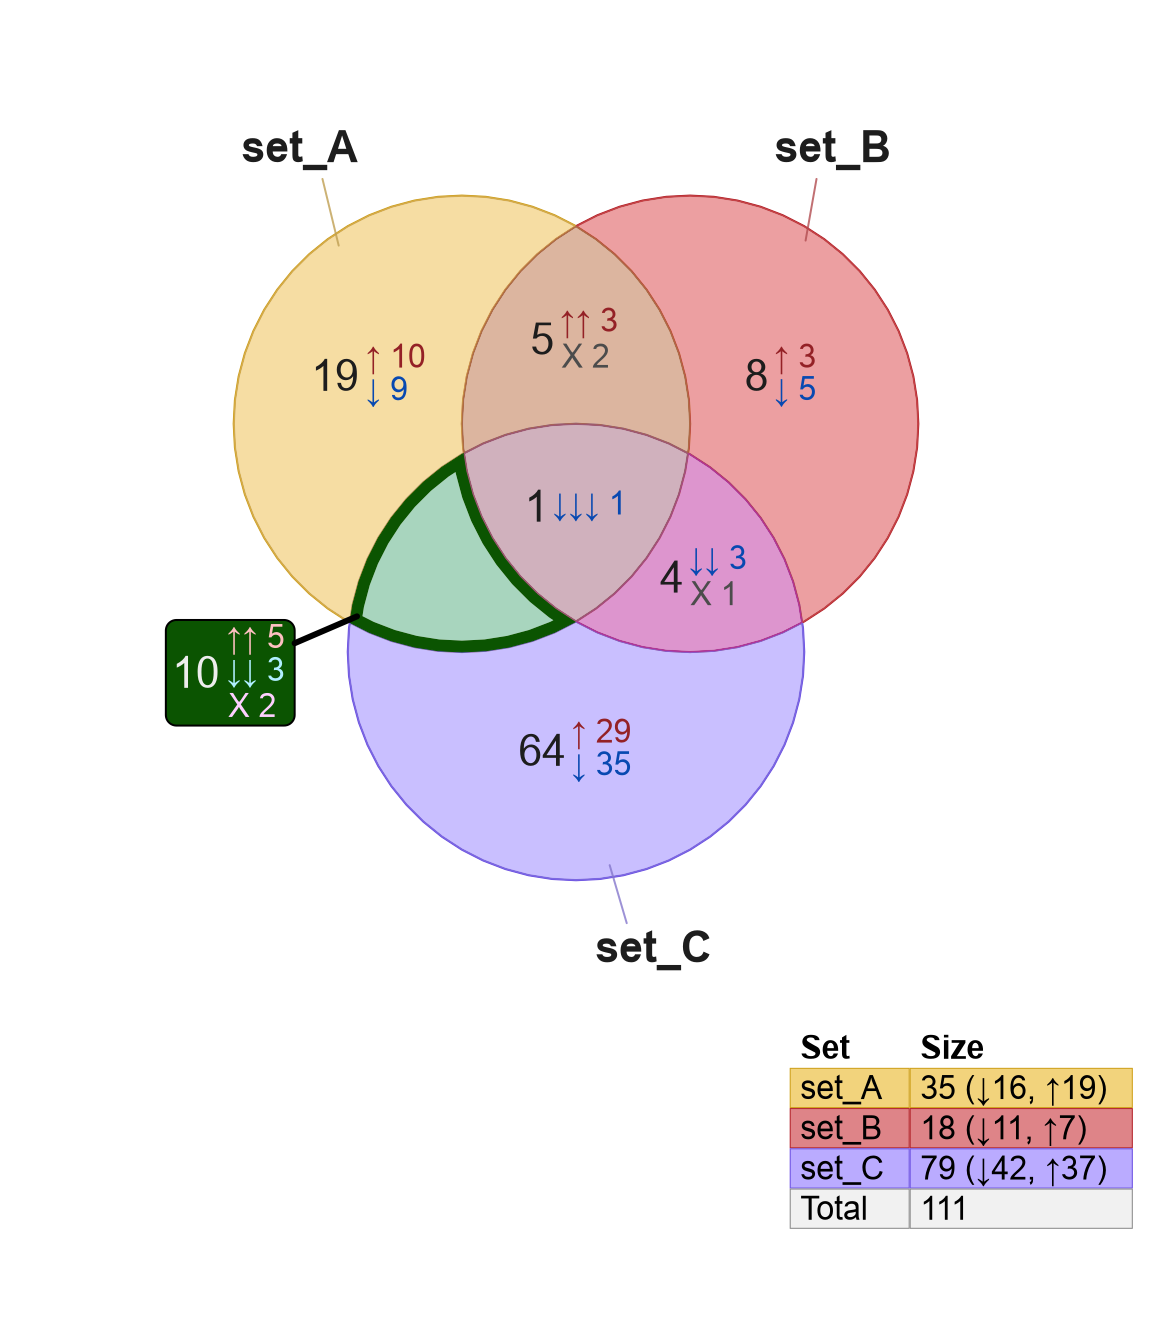
Figure 4.6: Venn diagram with modifications to the label for 'set_A&set_B'.
The modifications made in this figure:
new_bgwas defined as'darkgreen'.new_bgwas applied to thelabel.filland theinnerborder.innerborder.lwdwas increased to3.label.borderwas changed to black, to contrast with dark green.label.countwas set to'outside'to place count labels outside.current_colorswere defined to match the existing label text colors.label.colorwas defined usingmake_color_contrast(), with argumentscurrent_colorsandnew_bg.