3.6 Venn Legends
One of many lessons learned from creating hundreds of Venn diagrams: It is helpful to answer the most common questions upfront. One of the most frequent questions is "How many items are in A?" A straightforward answer can be provided in a table legend.
By default venndir() also calls venndir_legender() which adds a
legend to each figure.
This behavior can be skipped by using draw_legend=FALSE.

Figure 3.37: Default Venn diagram, showing a table legend in the bottom right corner.
The legend is simple, one column 'Set' lists each set name,
and one column 'Size' lists the size of each set.
The background color matches the Venn diagram, and the text
is adjusted light or dark to maximize contrast.
The bottom row also includes 'Total' with the total number of unique items represented by the Venn diagram.
When the Venn diagram displays signed data, the legend will also include signed counts.
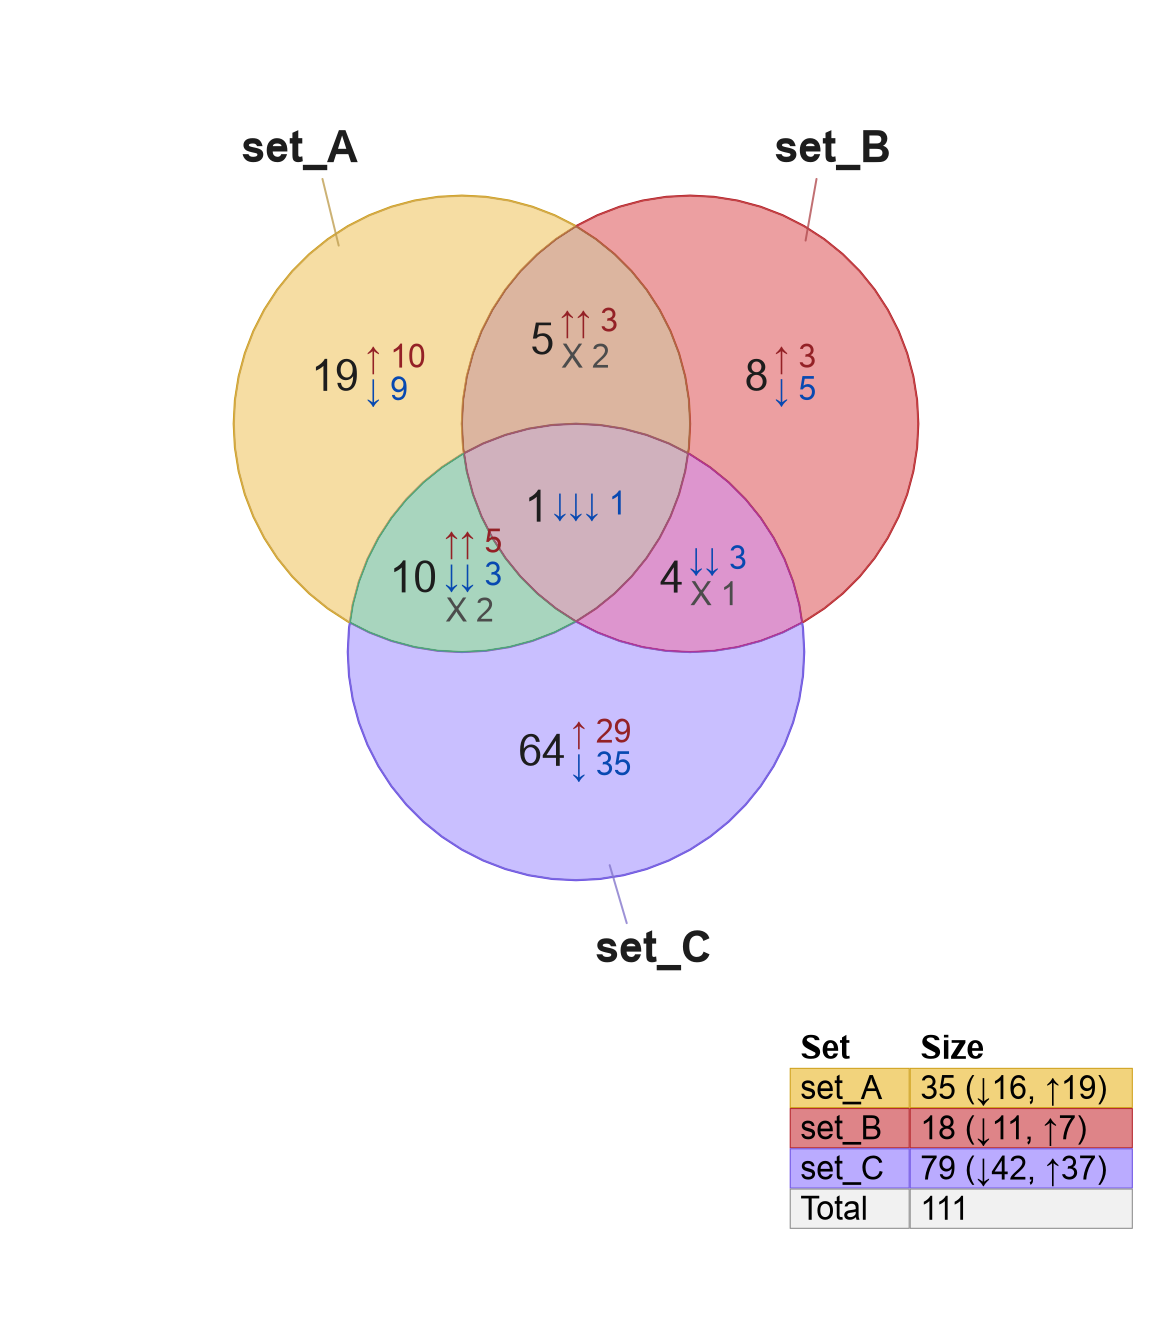
Figure 3.38: Venn diagram showing a table legend in the bottom right corner, this time the column 'Size' also includes counts tabulated by up and down directionality.
Similarly, when the Venn diagram displays percentage values,
a column is added 'Percent'.
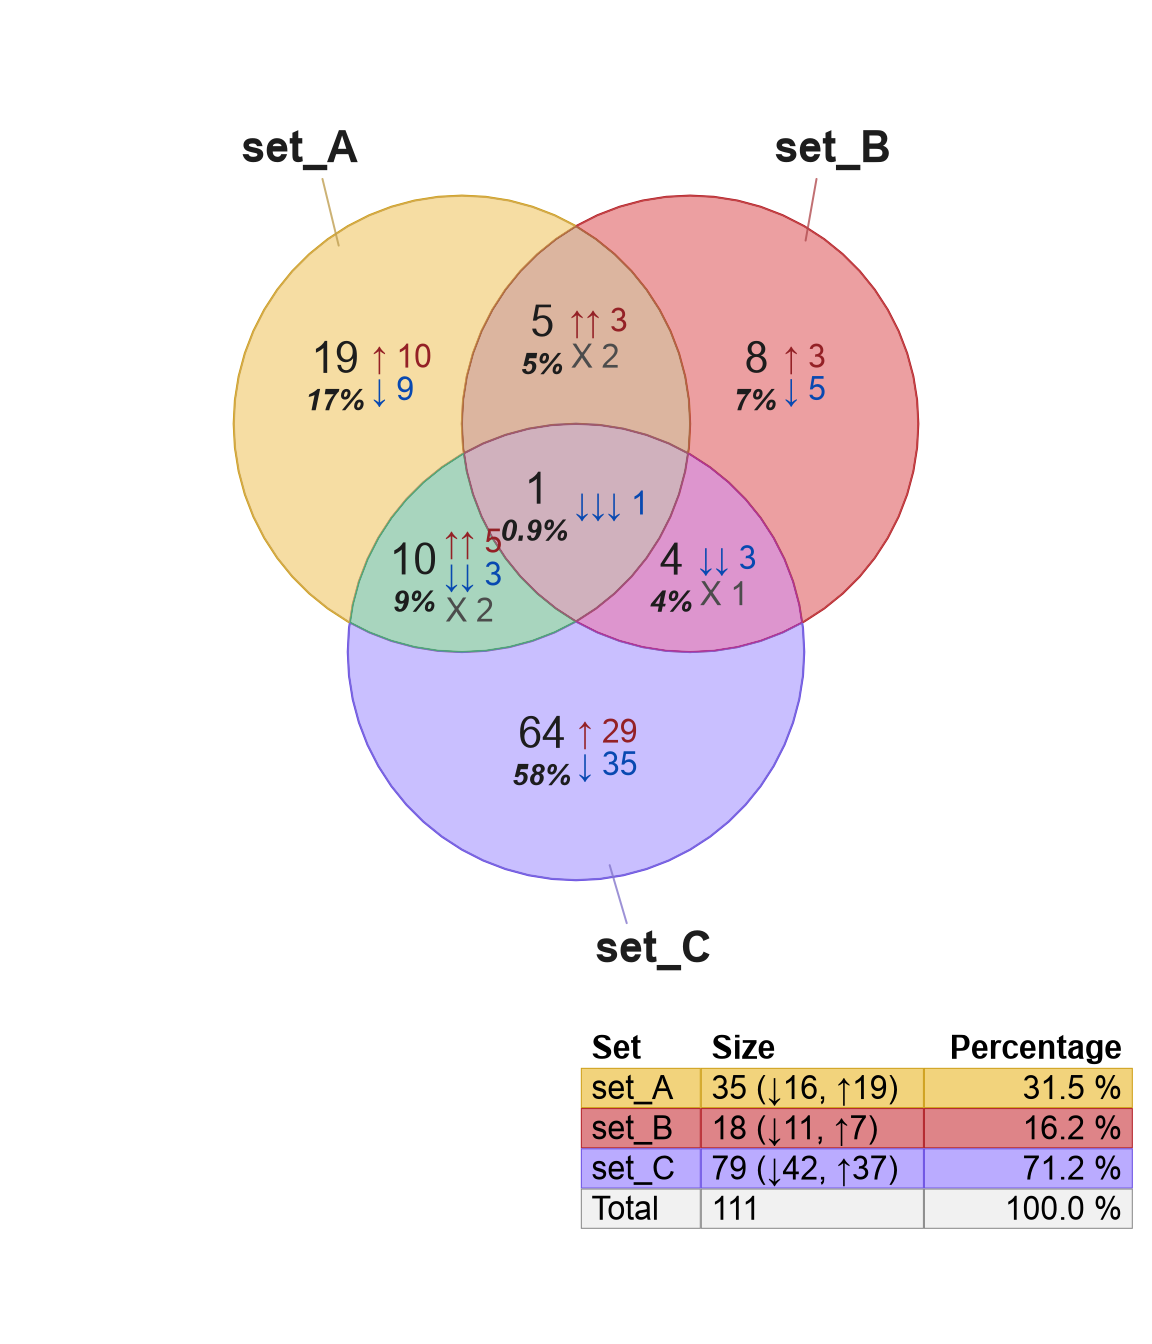
Figure 3.39: Venn diagram showing a table legend in the bottom right corner, now with new column 'Percent' since the Venn diagram also includes the percentage with each count.
3.6.1 Hide percent or signed labels
When percentage or signed labels are displayed in the Venn diagram, the default legend will also include these labels. However, for simplicity it may be preferred to hide these details from the legend, in order to display a cleaner legend. Several optional arguments can be used to hide specific components of the legend.
legend_signed=FALSElegend_percentage=FALSElegend_total=FALSE
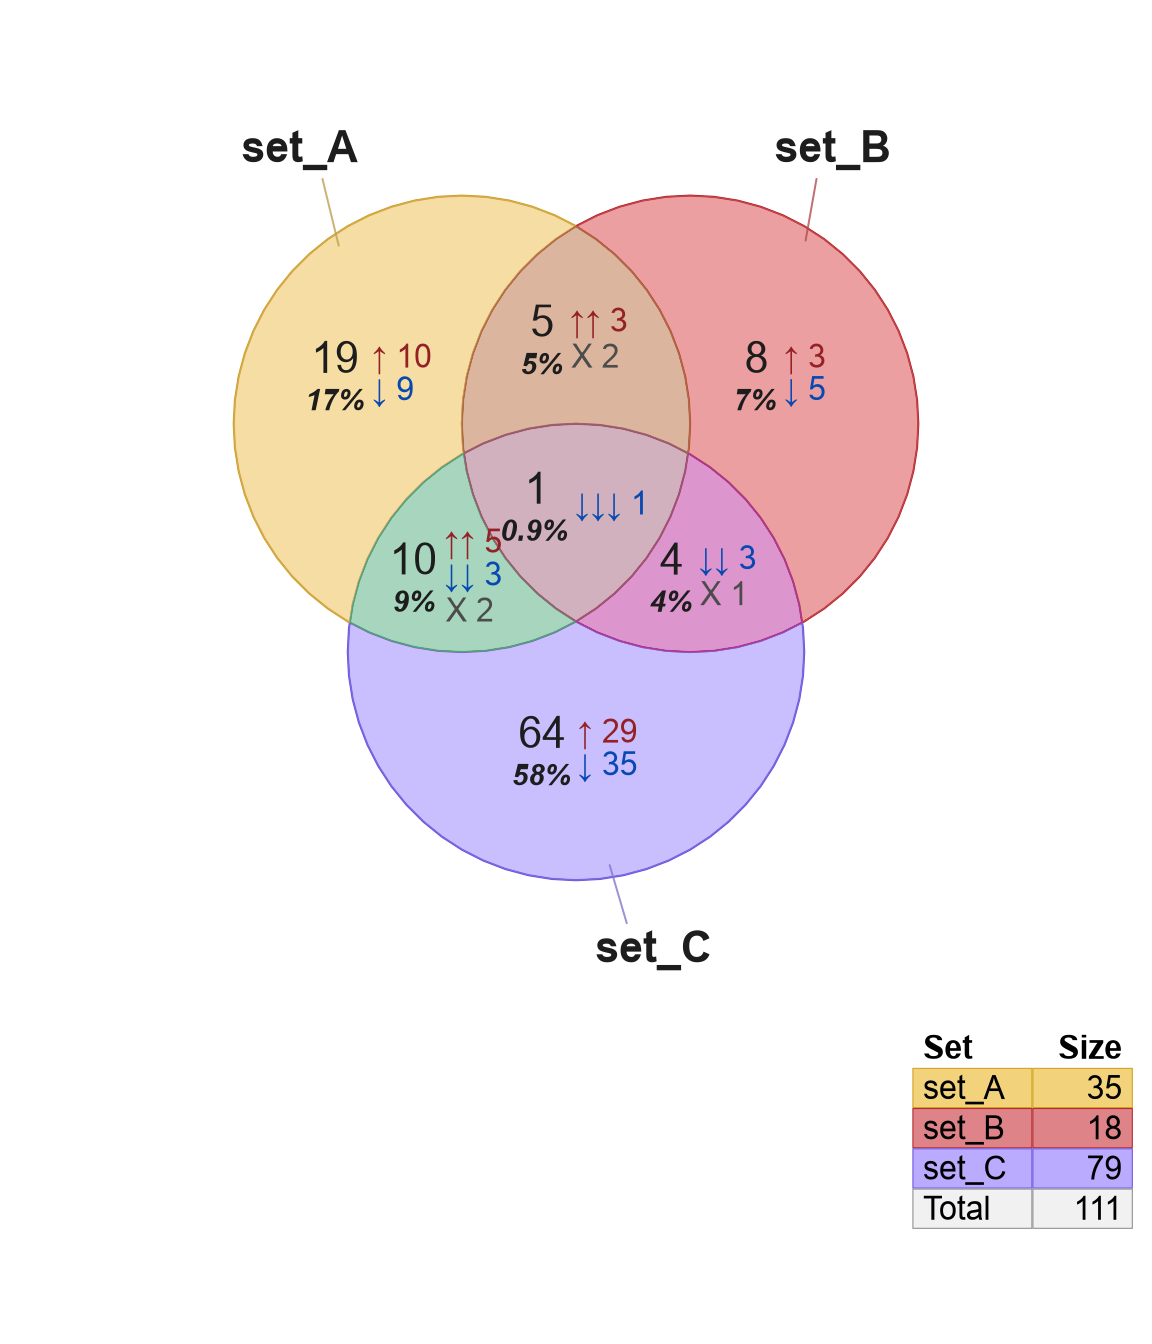
Figure 3.40: Venn diagram showing counts, percentage values, and signed counts. A Venn legend is shown which includes the 'Set' and 'Size' columns, with the 'Percentage' column not shown due to argument 'legend_percentage=FALSE'.
3.6.2 Custom legend labels
The legend labels may be customized in venndir() with the
argument legend_labels. This argument defines the custom label
in the Venndir object so it is used in subsequent plots.
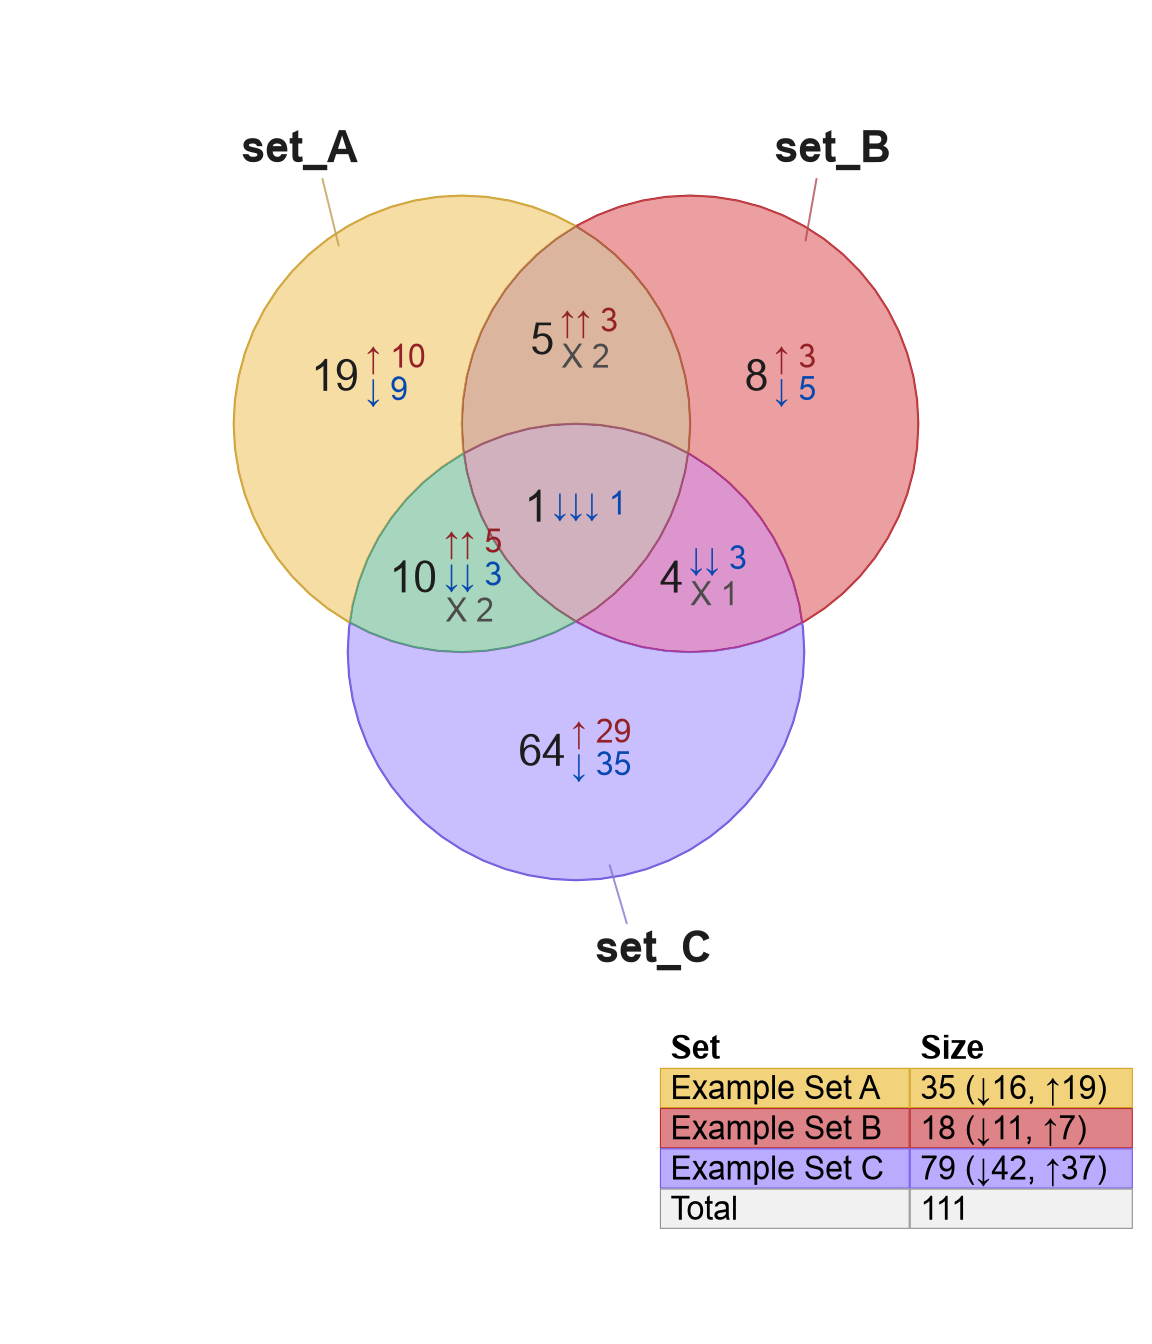
Figure 3.41: Venn diagram showing a table legend in the bottom right corner, with custom labels for each set, for example 'set_A' is renamed 'Example Set A' in the legend.
Note that legend_labels will only customize the labels in the
table legend, and not on the Venn diagram itself.
Sometimes it is necessary to customize the Venn diagram labels,
with the argument setlist_labels.
A common reason to have distinct labels in the figure and legend is to impose line breaks in the figure which are not necessary in the table. At other times, it makes sense to have one detailed label and one simplified label.
v <- venndir(setlist_signed,
   expand_fraction=c(0.2, 0, 0, 0),
   setlist_labels=c("Example\nSet A",
      "Example\nSet B",
      "Example\nSet C"),
   y_inset=grid::unit(1, "lines"),
   legend_labels=c("Example Set A",
      "Example Set B",
      "Example Set C"))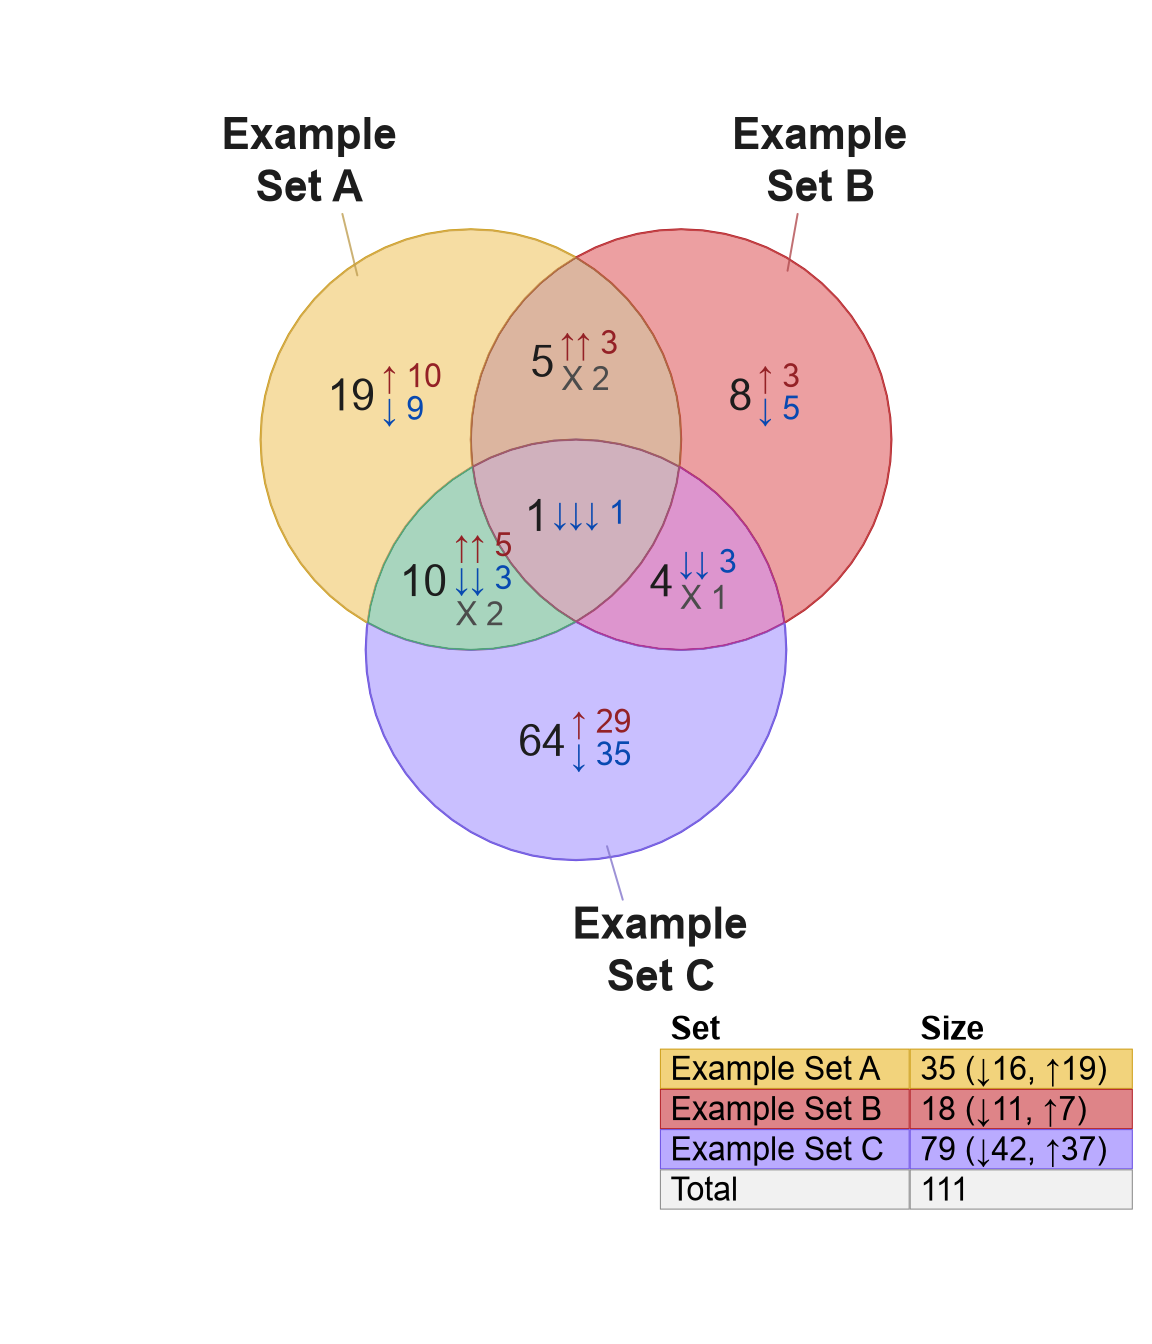
Figure 3.42: Venn diagram showing a table legend in the bottom right corner, with custom labels for each set. 'set_A' is renamed 'Example Set A' in the legend.
3.6.3 Additional alias labels
The argument alias can be used to supply simple labels,
which then pushes legend_labels into a new column 'Label'.
The result may provide a helpful technique to associate extra
details to the Venn diagram labels.
Note that alias must be named using the set names, matching
the values in names(setlist).
v <- venndir(setlist_signed,
   legend_headers=c(Set="Set",
      Size="Size", Percentage="Percentage",
      Sign="Sign", Label="Contrast"),
   alias=c(set_A="A",
      set_B="B",
      set_C="C"),
   setlist_labels=c("Set A",
      "Set B",
      "Set C"),
   legend_labels=c(set_A="Dex - control",
      set_B="PGH - control",
      set_C="E2 - control"))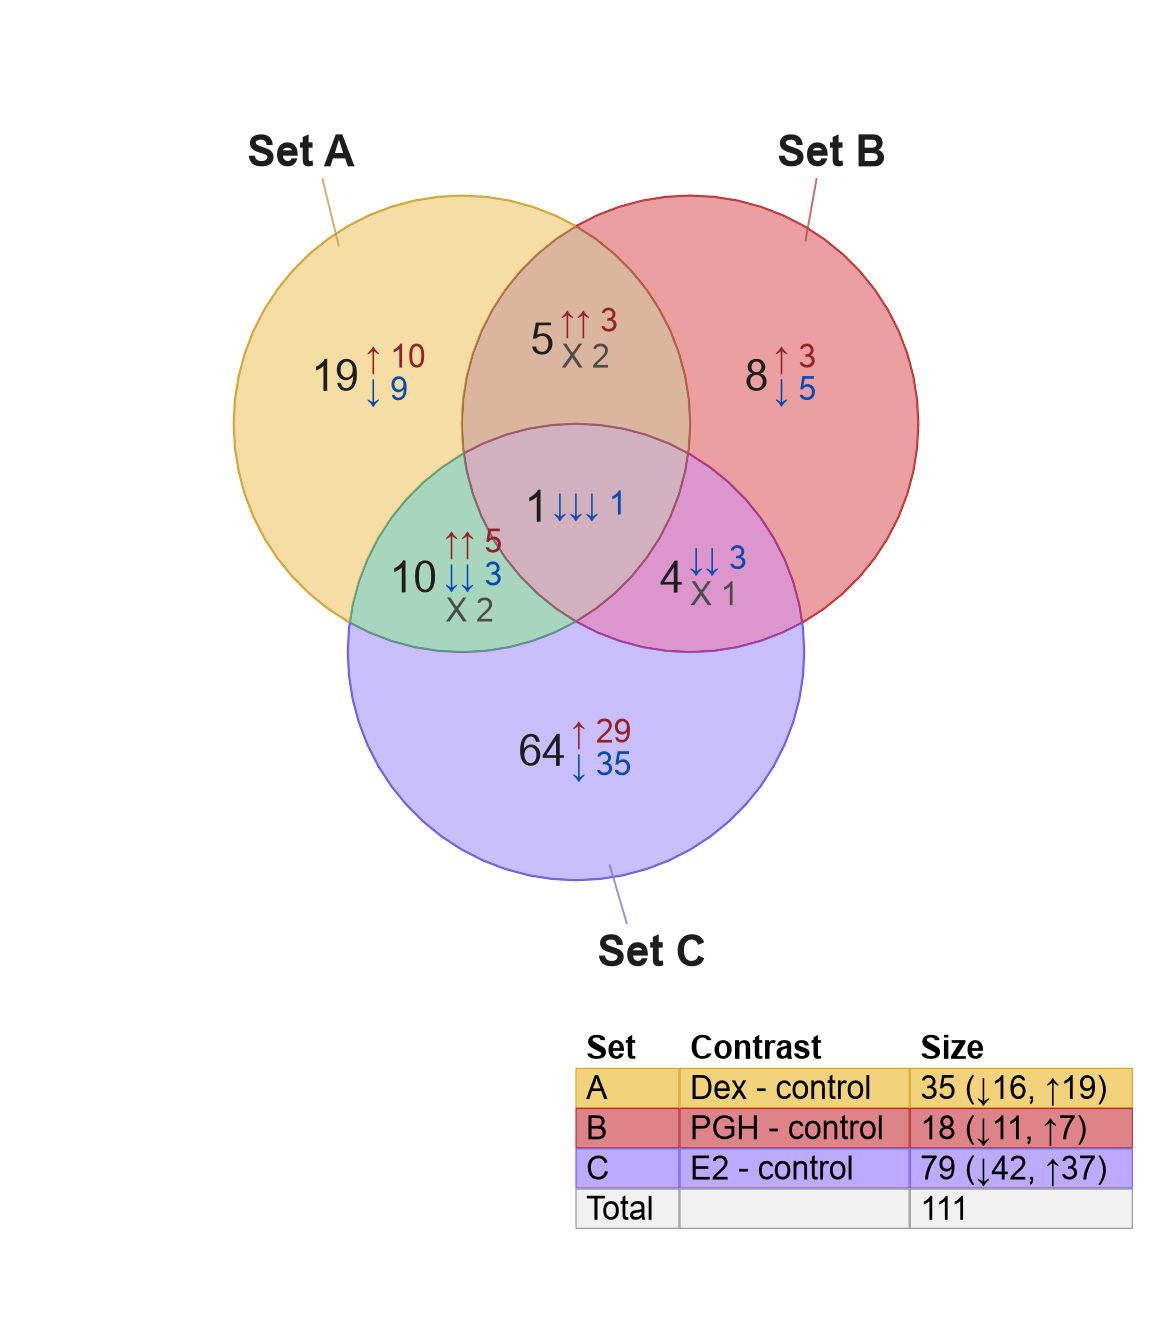
Figure 3.43: Venn diagram showing a table legend in the bottom right corner, with custom labels for each set. 'Set A' in the Venn diagram is indicated 'A' in the legend, with a new column 'Contrast' with descriptive information.
Figure 3.43 also uses the optional argument
legend_headers to define custom headings in the legend,
this adding 'Contrast' as a new header.
3.6.4 Separate Size and Sign
The default legend combines the set size together with signed counts
when the Venndir data contains signed setlist.
In other words,the label \(30 (↓ 16, ↑ 19)\) is displayed
in one field.
Two optional arguments provide alternatives to the default:
combine_size=FALSEThe total size will not be combined with signed counts.
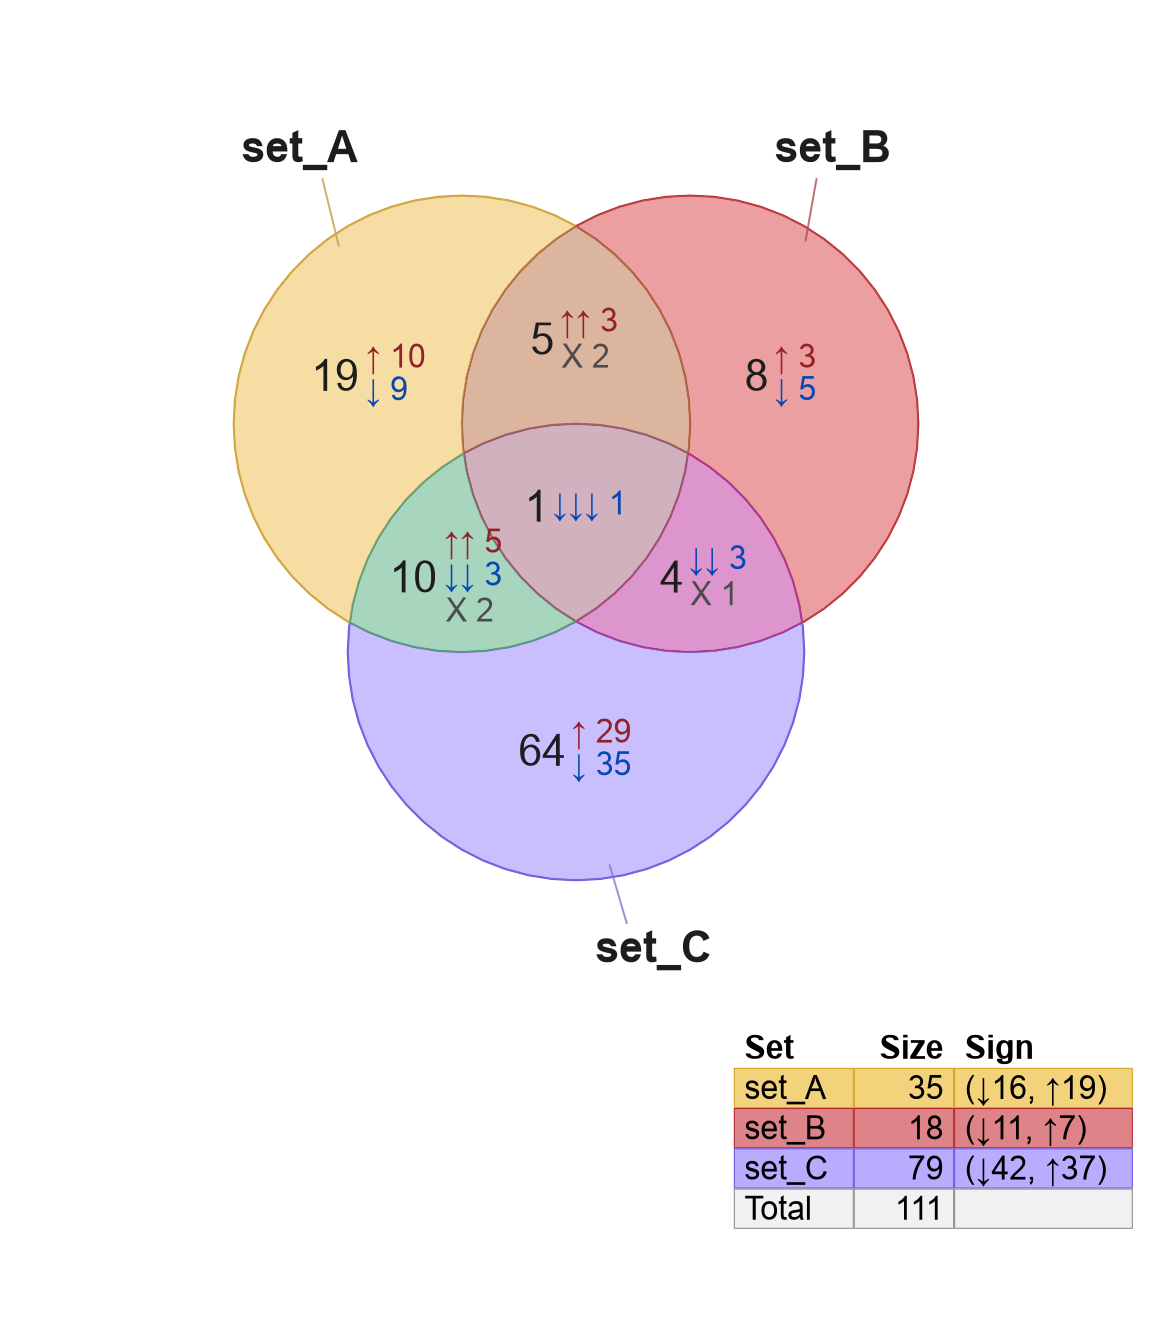
Figure 3.44: Venndir legend with separate columns for 'Size' and 'Sign'.
combine_signed=FALSEThe signed counts will not be combined and displayed in parentheses.
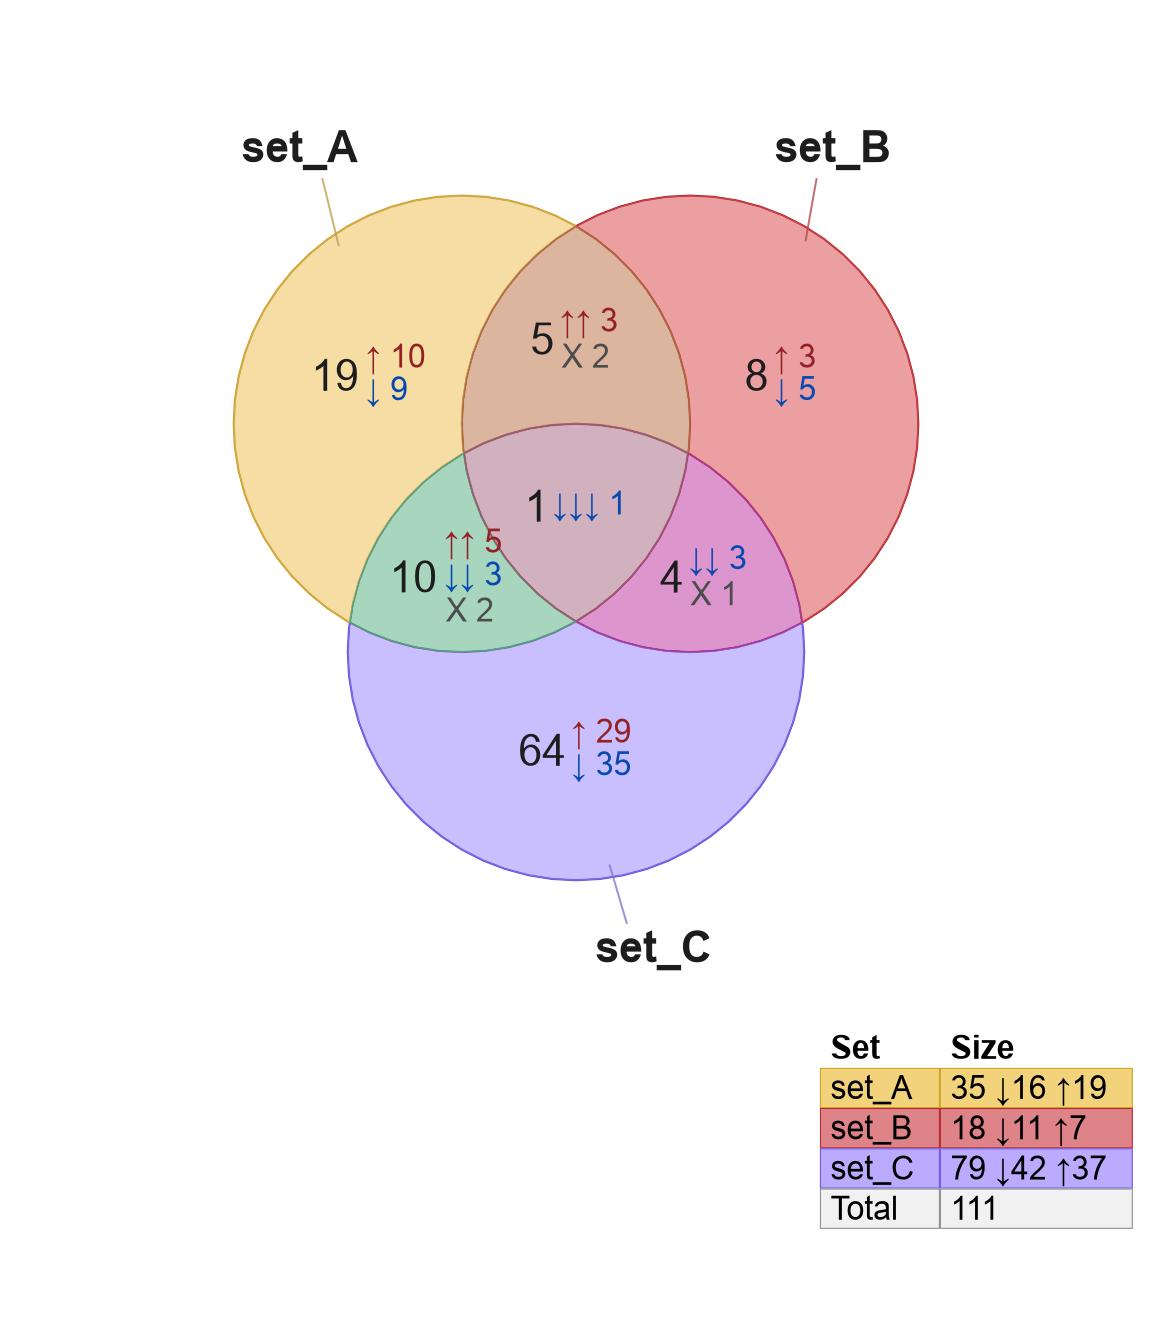
Figure 3.45: Venndir legend with one column 'Size', whose values not delineated by parentheses.
combine_size=FALSE, combine_signed=FALSEThe total size and signed counts will each appear in separate columns.
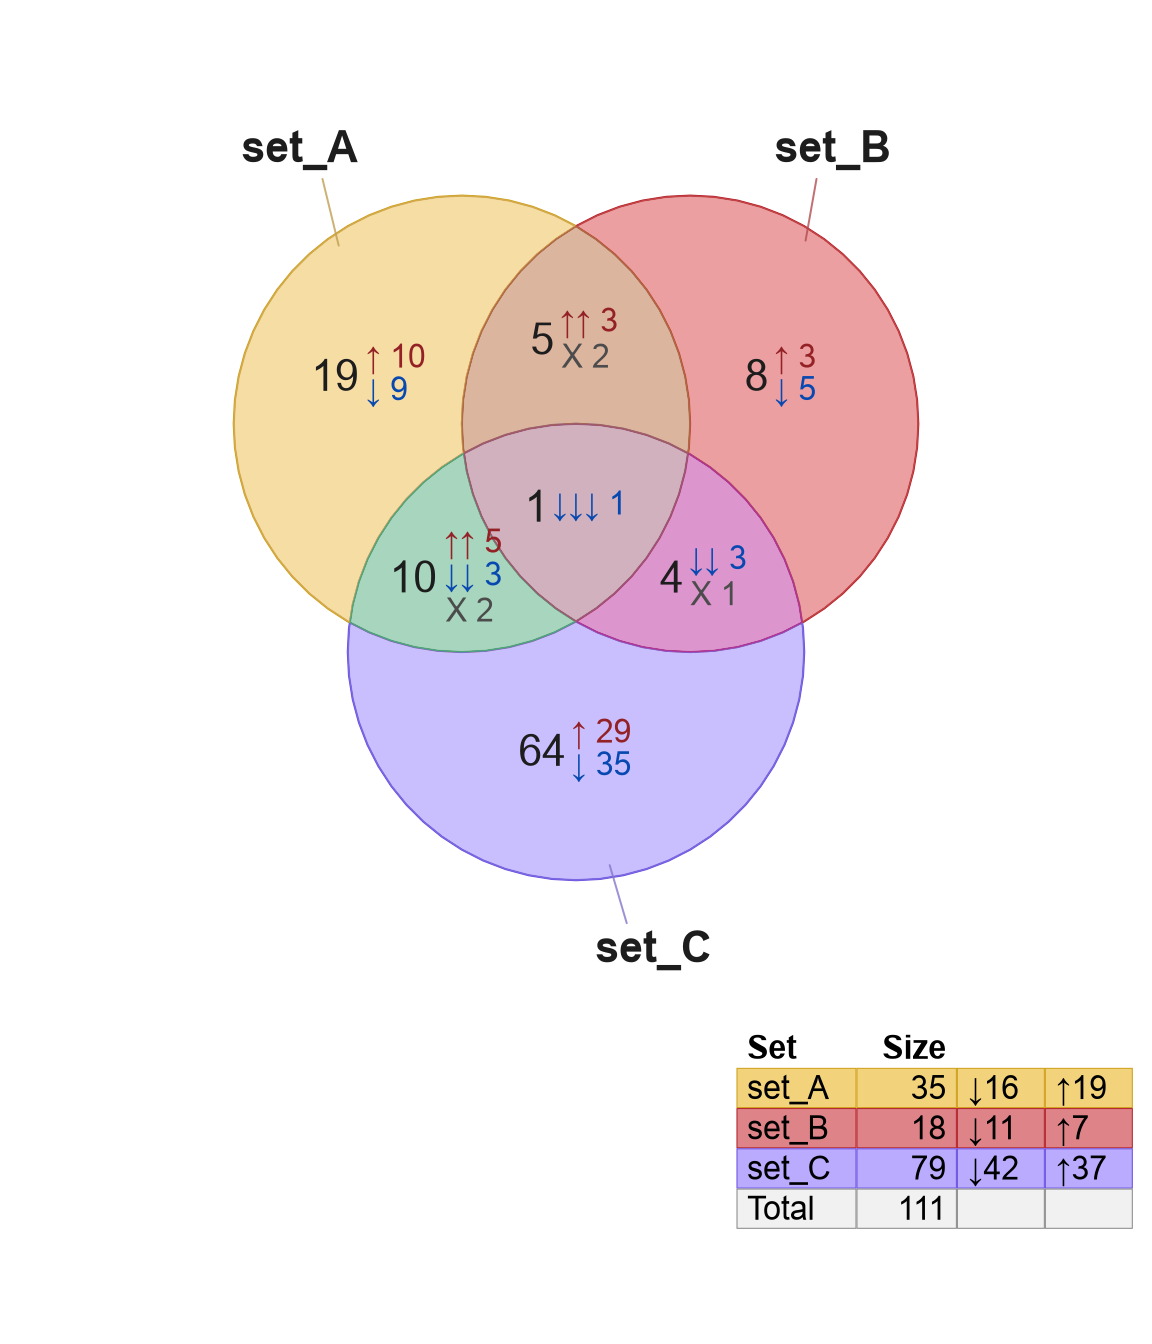
Figure 3.46: Venn diagram with legend that shows separate columns with 'Size', and two additional columns with signed counts which do not have a header label.
3.6.5 Legend color style
The default legend uses the same color fill as the Venn diagram. However, the style can be customized using argument 'legend_color_style' to control both the fill and border colors.
Fill color
"fill"uses the Vennset_colorsafter applyingpoly_alpha"nofill"uses no fill color, inheriting the plot background"greyfill"uses light grey fill color
Border color
"border"uses the Vennset_colorswith no alpha transparency"noborder"uses no border"greyborder"uses medium-dark grey border"blackborder"uses black border
For example, to use no color fill, and black border:
legend_color_style=c("nofill", "blackborder")
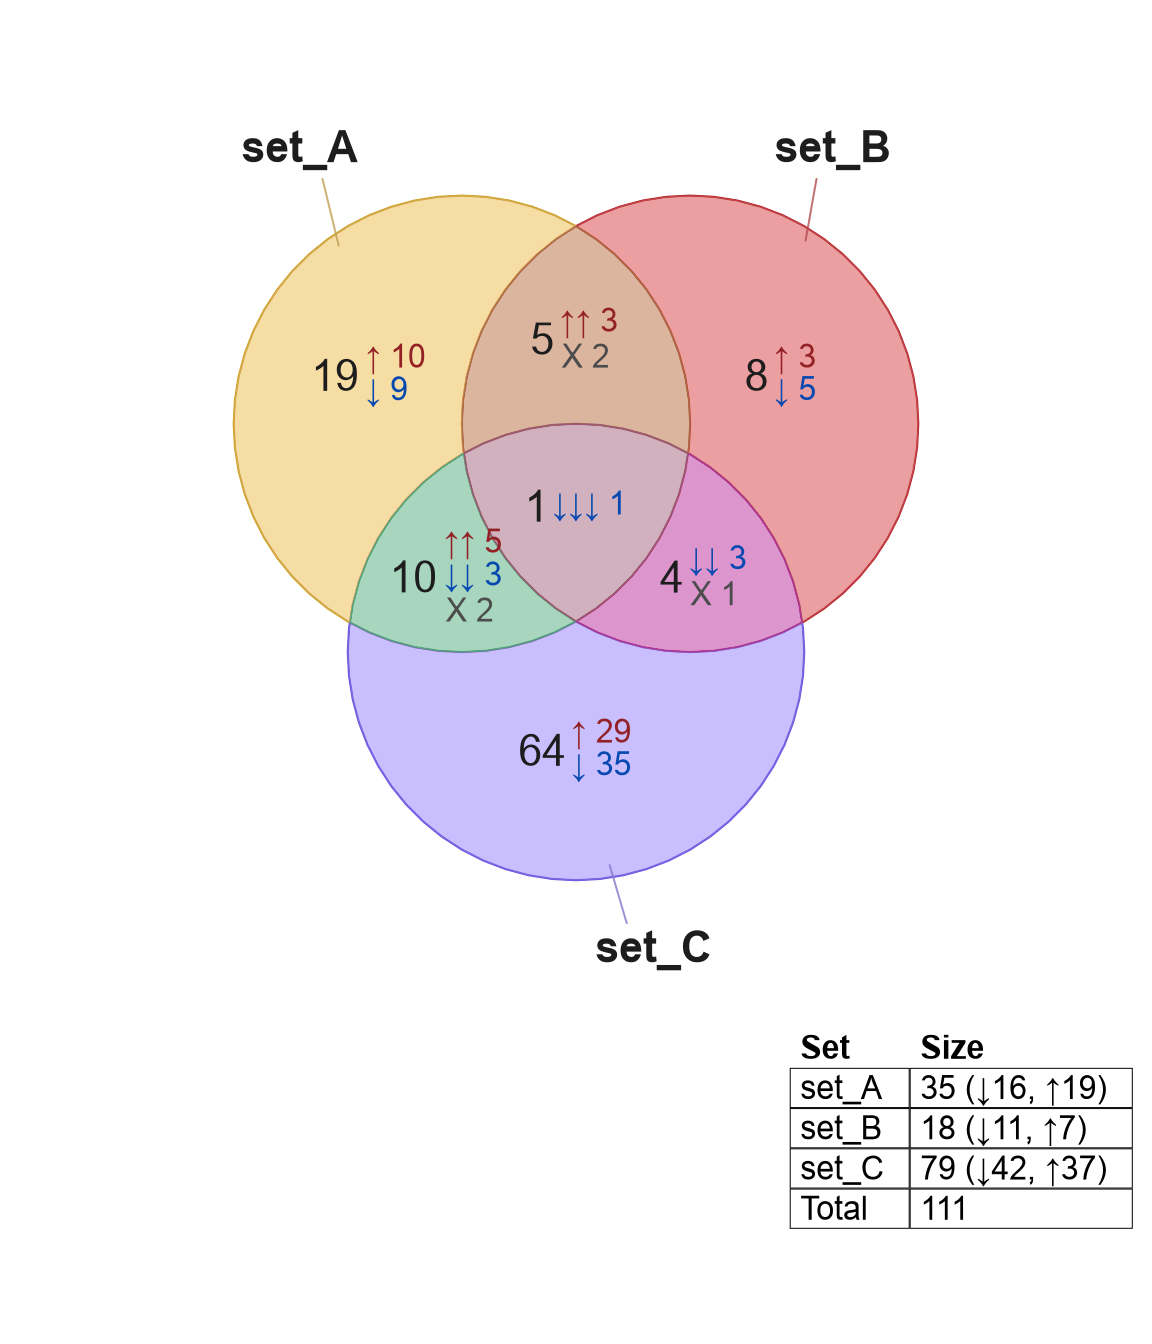
Figure 3.47: Venn diagram with a legend drawn using black border, and no background color.
The header can be customized as well, using arguments:
header_color for the text color, header_bg for background fill,
and header_border for the header border.
3.6.6 Legend position
The legend itself is positioned using argument legend_x when called
by venndir(), or x when called by venndir_legender().
The position recognizes the following character terms:
- x-axis position: 'left', 'center', 'right'
- y-axis position: 'top', 'center', 'bottom'
The default position is "bottomright"
Some fine-tuning is available with two more arguments:
x_inset-grid::unitobject applied when x is 'right' or 'left', intended to apply an inset distance from the edge of the figure. The default isgrid::unit(2, "lines")which moves the legend two character lines from the edge of the figure.y_inset-grid::unitobject applied when x is 'top' or 'bottom', which is applied the same way as described forx_inset. The default is 2 character lines.
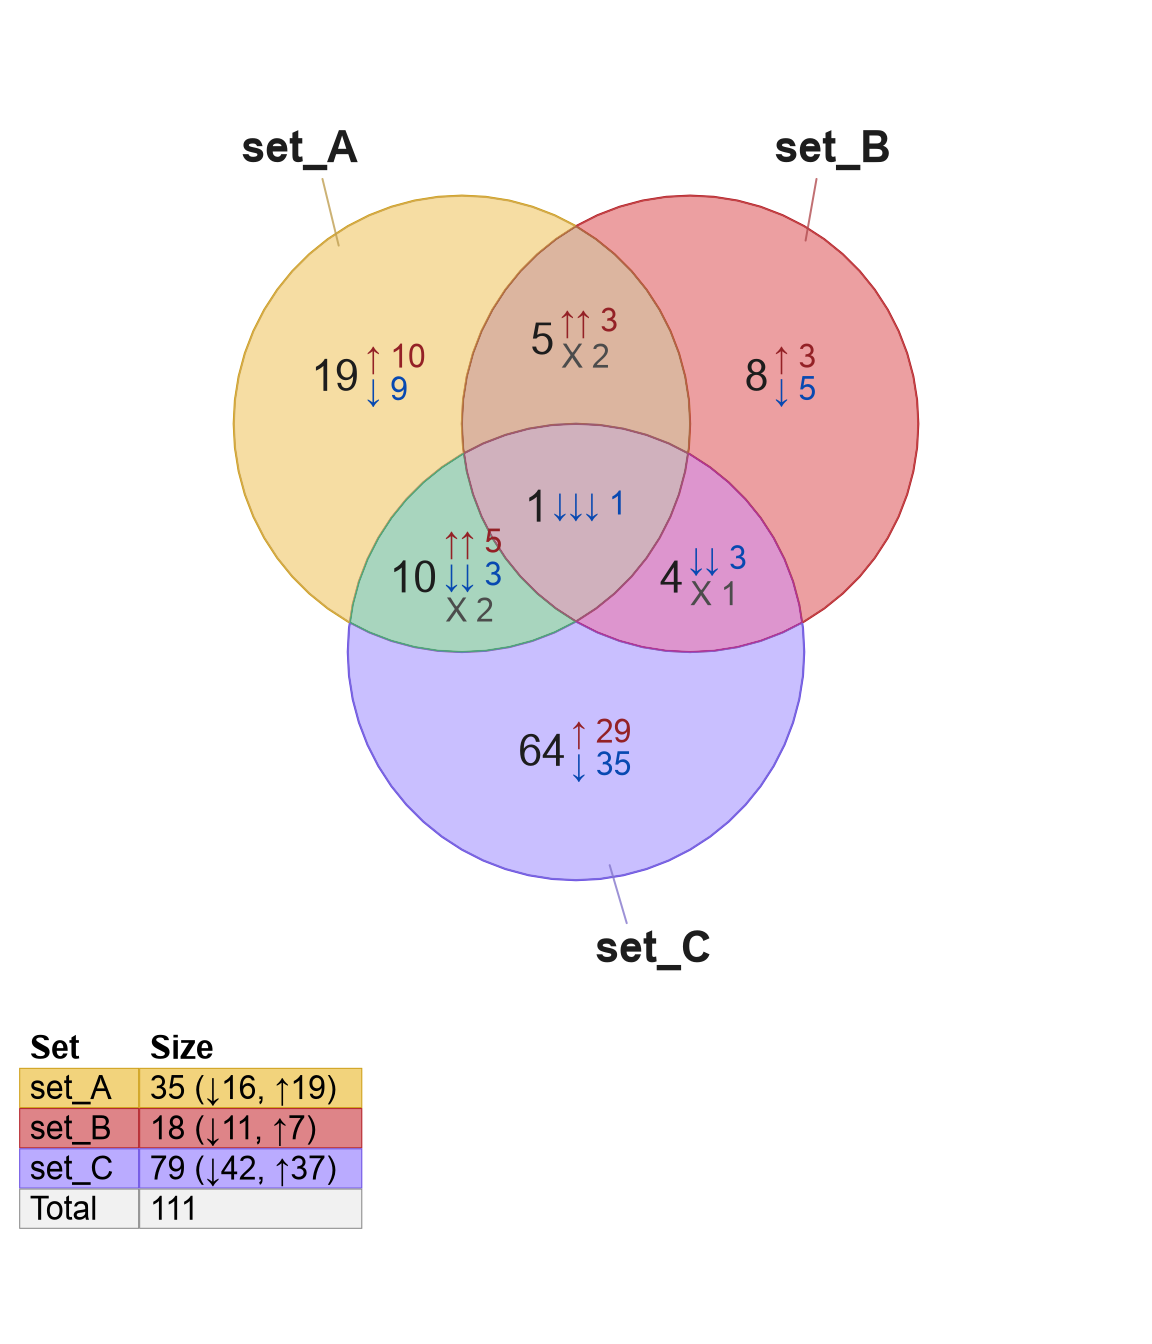
Figure 3.48: Venn diagram showing the legend positioned in the bottom left corner, using argument 'legend_x' inside the venndir() function.
For example, to move the legend closer to the bottom edge,
and closer to the left edge, see the following example.
Note the function grid::grid.rect() is used here to draw
a draw box around the plot region.
v <- venndir(setlist_signed,
   x_inset=grid::unit(0, "lines"),
   y_inset=grid::unit(0, "lines"),
   legend_x=c("bottomleft"))
grid::grid.rect(gp=grid::gpar(fill=NA, lwd=2, col="grey"),
   vp=attr(v, "viewport"))
grid::grid.rect(gp=grid::gpar(fill=NA, col="black"))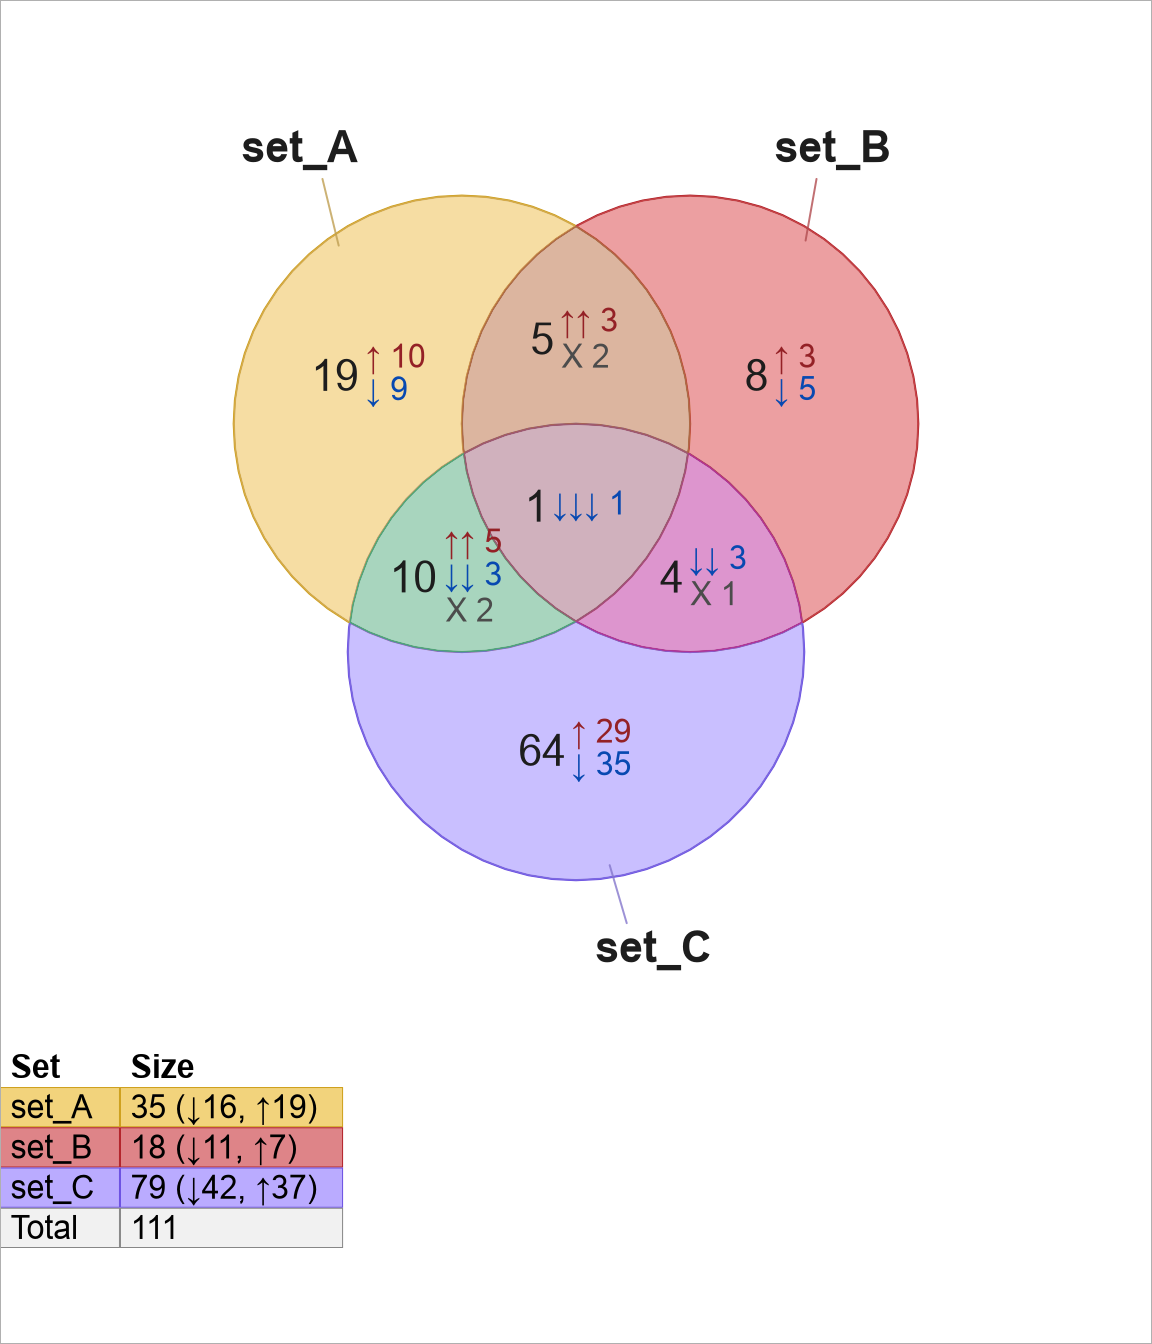
Figure 3.49: Venn diagram with legend in the bottom left corner, adjusted to the bottom edge, and moved more to the left of the figure. The grey box indicates the Venn figure region, the black box indicates the overall figure.
Note the x-axis position is not the exact left
edge of the plot itself.
The legend is drawn within the Venndir grid viewport,
defined with fixed aspect ratio units 'snpc' (see grid::unit()).
As a result the Venndir viewport is roughly square, and if the
graphics device is wider or taller than square, extra
whitespace is imposed. The argument x_inset accepts
negative values that can position the legend further left
when necessary.
An alternative is to call venndir() with draw_legend=FALSE,
then separately call venndir_legender() to create the legend.
This process draws the legend in the overall viewport.
In Figure 3.50, the legend is positioned on the
exact bottom-left edge of the plot, shown by the grey line
drawn with grid::grid.rect().
v <- venndir(setlist_signed,
   draw_legend=FALSE)
grid::grid.rect(gp=grid::gpar(fill=NA, lwd=2, col="grey"),
   vp=attr(v, "viewport"))
grid::grid.rect(gp=grid::gpar(fill=NA, col="black"))
vl <- venndir_legender(v,
   x_inset=grid::unit(0, "lines"),
   y_inset=grid::unit(0, "lines"),
   x=c("bottomleft"))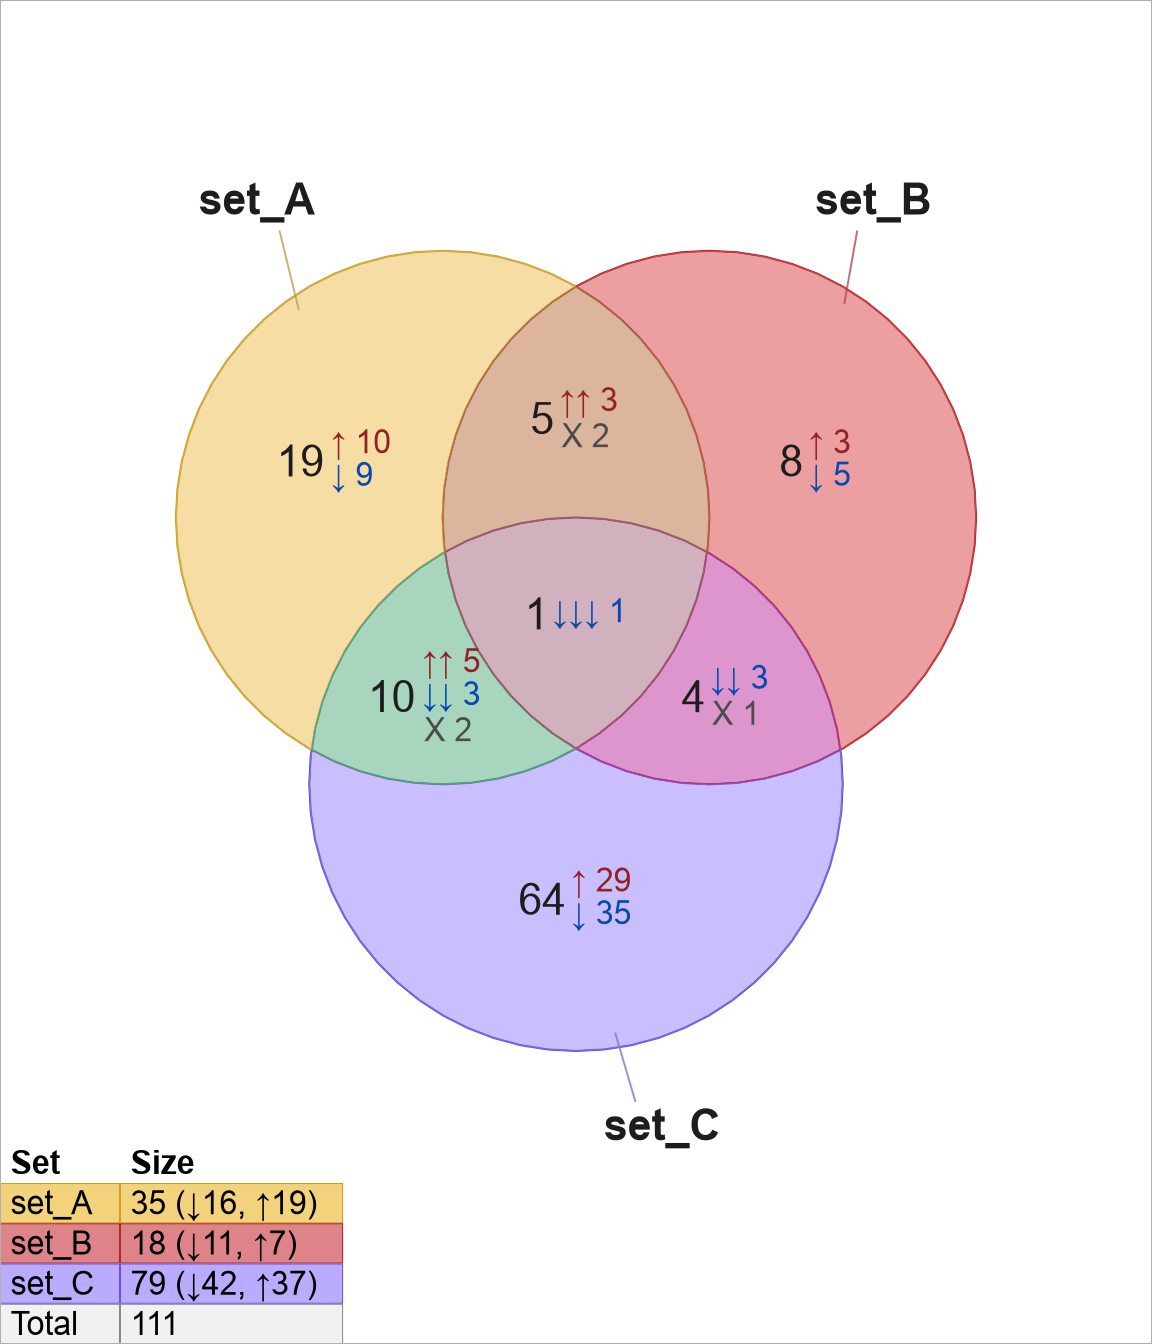
Figure 3.50: Venn diagram with legend in the bottom left corner, this time with the legend touching the exact bottom left edge of the overall figure. The grey box indicates the Venn figure region, the black box indicates the overall figure.
Altogether, the use of venndir() with argument expand_fraction
should provide detailed control over the position of the Venndir
diagram. When necessary, the legend can be drawn separately
with venndir_legender() to afford exact control over the
position of the legend.
In future the plot method used for Venndir may be updated to use 'npc' coordinates instead of 'snpc', which may enable the legend to be freely positioned in the encompassing viewport, not the Venndir viewport. For now, this update is lower on the Todo list.
3.6.7 Legend font size
The legend font size can be adjusted with legend_font_cex when called
by venndir(), otherwise it uses font_cex when called using
venndir_legender().
v <- venndir(setlist_signed,
   legend_font_cex=1.3,
   x_inset=grid::unit(-3, "lines"),
   y_inset=grid::unit(0, "lines"),
   legend_x=c("bottomleft"))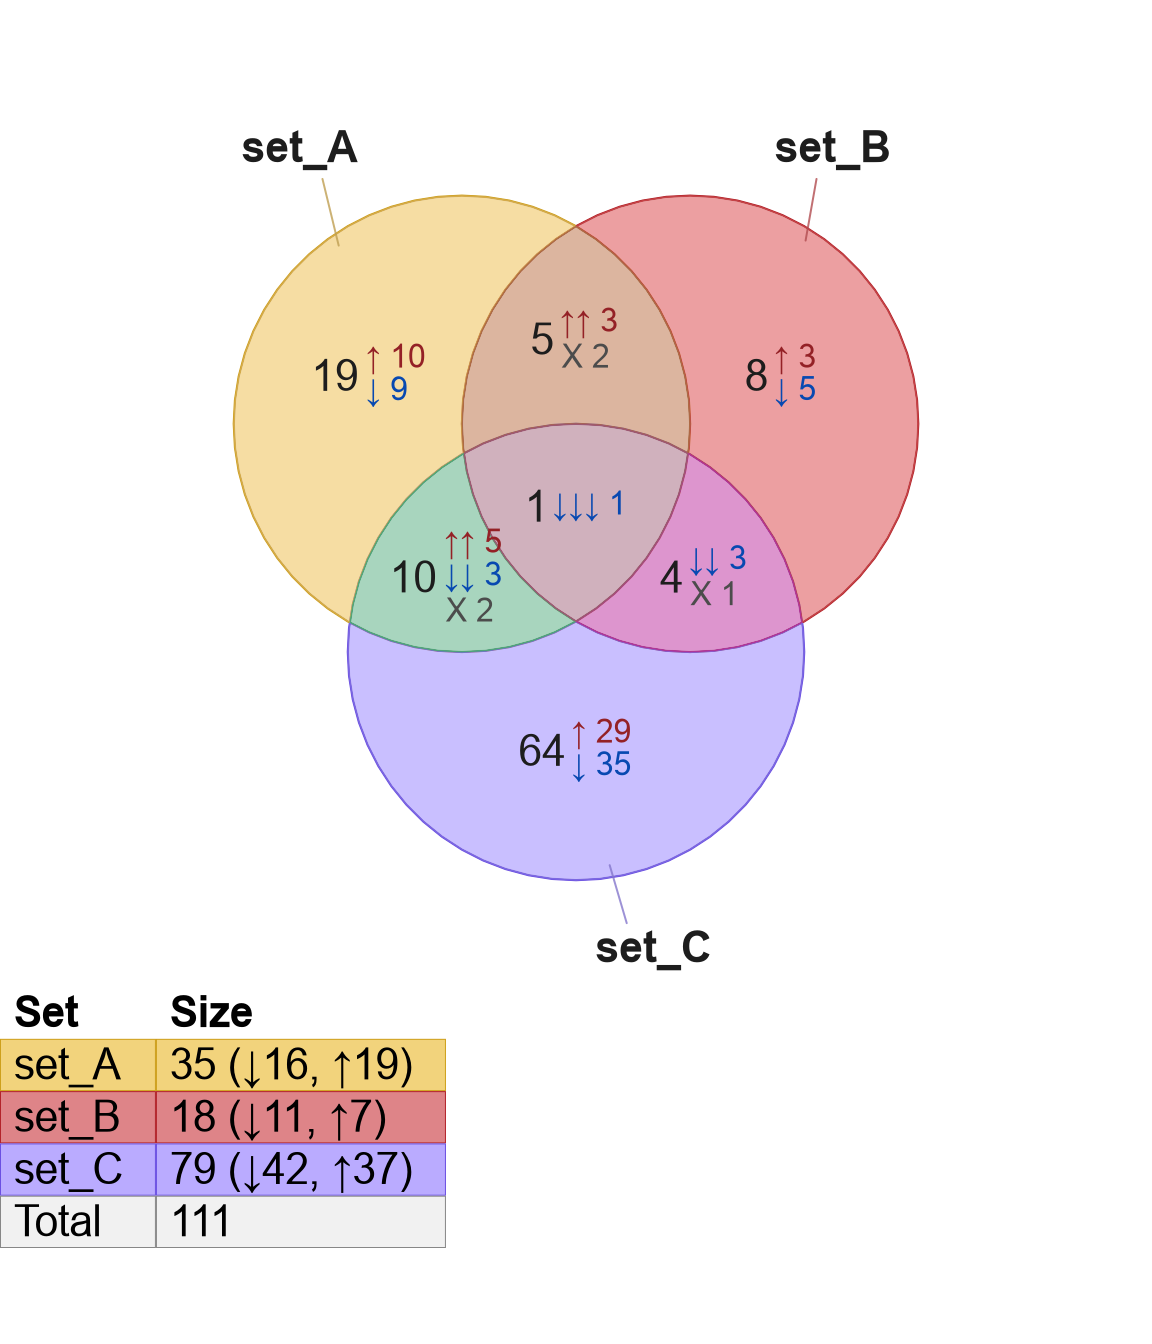
Figure 3.51: Venn diagram with legend drawn in the bottom left corner, using font size adjusted to 1.3 times the default font size with argument 'font_cex'.
3.6.8 Legend custom fontfamily
The legend fontfamily will use the fontfamily defined
in the Venndir object (for example v@metadata$fontfamily).
For most cases, supplying a custom fontfamily to venndir()
will suffice, since it will apply the same custom font to the figure
and to the legend.
It is possible to use a custom font specifically for the legend.
This process requires calling venndir_legender() independently,
therefore the legend should not be drawn by venndir().
The steps are described and demonstrated below:
- Call
venndir()withdraw_legend=FALSE, assign output to a variable, in this casev. - Call
venndir_legender()using theVenndirobjectvand customfontfamily.
v <- venndir(setlist_signed,
   fontfamily="sans",
   draw_legend=FALSE)
vl <- venndir_legender(v,
   x="bottomright",
   x_inset=grid::unit(0, "lines"),
   y_inset=grid::unit(0, "lines"),
   font_cex=1.3,
   fontfamily="serif")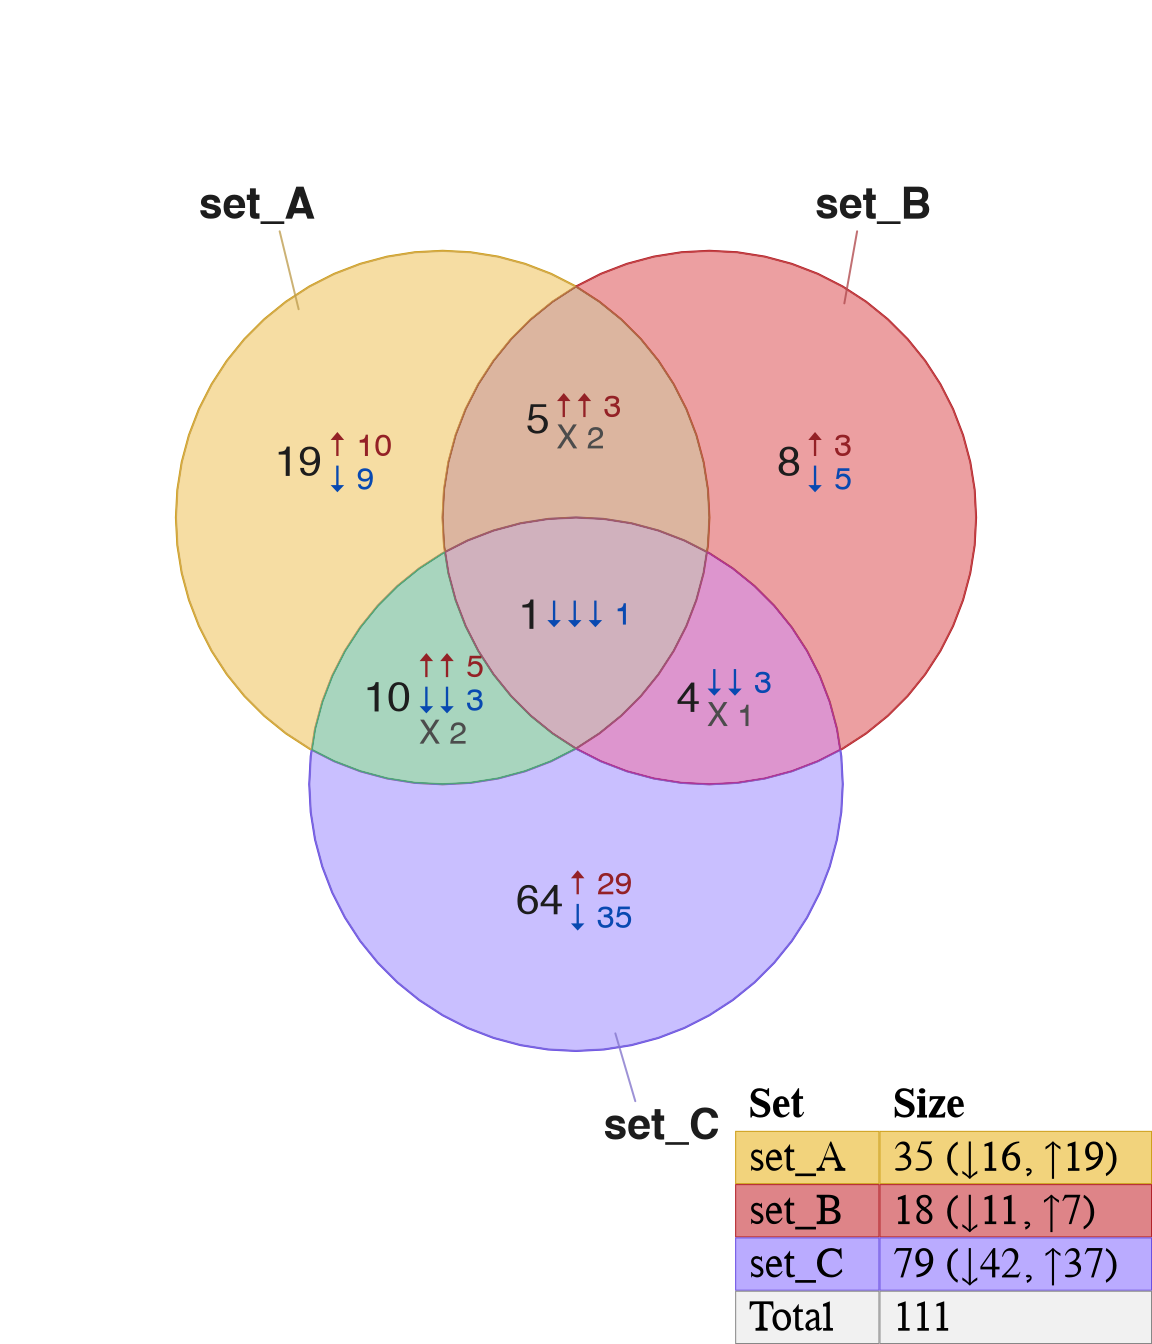
Figure 3.52: Venn diagram with legend drawn in the bottom right, using sans font for the Venn diagram labels, and serif font for the legend.