1.1 Problem Statement
"What problem are you trying to solve?" -- Lazar Arulnayagam
When comparing biological effects on genes in two experiments, two important questions arise:
- Are the affected genes shared?
- Are the changes in direction concordant?
A standard Venn diagram can address shared gene membership, but without directionality they fall short of answering question 2.
Venndir proposes a simple yet powerful extension to Venn diagrams: placing signed counts beside the main counts. The signed counts summarize directionality, indicating whether directions of change were up or down. Direction is indicated using arrows and color cues, red for changes up, and blue for changes down.
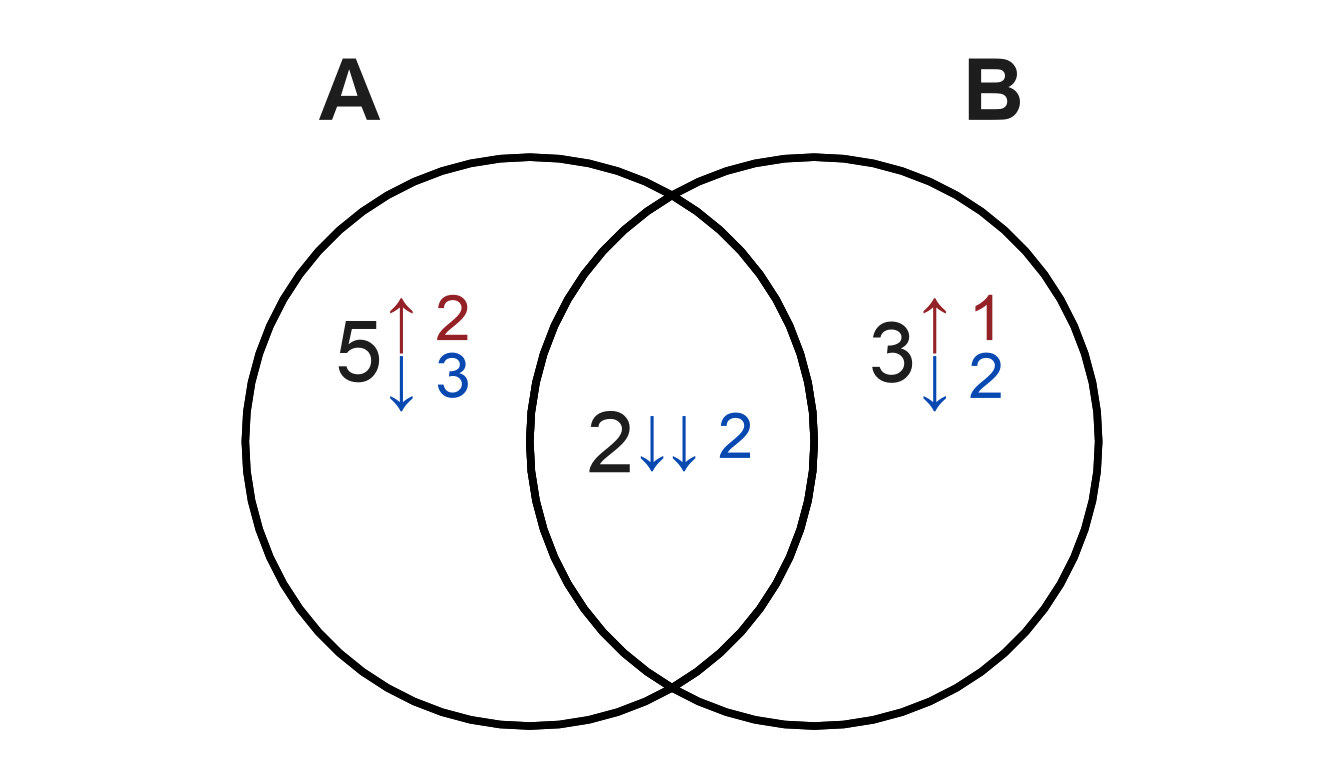
Figure 1.2: Venndir introduces an extension to a Venn diagram, with addition of directional counts beside each Venn overlap count. The direction is indicated by arrows up and down, and colors red and blue, respectively.
For the simple example shown in Figure 1.2, the numbers are described as follows:
There are 4 items in 'A' and 'not B'.
- 2 of these items are UP.
- 2 of these items are DOWN.
There are 4 items in 'B' and 'not A'.
- All 4 of these items are DOWN.
There is 1 item shared by 'A' and 'B'.
- This 1 item is UP.
Venndir also strives to answer the very next question:
"What are those items?"
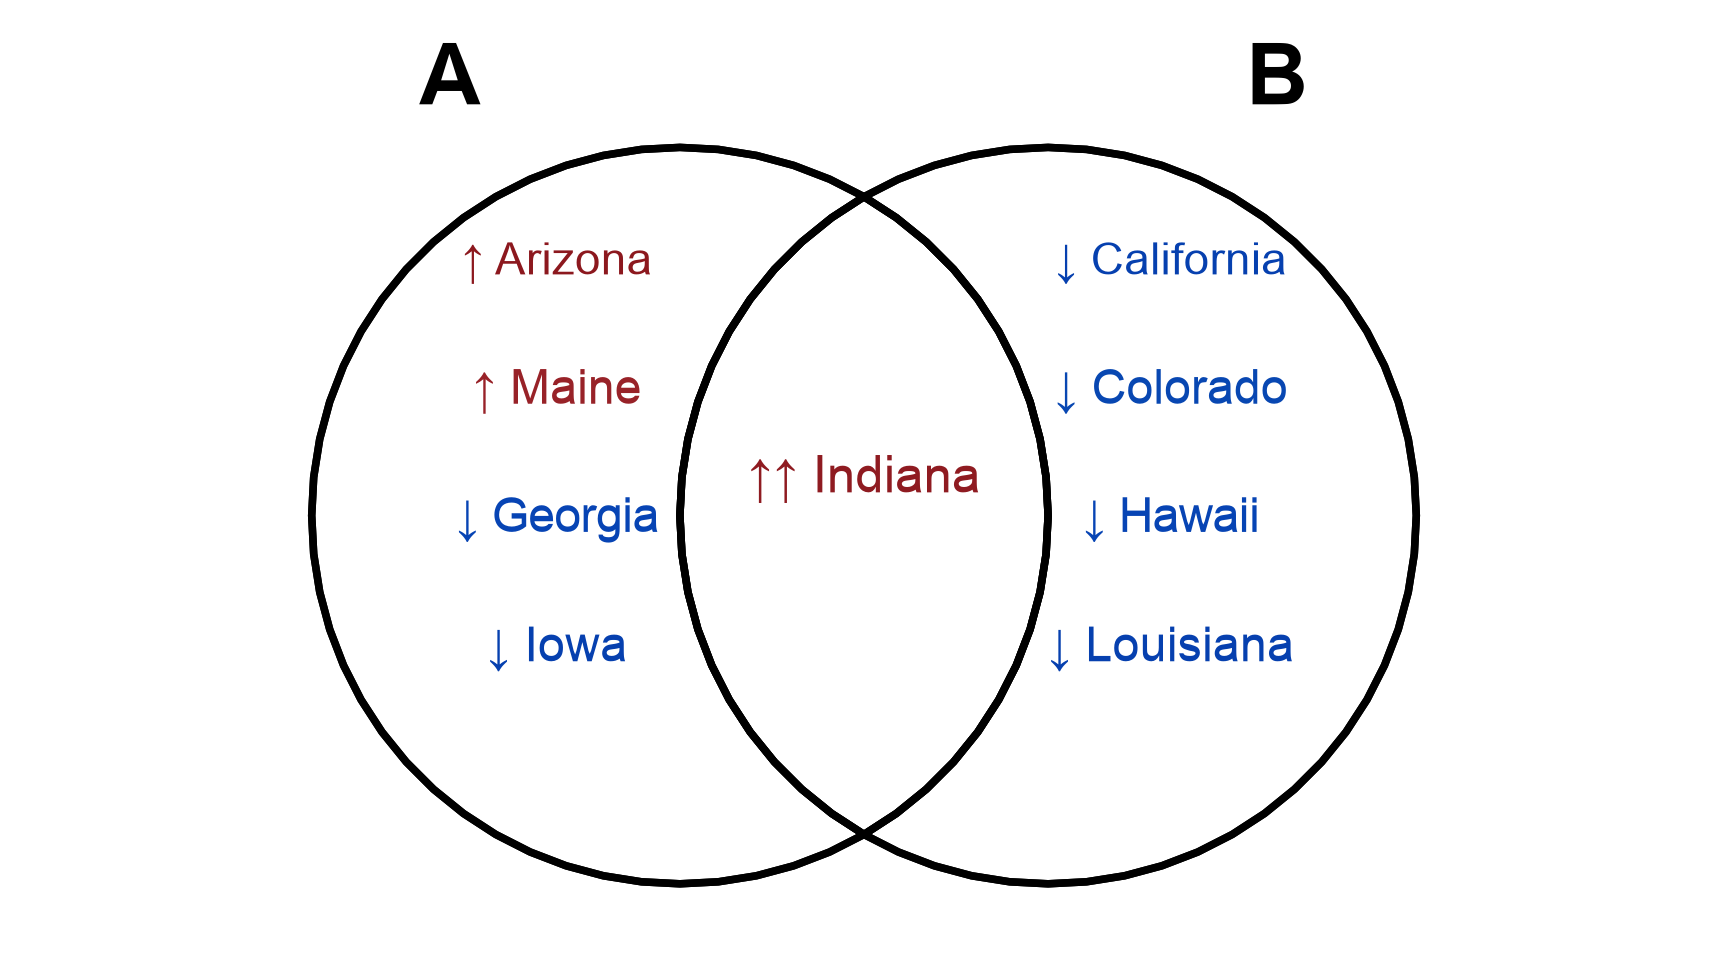
Figure 1.3: Venndir displays the items inside the diagram.