5.2 Venndir Case Studies
While many stylistic techniques were described earlier in the text, putting them together in an artistic way is not always straightforward.
The following case studies serve two purposes:
- Illustrate some stylistic options while showing the associated techniques.
- Demonstrate the utility of directional Venn diagrams.
In both cases, it often works best to use real world data.
5.2.1 Seehawer Kmt2 Gene Venns
Context
Many genomics studies compare results across experimental conditions using Venn or Euler diagrams—for instance, to identify genes affected by a perturbation such as a treatment, toxin exposure, or disease onset. These studies often aim to uncover the genetic basis of a perturbation, in hopes of revealing ways to mitigate or prevent its effects.
There are thousands of studies that identify "genes affected", and many of them have associated direction of change. For example, "up" may be recognized as "up-regulated" or "increased function", and "down" may be recognized as "down-regulated" or "decreased function."
When two studies are compared, they often focus on the genes involved without regard to the direction of change. A common alternative is to compare only the concordant gene changes: For example, comparing up-regulated genes in two studies, and separately comparing down-regulated genes in two studies.
The underlying question is that the genes in each set represent the biological mechanism involved in the study, and that shared genes may therefore represent shared biology.
If the genes represent the process, surely the direction of change represents the effect on the process? Venndir proposes the important distinction that the concordance of direction represents whether the underlying process is also affected in the same way.
Direction is important in science and medicine, where it often means the difference between disease and treatment.
- Overlap alone is not enough.
- Directionality matters.
To date, no Venn software tool indicates overlap and directionality together.
Example Data
A scientific paper by Seehawer et al (Seehawer et al. 2024) studied brain cancer metastasis, the migration property of cancer cells associated with poor clinical prognosis.
They studied the effect of losing either of two genes, Kmt2c and Kmt2d, and they included two very different cell types: "168FARN" and "67NR".
Figure 5.7 shows the target figure. Each Venn diagram compares the genes affected in two cell types: "168FARN" and "67NR".
- The left panels focus on Kmt2c, the right panels focus on Kmt2d.
- The top panels compare only up-regulated genes, the bottom panels compare only down-regulated genes.
The authors concluded that the two cell lines indicated a shared genetic mechanism, even in very different cell types, due to the concordant gene changes shown in each Venn diagram. However, these figures did not indicate discordant changes.
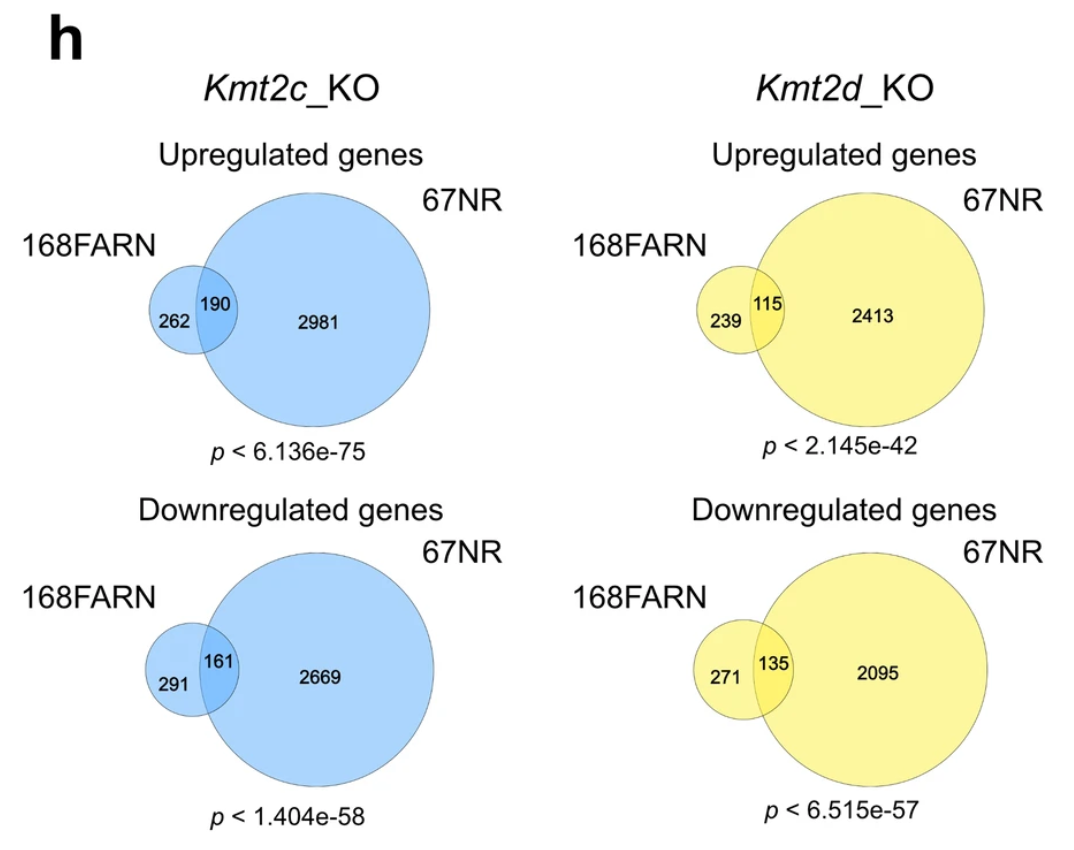
Figure 5.7: Target Extended Figure 4h from Seehawer et al 2024.
Data for Extended Figure 4h were available via Supplemental Table 4, filtered for adjusted P-value below 0.1 and absolute log2 fold change of at least 0.6. The gene symbol and fold change sign were used in Venndir.
Figure 5.8 shows the Venndir re-creation
of Seehawer Extended Figure 4h, with separate up- and down-regulated
Venn diagrams (Seehawer et al. 2024).
The Venndir output is nearly identical,
differing only by 1 gene each in the 67NR-specific overlap -
most likely a discrepancy by rounding error.
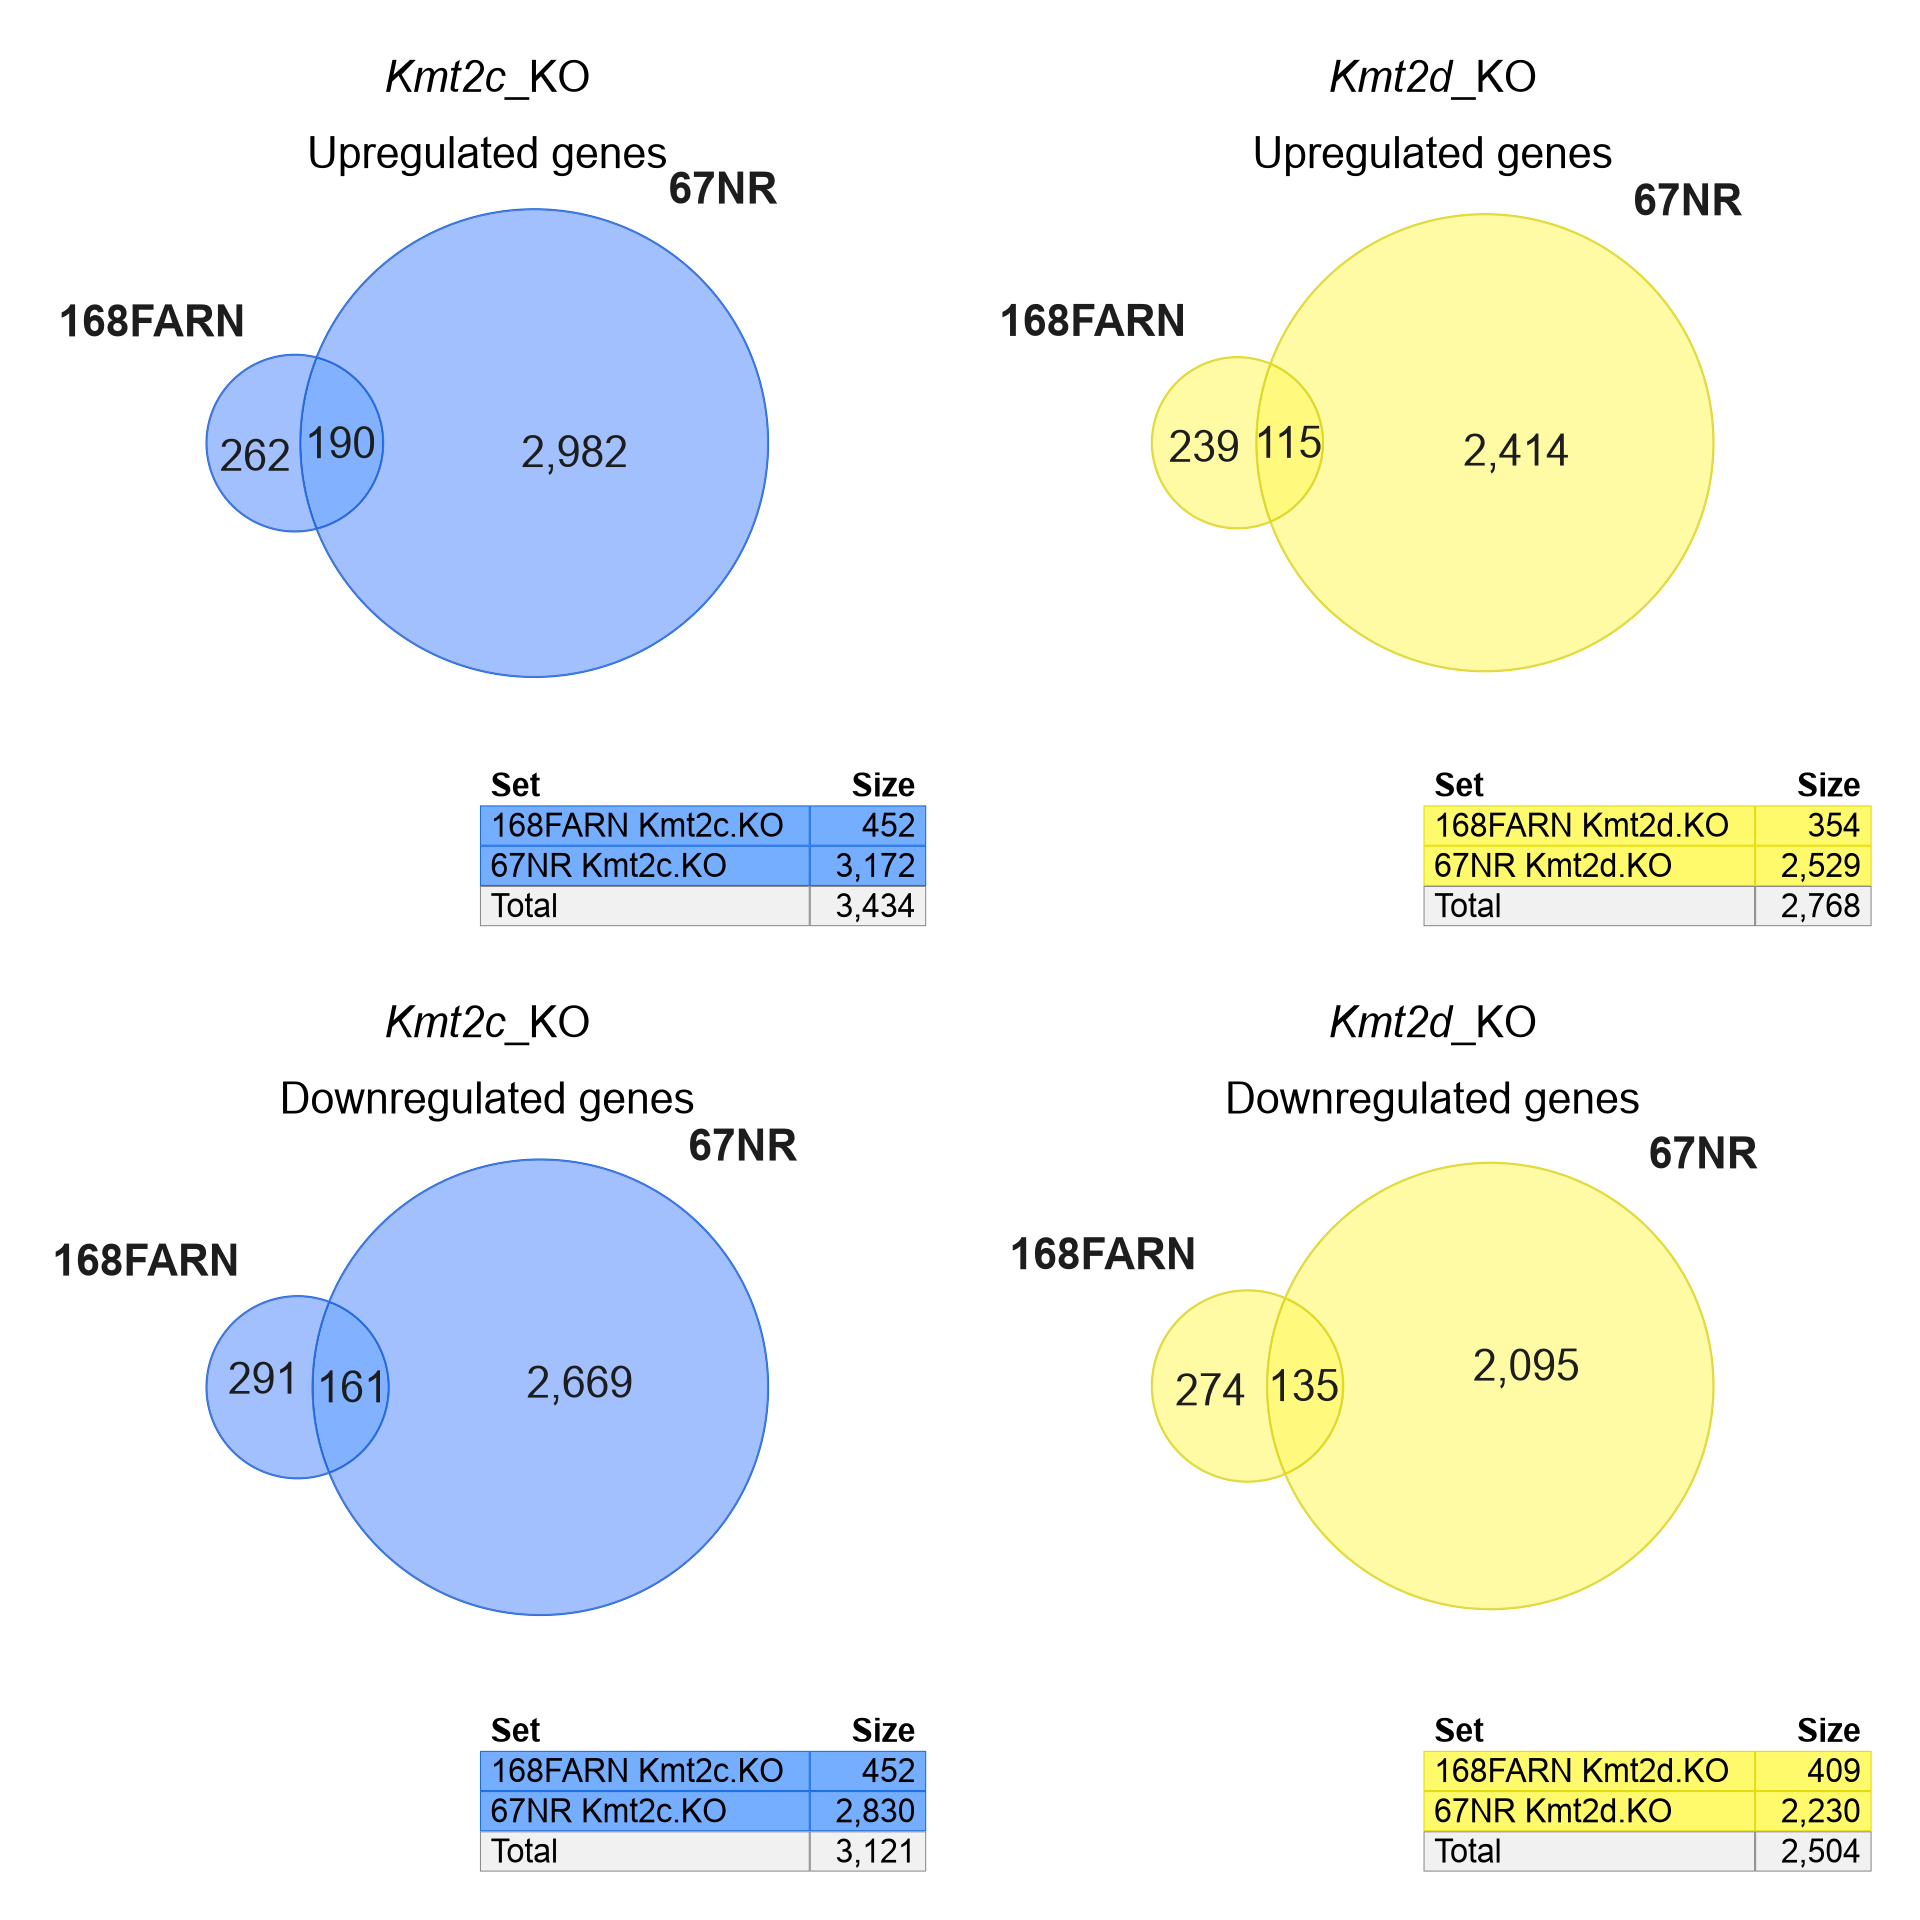
Figure 5.8: Venndir re-creation of Seehawer Ext. Fig 4h.
However, the next question is whether the shared gene changes are concordant or discordant in direction.
Figure 5.9 includes up- and down-regulated genes together, with Kmt2c_KO (left) and Kmt2d_KO (right).
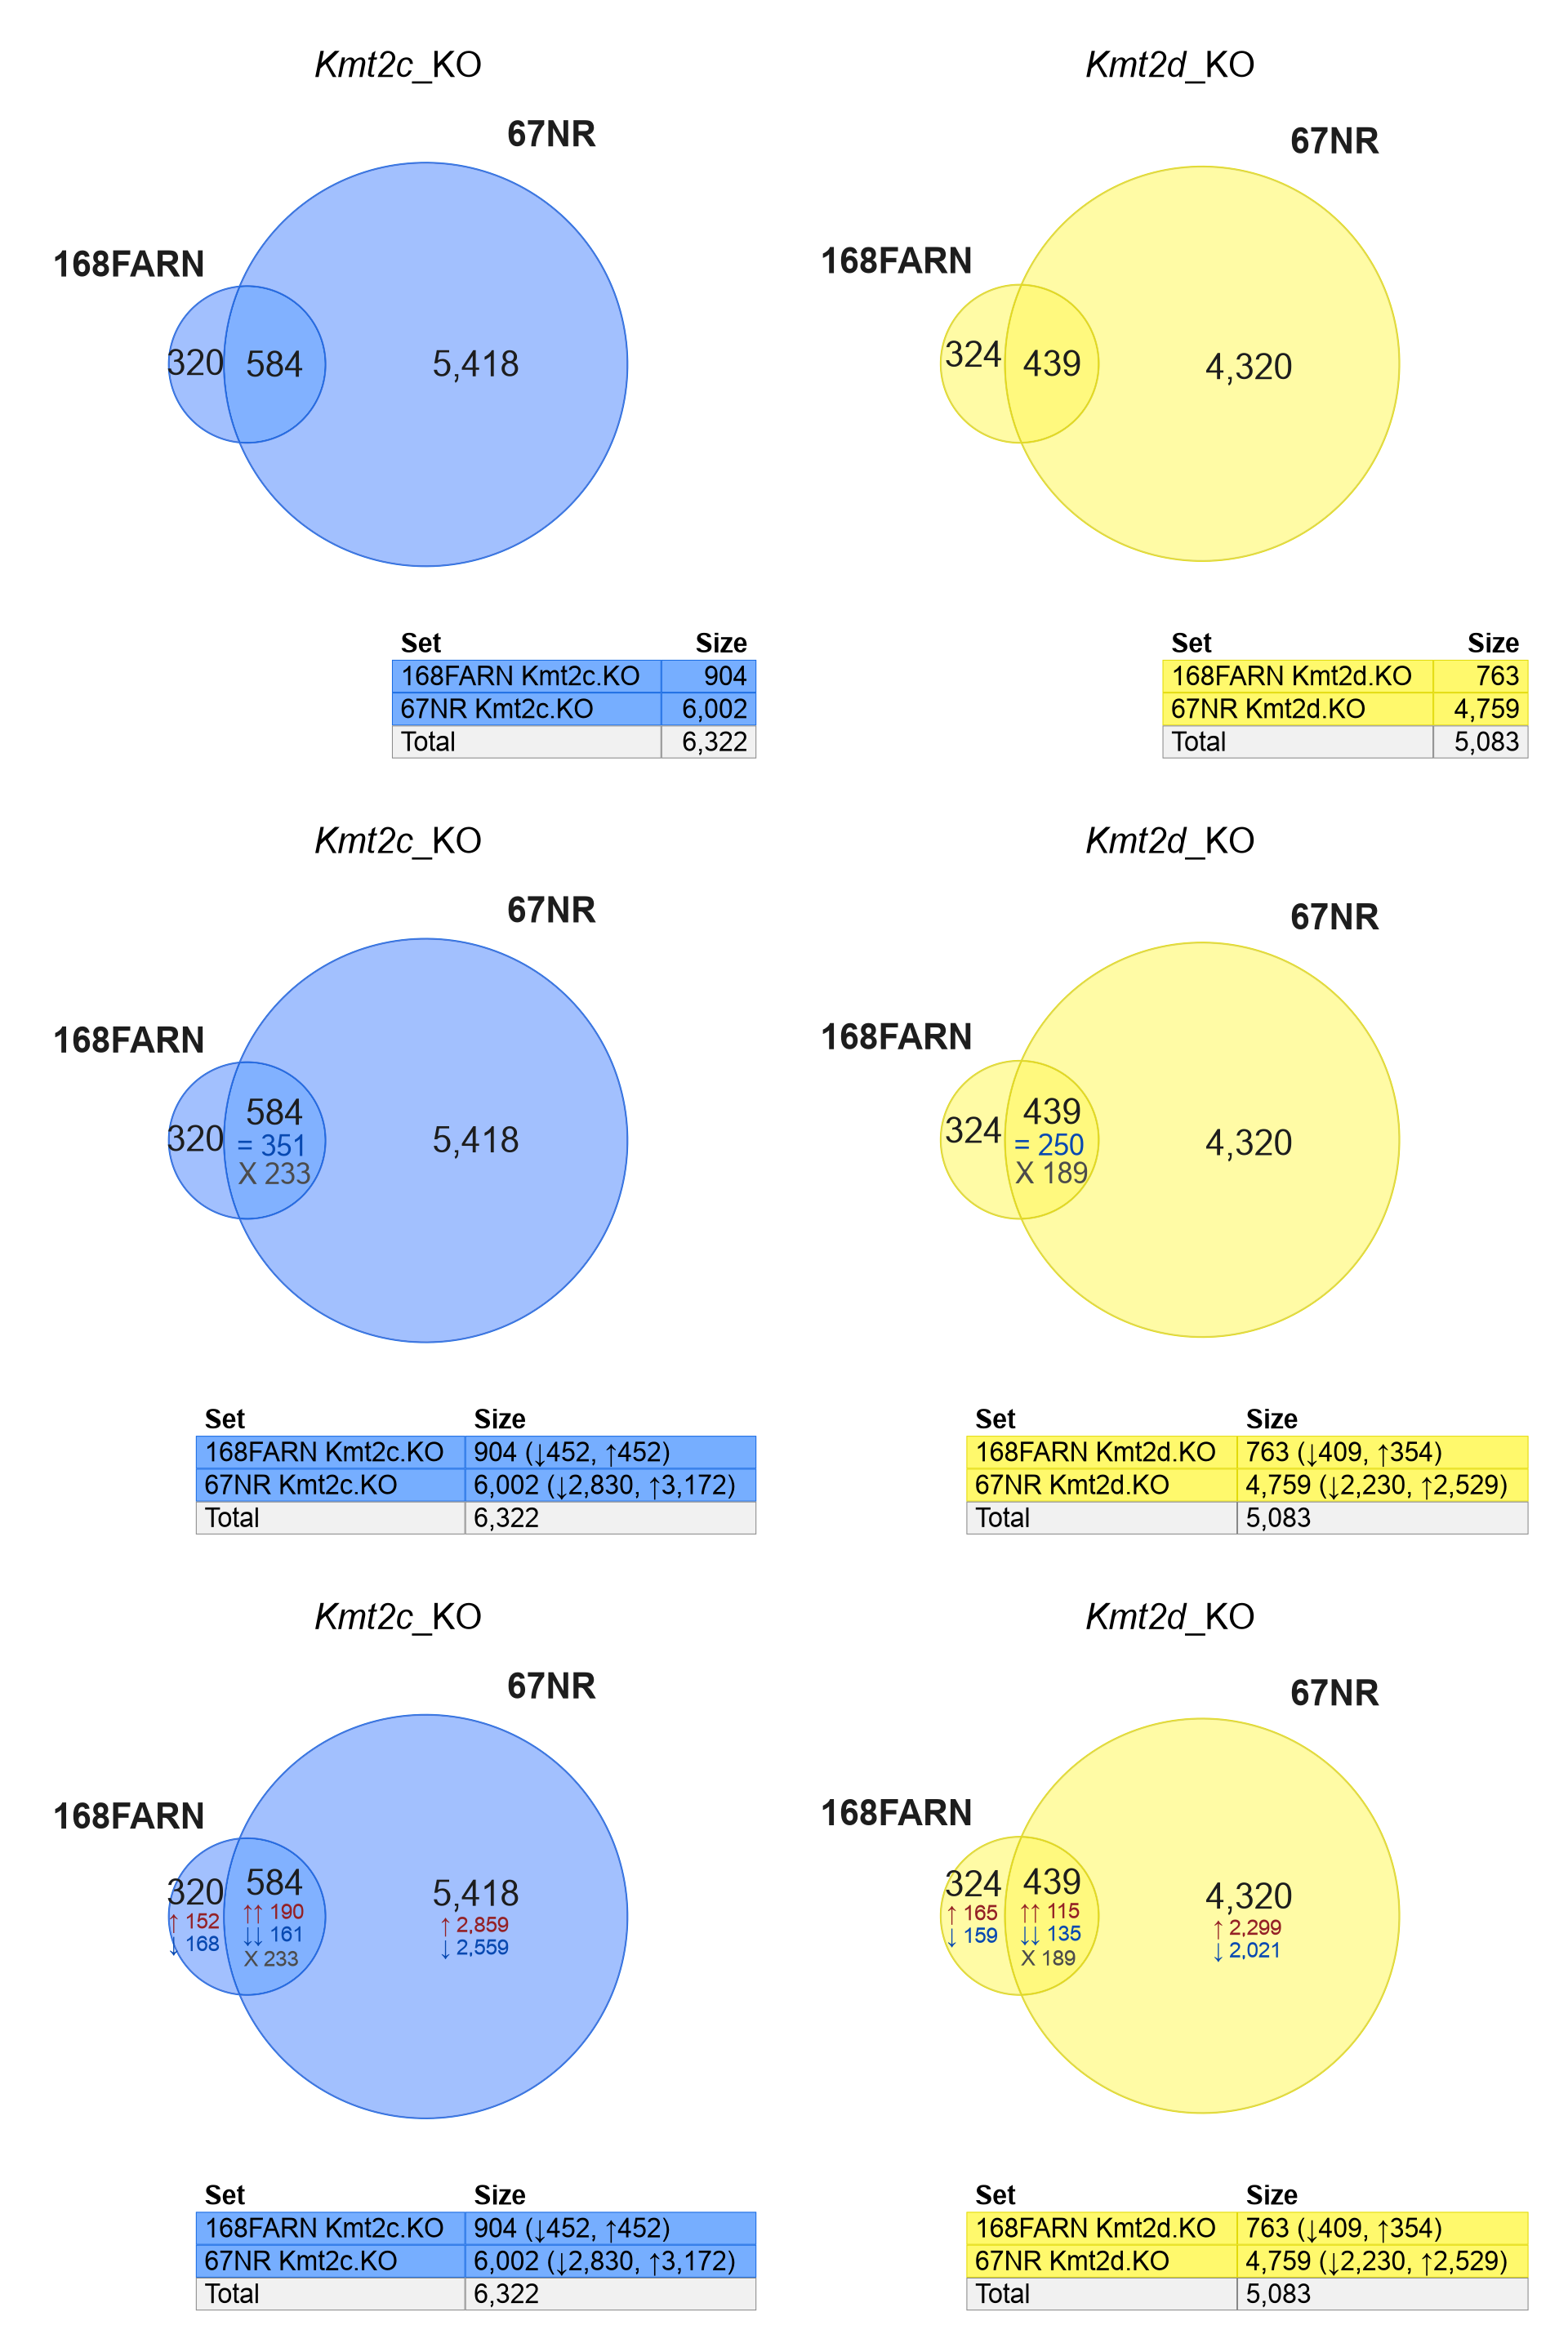
Figure 5.9: Venndir re-creation of Seehawer Ext. Fig 4h, using the complete set of up- and down-regulated genes together. The top row shows 'overlap', the second row shows 'agreement', and the third row shows 'concordance'.
Findings:
The first row of panels shows regulated genes without regard to direction.
- For Kmt2c_KO (left) and Kmt2d_KO (right), the shared genes represent a higher proportion of the Venn diagrams than in Seehawer.
- This increase in shared genes suggests that the increase is caused by discordant changes.
The second row summarizes the overlap direction by 'agreement', described in Overlap Type, using '=' for agreement, and 'X' for disagreement.
- Nearly as many shared genes disagree in direction as those that agree.
The bottom row summarizes the overlap by 'concordance', using
arrows to indicate direction, and 'X' for discordant changes.
Conclusion:
Directionality provides important and context which was previously missing in the Seehawer data (Seehawer et al. 2024). While it is true the two cell types shared some proportion of gene changes, the directional concordance was not particularly strong. That said, the "true answer" is also not known, the subset of concordant genes may represent the shared components, or maybe the discordant genes could play different functional roles in the two cell types. In any case, the concordance adds important context to the question and interpretation of supporting data.