3.4 Item Labels
To display items inside a Venn diagram, add "i" to the argument
show_labels. For example show_labels="Ni" will display the set Name
outside, and items inside.
I never thought I'd be able to place item labels in a Venn diagram, much less expect it, and eventually need it. Item labeling has become one of my favorite features.
Adding item labels also ticks the box, so to speak, of an important
data visualization paradigm:
Answering the very next question. For a Venn diagram:
"What are those?"
Figure 3.20 illustrates an example inspired by a published figure (Salybekov et al. 2021).
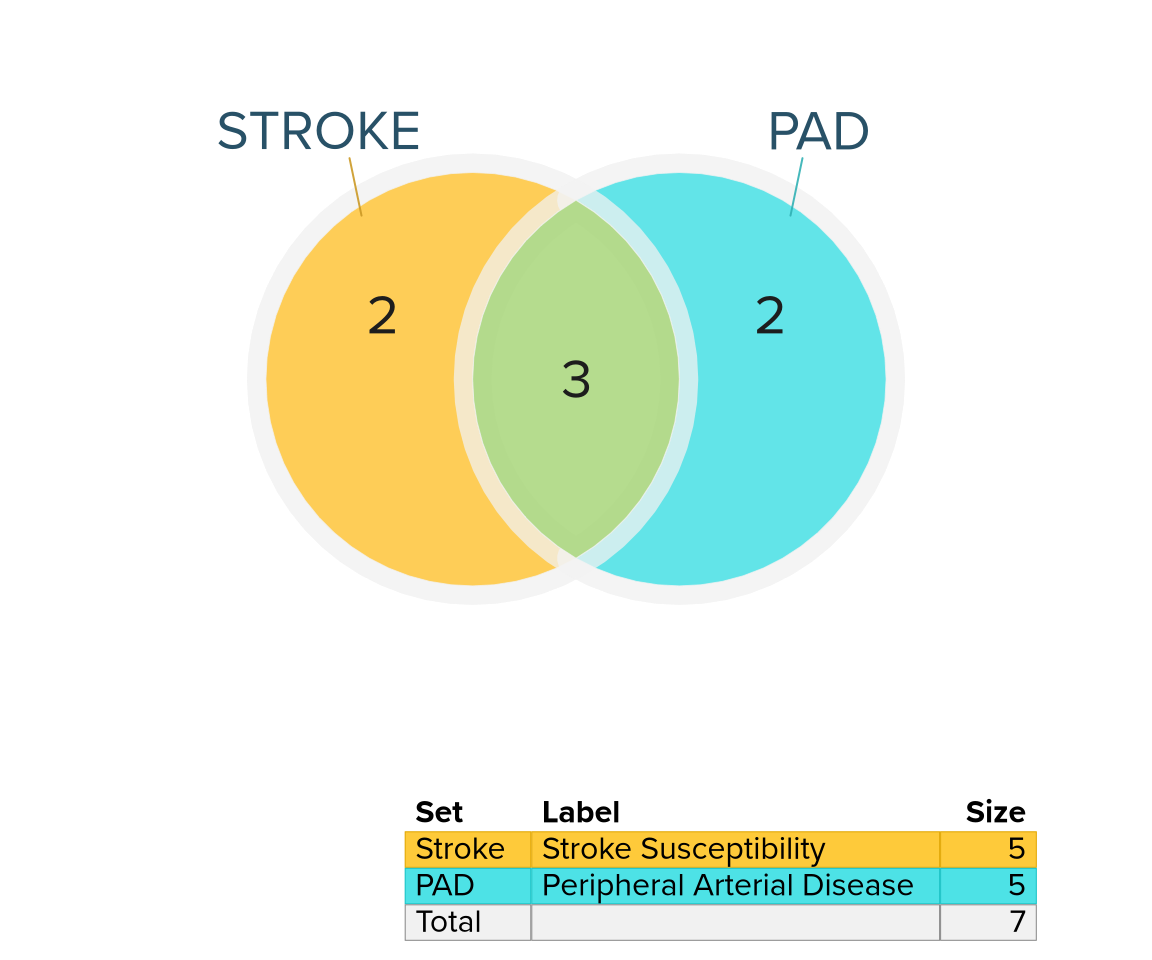
Figure 3.20: Venn diagram depicting genes associated with susceptibility to two diseases. The diagram shows the number of genes in each region: 2, 3, and 2, but does not show the genes.
(What is the very next question?)
"Which genes are in each region?"
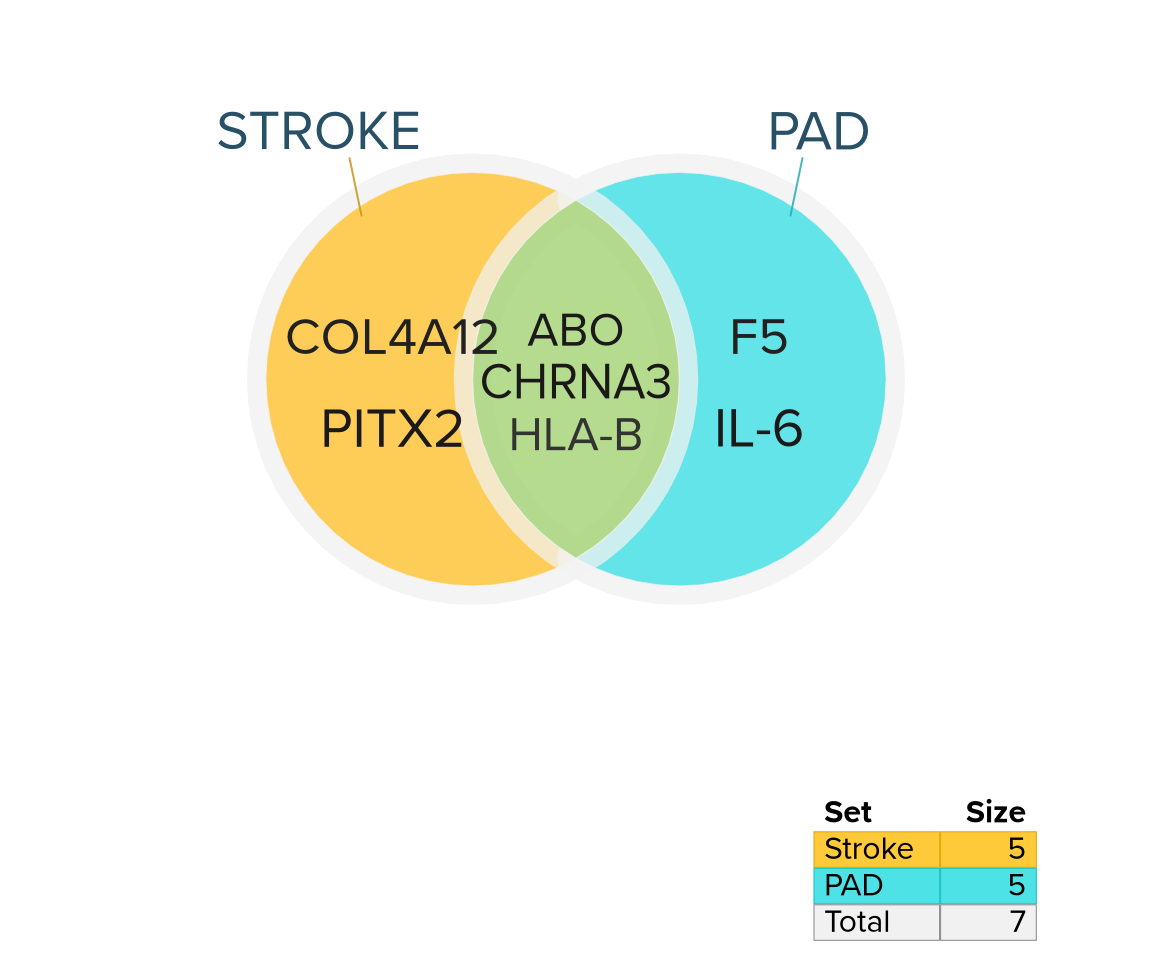
Figure 3.21: The same Venn diagram now showing genes as item labels inside the diagram, answering the very next question.
Figure 3.21 represents the first example thus far of Figure Boosting, wherein the goal is to re-create published figures using Venndir.
3.4.1 Overview of item labeling
There is much utility in adding item labels into a Venn diagram, but most involve the critical word 'if'. For example, "It would be helpful to add labels if they fit." Or "if the labels are legible."
And so there are many options associated with item labels.
Before making changes, it is helpful to understand the process.
- Items are associated with each Venn overlap region.
- More than
max_itemsitems will not be displayed.
- More than
- The type of item label is defined using argument
show_items.- "item": 'ACTB',
- "sign": '\(↑\)'
- "sign item": '\(↑ ACTB\)'
- Label coordinates are arrayed across the Venn region.
xyratiocontrols the x:y ratio when spacing pointslabel_methodcontrols whether to use up/down offset, or row-wise column layout
- The item font size is adjusted per region.
- The adjustment uses the number of labels, and the area of the region relative to the total area.
- Font colors are adjusted for contrast.
make_color_contrast()determines whether to use light or dark text for each background color.
- Minor "jittering" is applied to each label
- The effect color, size, and angle of labels are altered to help distinguish each label.
jitter_cex=0.04jitter_color=0.07jitter_degrees=0
- Items are sorted by sign, then by name.
- Items are rendered using marquee (Pedersen and Mitáš 2025).
Note that no special effort is made to prevent overlaps between labels, nor to prevent labels from extending outside the region. These features may be implemented in future.
3.4.2 Venn Memes
venn_meme() provides a streamlined approach to displaying items.
The data input process was described in Data Import,
in the section Items.
The venn_meme() function itself calls venndir() with some pre-defined
default settings, otherwise it can be customized the same way as
with venndir().
Figure Boosting, for many cases, is easily carried out
with venn_meme() alone.
provides the most convenient starting point.
A simple example of a 3-way Venn meme is shown in Figure 3.22.
bix <- list(
   "Biology",
   "Computer\nScience",
   "Stats",
   "Computational\nBiology",
   "Data\nScience",
   "Biostatistics",
   "Bioinformatics")
venn_meme(bix,
   fontfamily="Futura")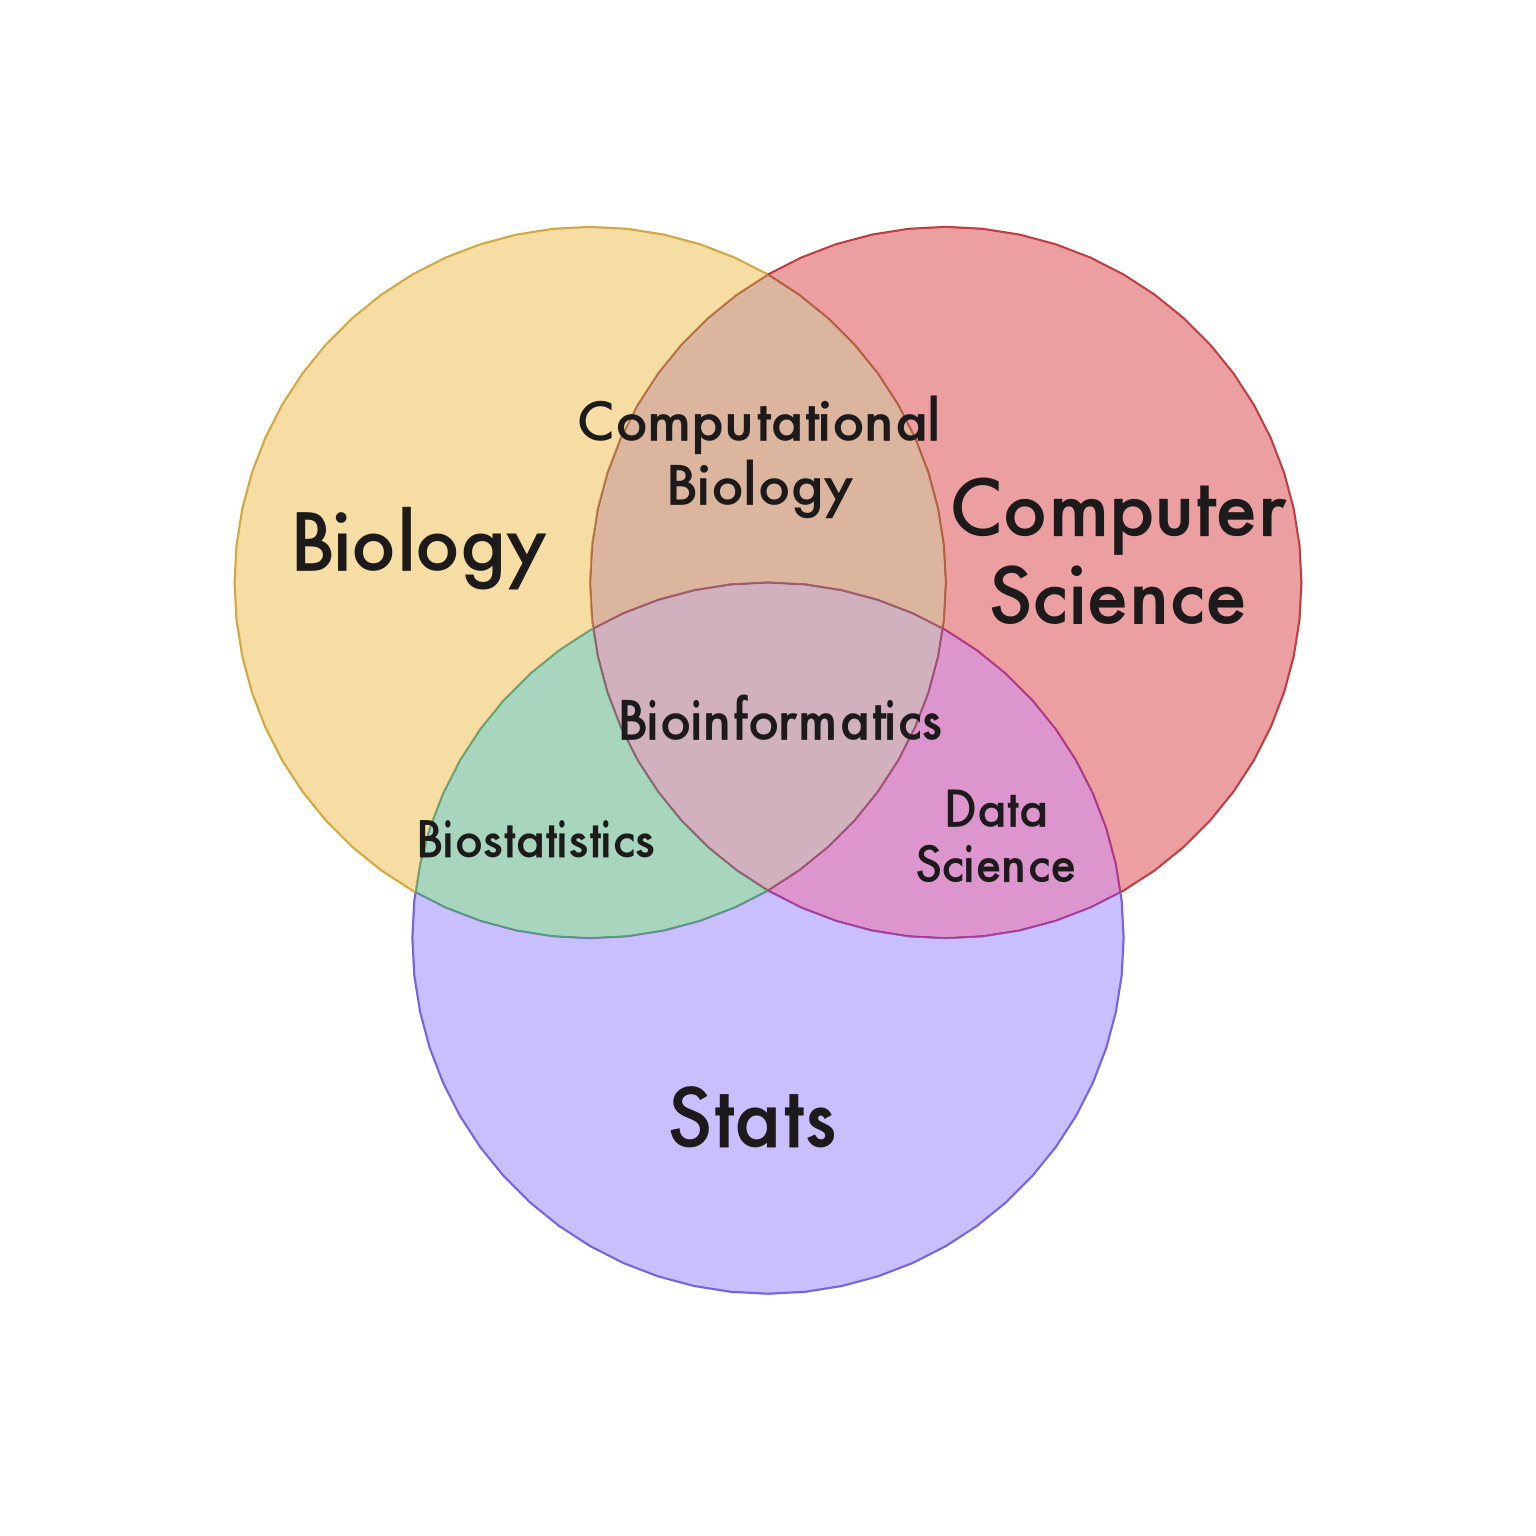
Figure 3.22: Venn diagram created using venn_meme() showing 'Biology', 'Computer Science', and 'Stats' coming together to represent the field of Bioinformatics.
Another fun example involves the perils of social media,
and being a sports fan. This example also assigns custom
"white" colors for innerborder and outerborder to
give it a clean look.
A white border can be a nice change from the default dark border, since it does not conflict with dark text.
doom <- list(
   "short-lived\nhappiness",
   "prolonged\nsuffering",
   "sudden\nrage",
   "eating\ntoo much\nspicy\nfood",
   "stubbing\nyour toe,\ntwice",
   "doom-\nscrolling\nsocial\nmedia",
   "being\na sports\nfan"
)
venn_meme(doom,
   outerborder="white", innerborder="white",
   fontfamily="Optima", item_cex_factor=0.9,
   set_colors=c("gold", "royalblue", "firebrick3"))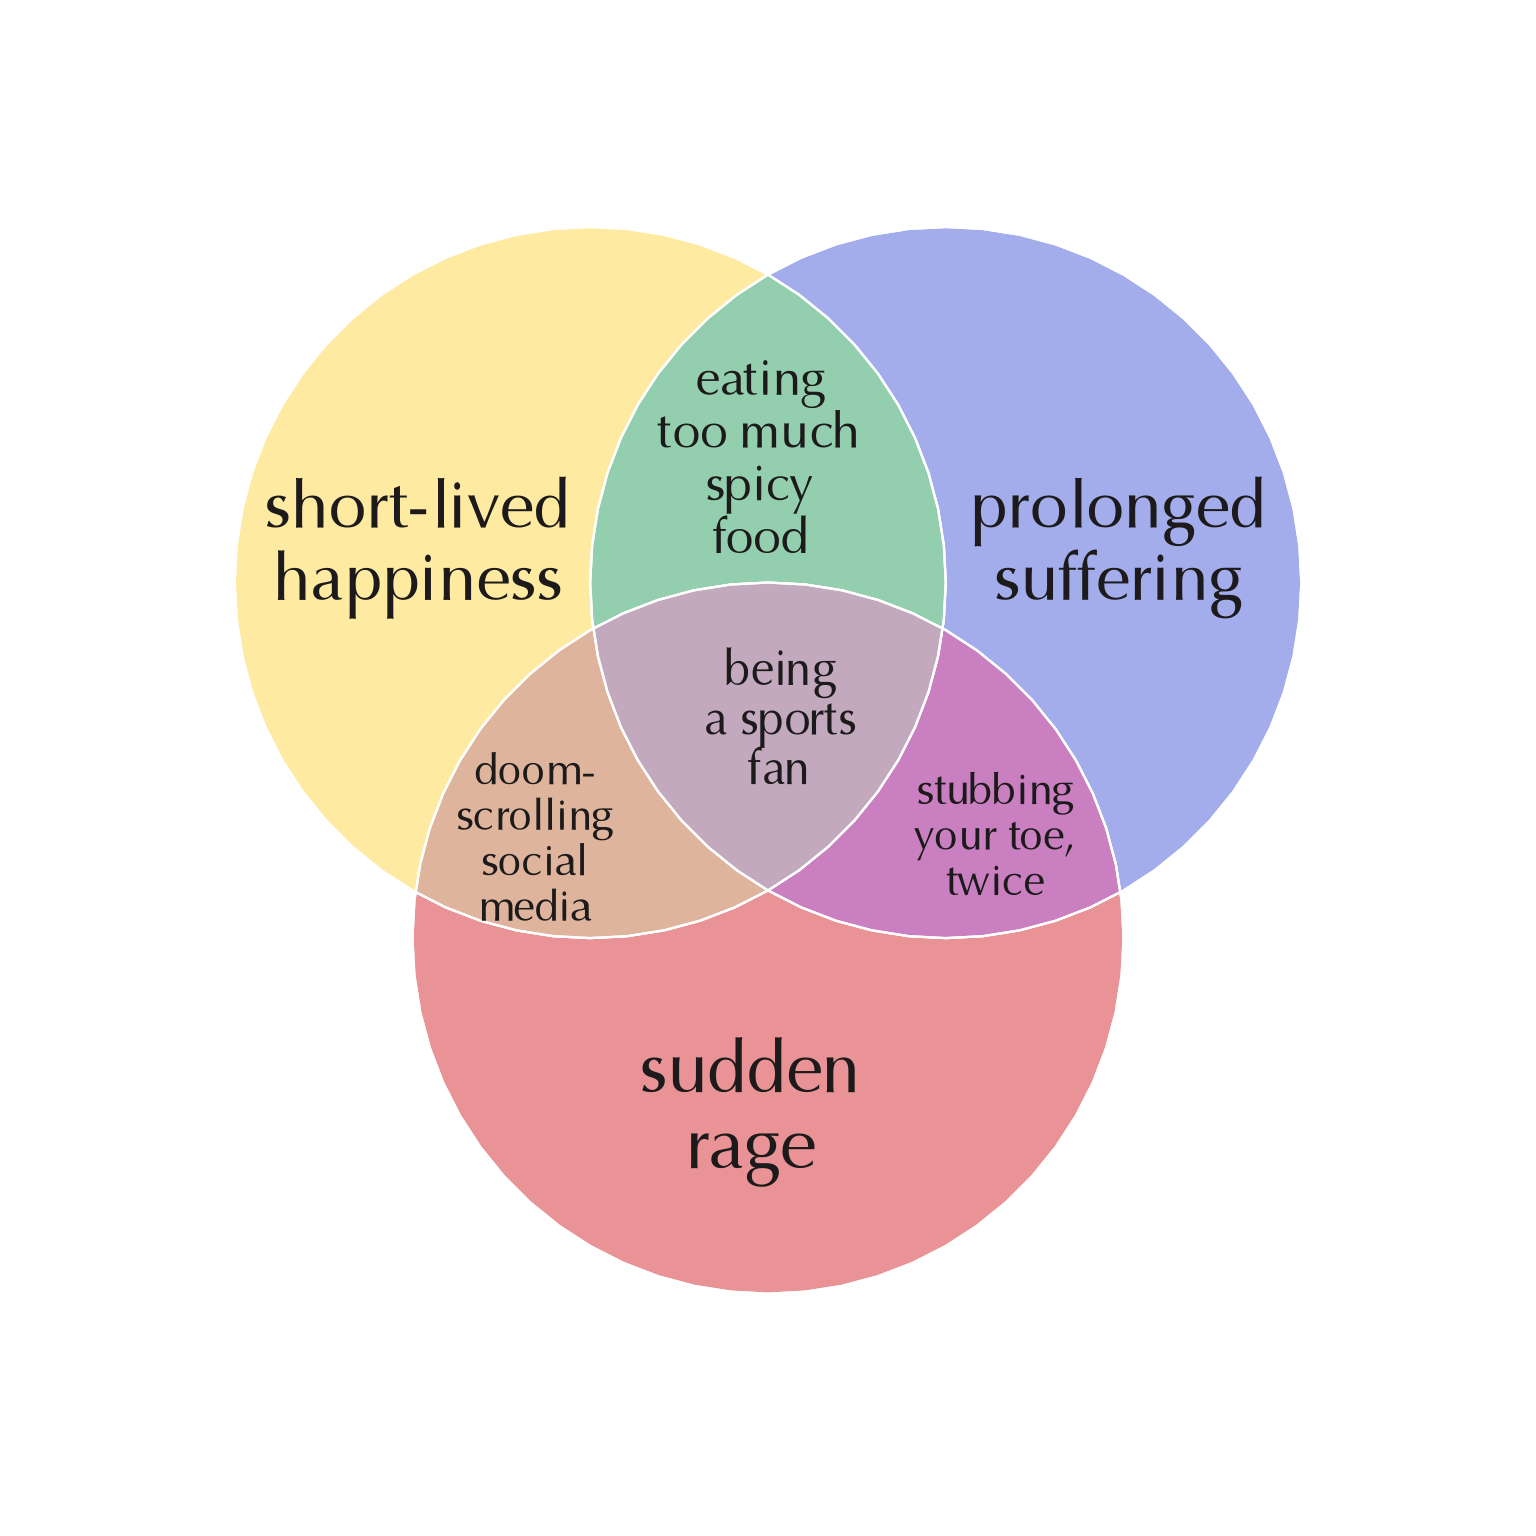
Figure 3.23: Venn meme created with elements of happiness and rage, doom-scrolling social media, and being a sports fan. It also demonstrates use of a thin white border.
3.4.3 Item Label Basics
By default, labels are arranged, sized relative to each region, and displayed.
Items are displayed by adding "i" to the argument show_labels, for
example show_labels="Ni". See Label Content for a more
thorough description.
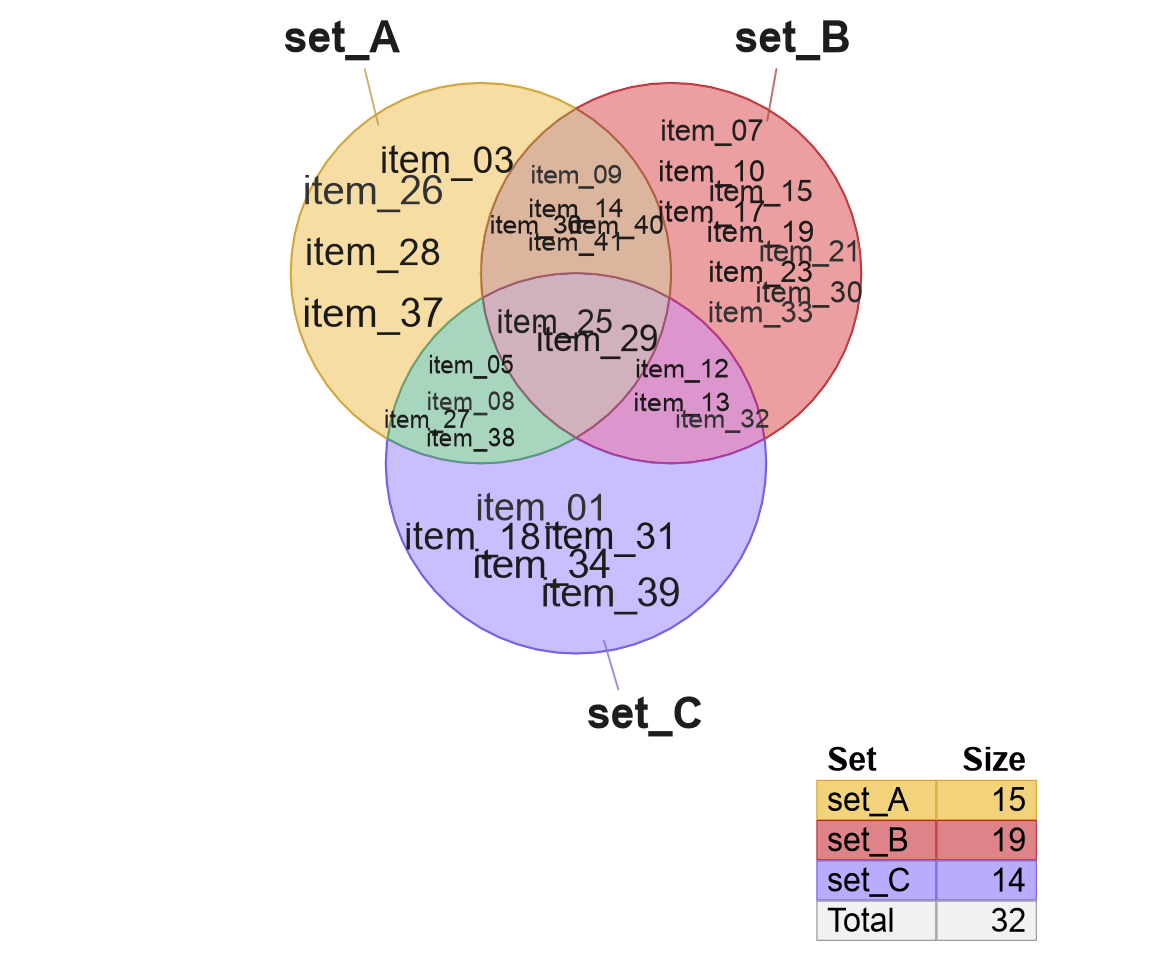
Figure 3.24: Venn diagram showing item labels using default settings.
3.4.3.1 Items inside, counts outside
When items are displayed inside, counts cannot also be displayed inside.
However, counts may be displayed outside by adding UPPERCASE "C" to
argument show_labels.
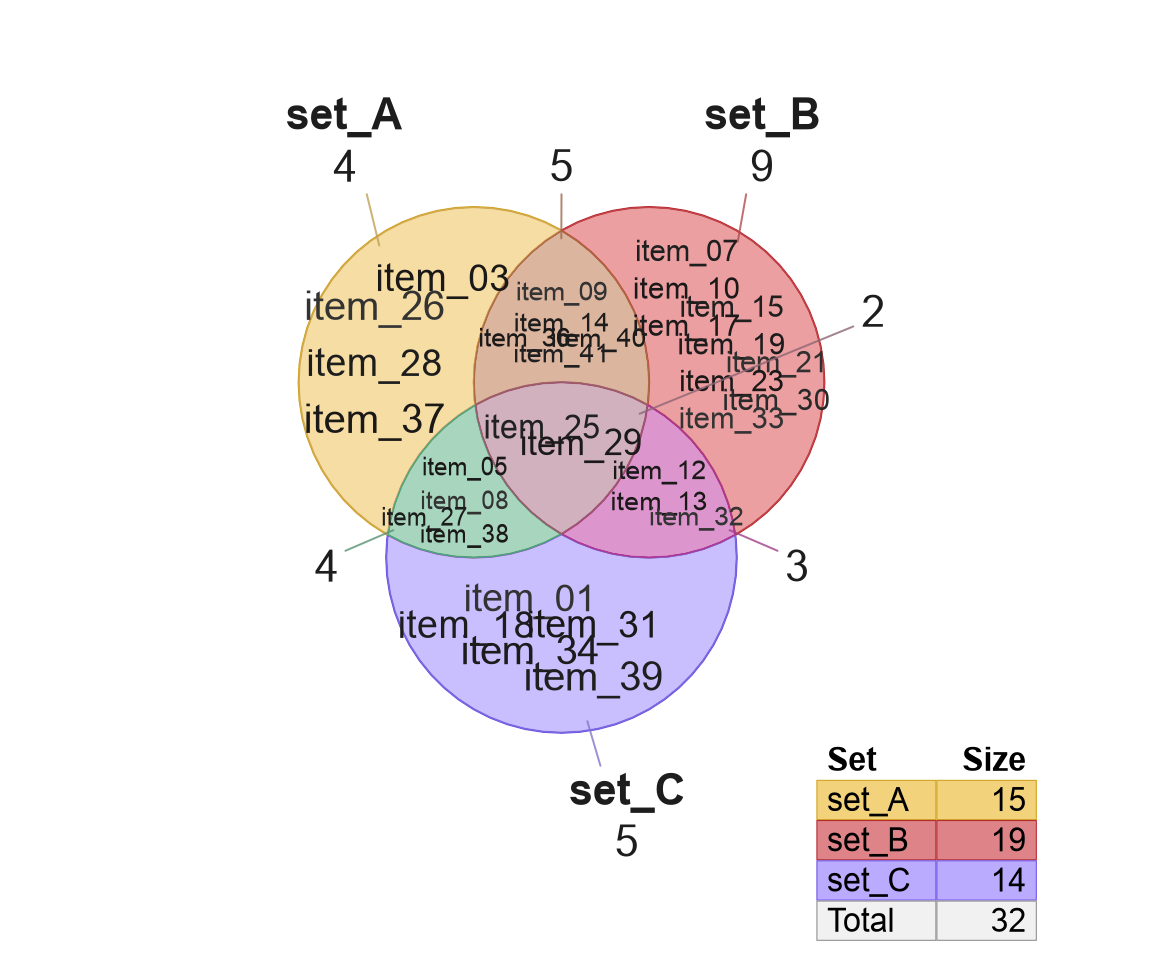
Figure 3.25: Venn diagram showing item labels inside, and count labels outside.
3.4.3.2 Signed Items
When the input setlist contains signed data, the items by default
will display the sign and item together. This behavior is defined
by the argument show_items="sign item".
Conversely, item labels will not include the sign, if either:
* the input setlist does not contain signed data, or
* overlap_type="overlap" is defined, which ignores signed data.
setlist_signed <- make_venn_test(n_items=41, do_signed=TRUE)
venndir(setlist_signed,
   item_cex_factor=0.7,
   x_inset=grid::unit(-1, "lines"),
   show_labels="Ni")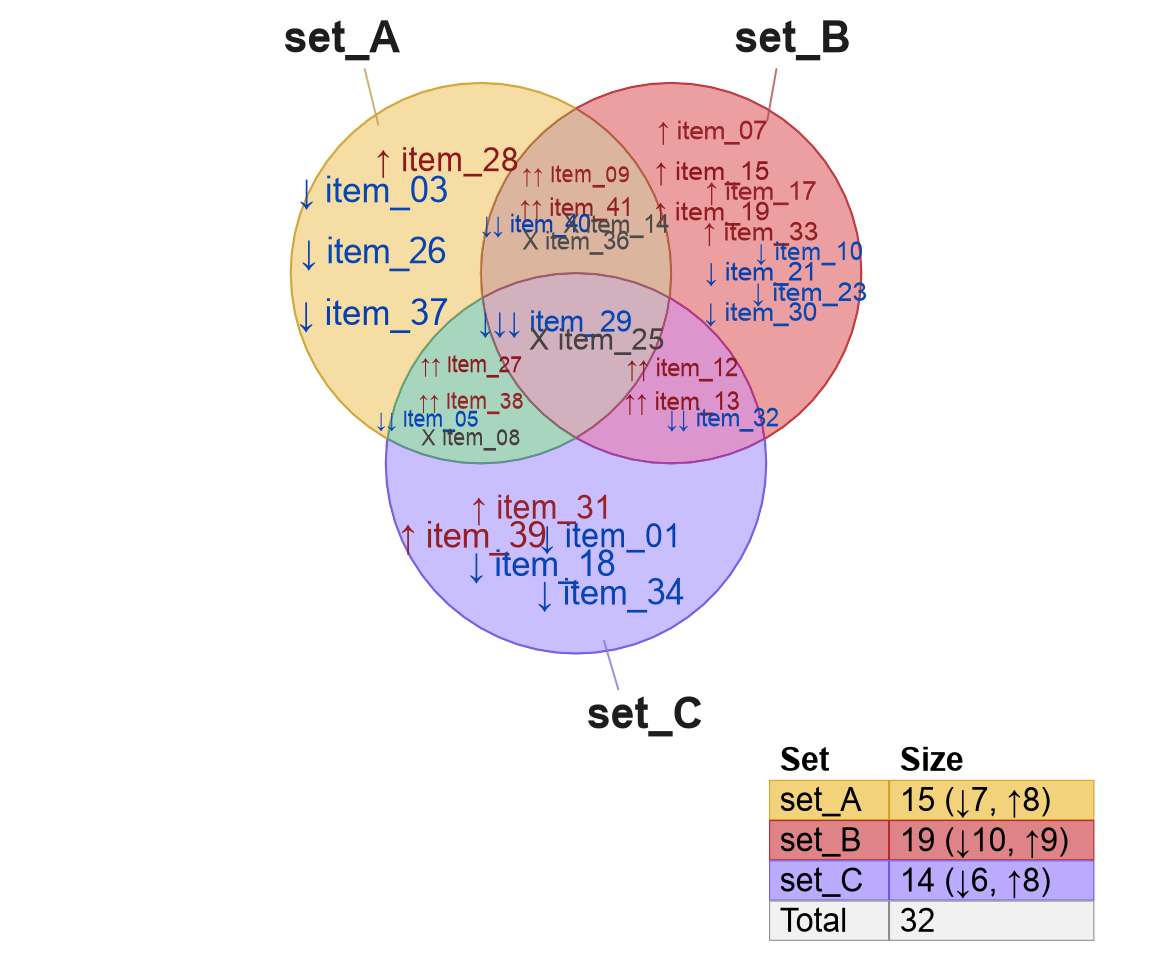
Figure 3.26: Venn diagram with signed data, showing item labels inside each region. The items now have directional arrows beside them, and the item labels utilize color to indicate the directionality.
Note that signed item labels are colorized consistent with the
sign, as defined by argument curate_df. For a detailed
discussion of signs, and how to customize the sign and corresponding
color, see Custom Signs.
3.4.3.3 Signs only
When there is a large number of items, one alternative is to display the sign. This option is effective partly because the color is also used, and has the effect of "filling the space" with proportional amount of color.
To display only the sign for each item, use show_items="sign".
When showing only the sign, it may be useful to increase the font size.
The argument item_cex_factor adjusts item fonts in each region, and
is multiplied by the automated sizing based on the number of items and
area in each region.
setlist_signed <- make_venn_test(n_items=850, do_signed=TRUE)
venndir(setlist_signed,
   show_labels="Ni",
   show_items="sign",
   x_inset=grid::unit(-5, "lines"),
   item_cex_factor=1.2)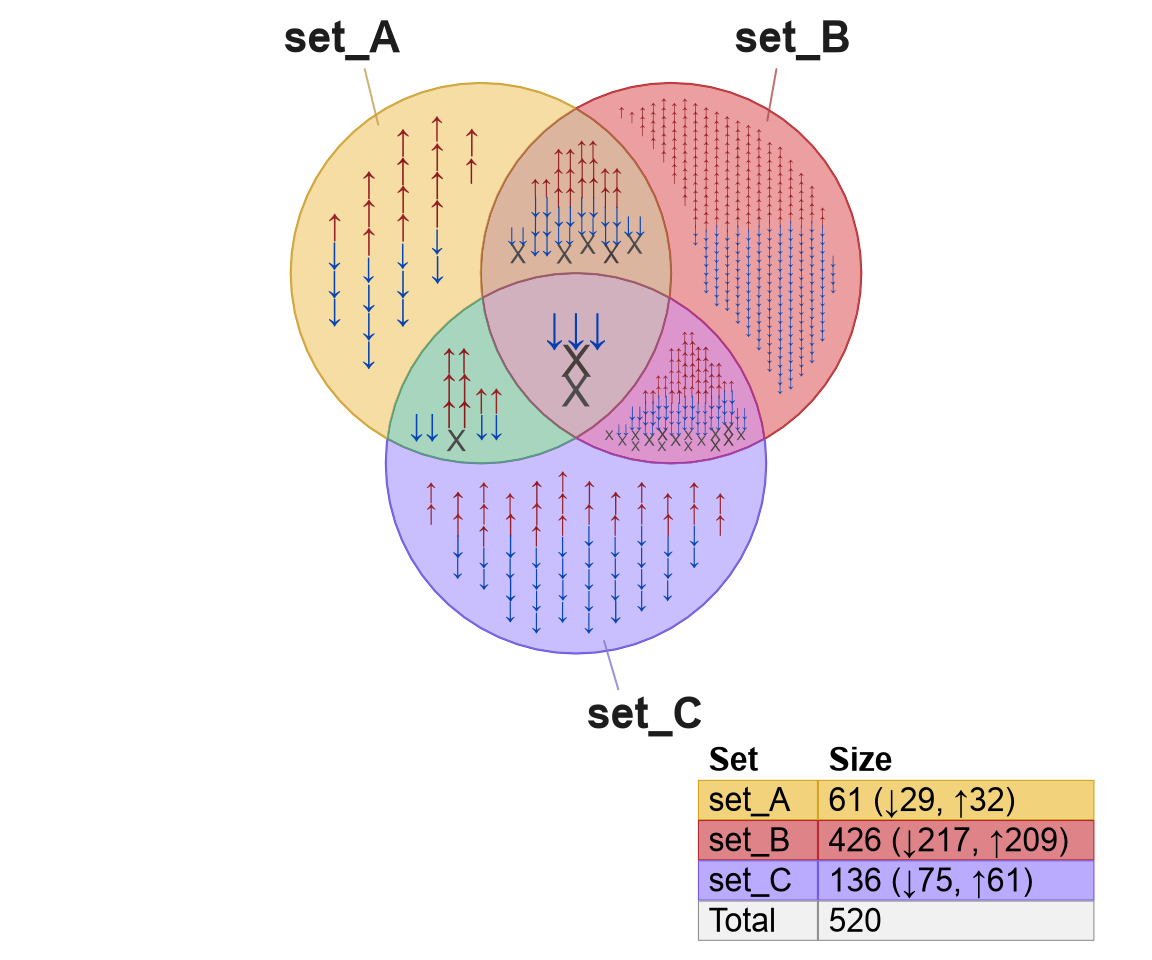
Figure 3.27: Venn diagram showing only the signs of the items filling each overlap region.
3.4.4 Item layout adjustments
There are three main points for adjusting the layout of item labels.
xyratio: Defines the width-to-height ratio, default 1.1.- Useful to increase xyratio for wider labels, or to enforce "column" type layout.
label_method: Determines whether labels alternate up/down per row.label_method="offset"(default) uses a slight 'offset' on each row, resulting in somewhat triangular label placement. This approach is more effective at packing labels into the available space.label_method="columns"does not apply an offset, which helps align items in neatly organized rows. This option is useful when also using a higher value forxyratio.
item_buffer: Controls the buffer zone around the region border.
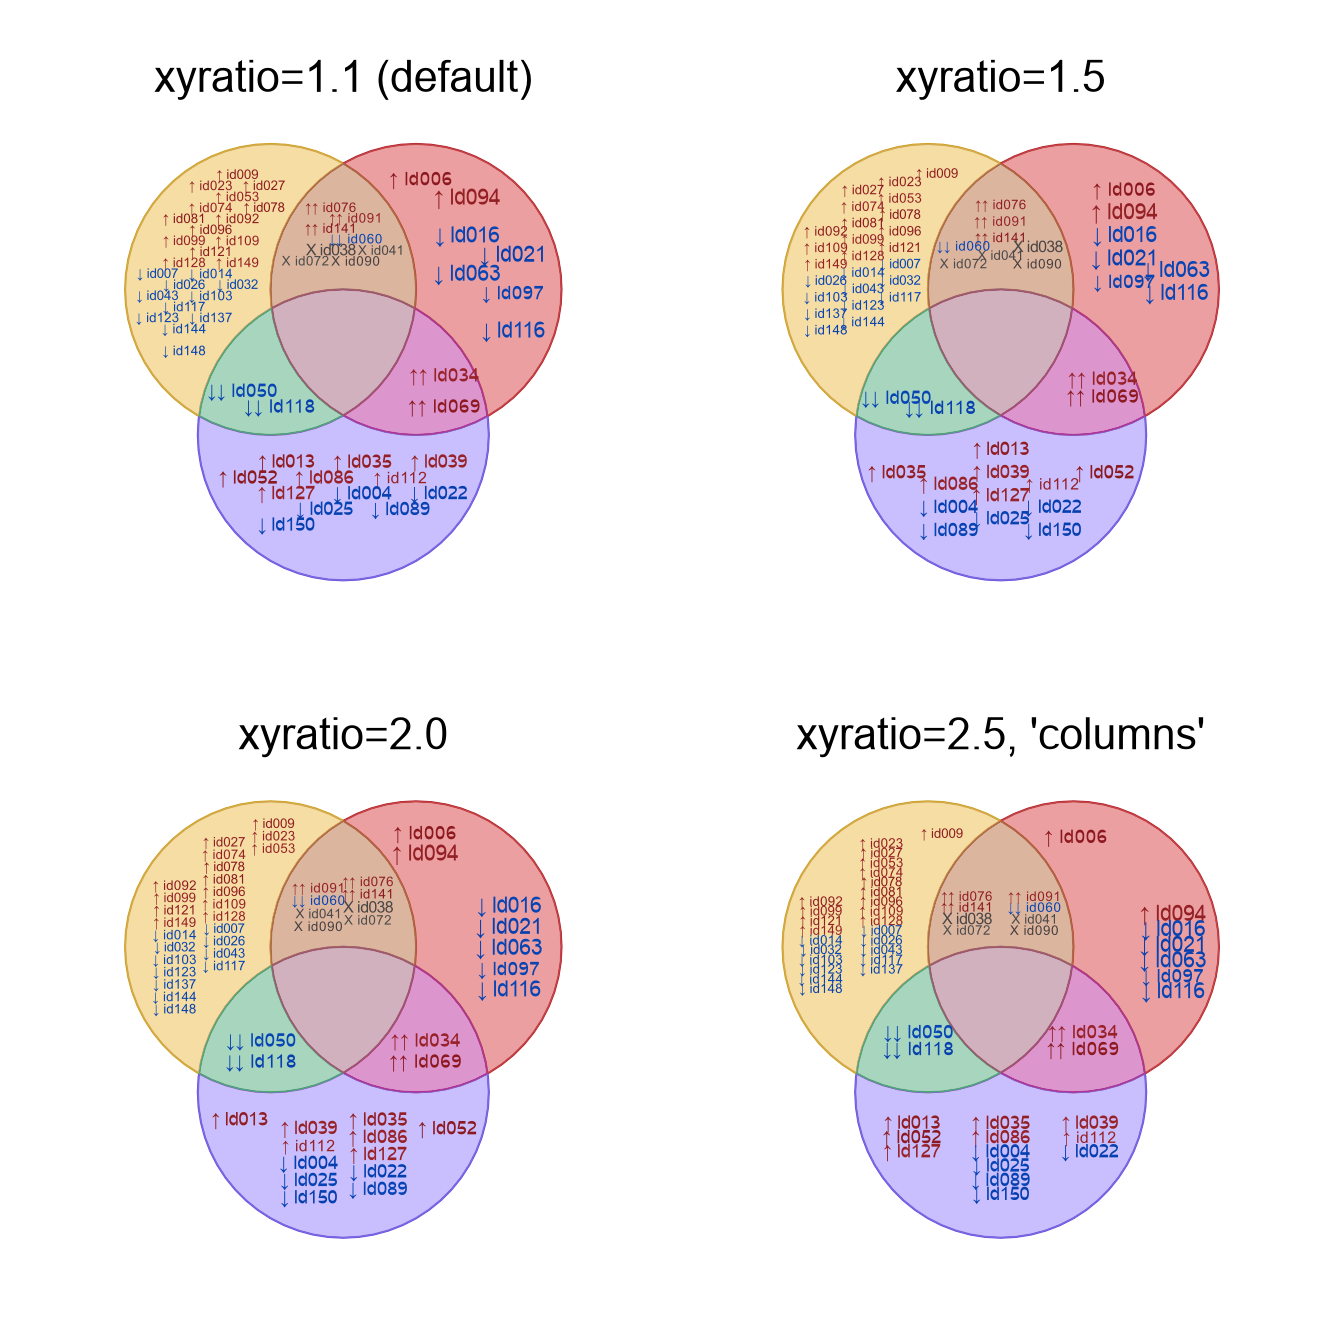
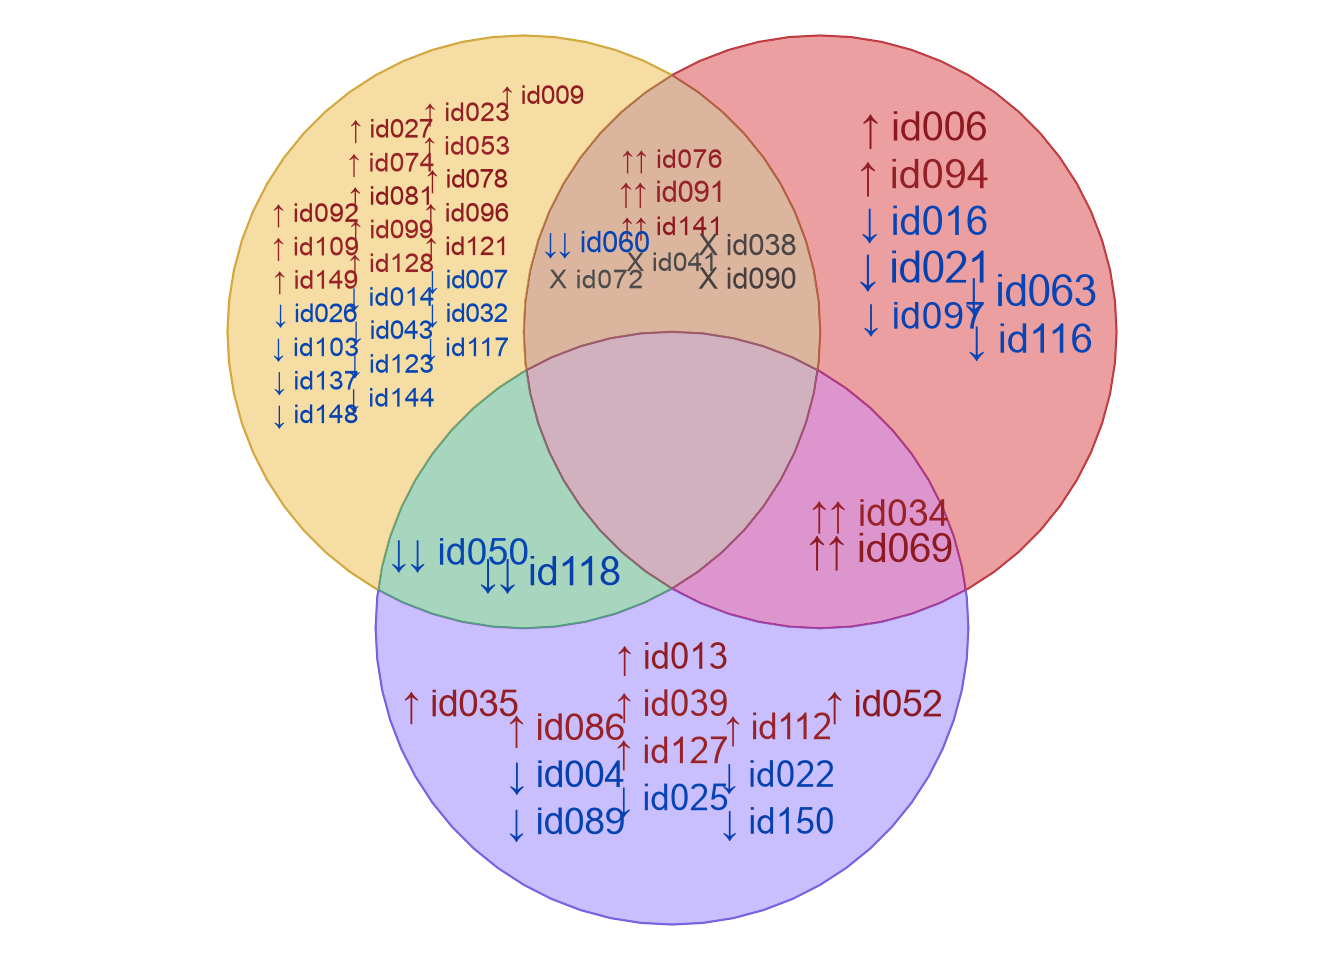
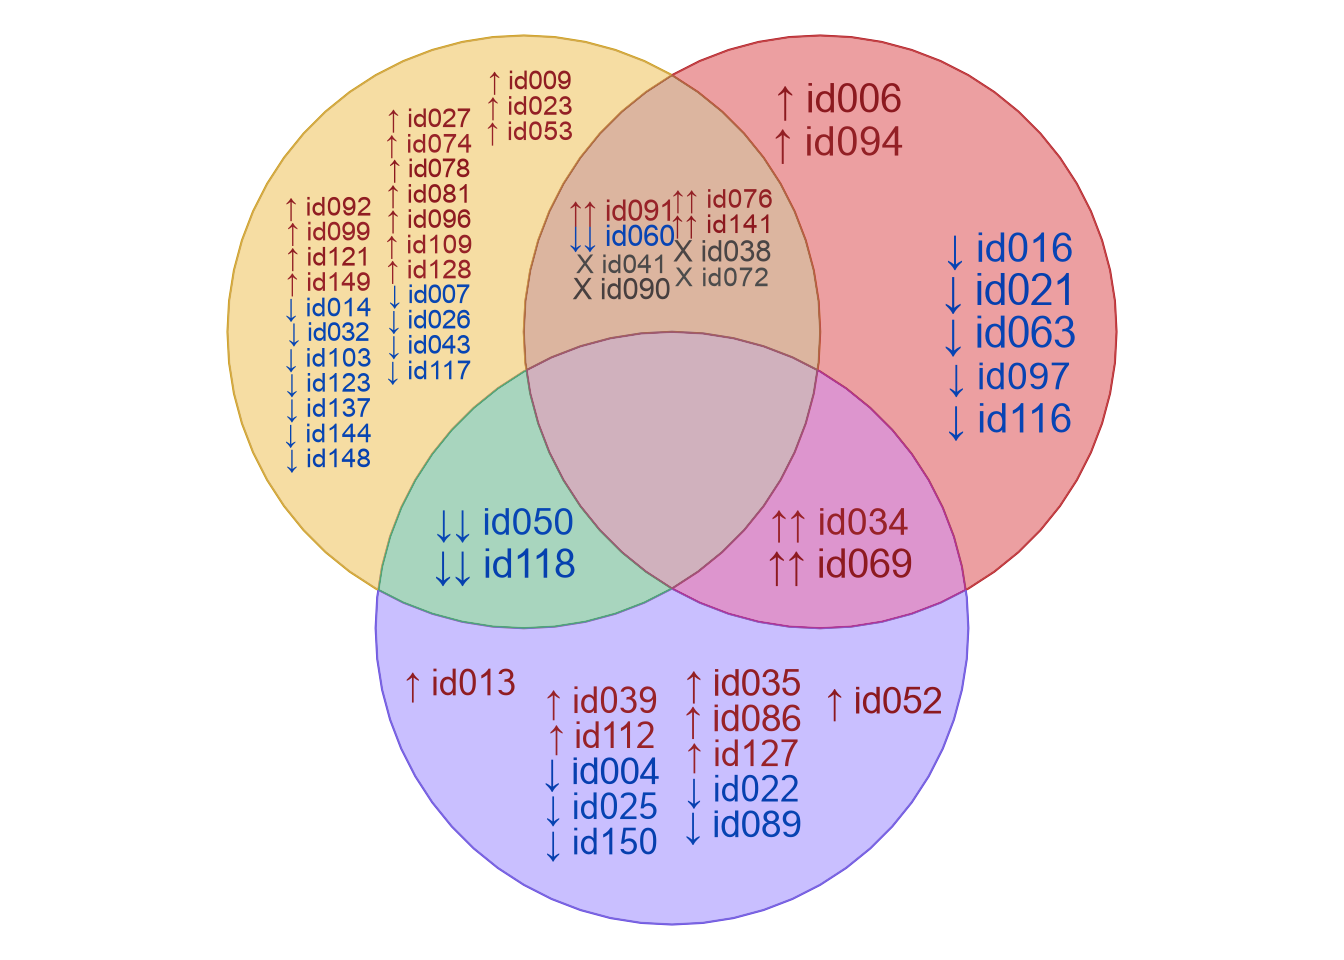
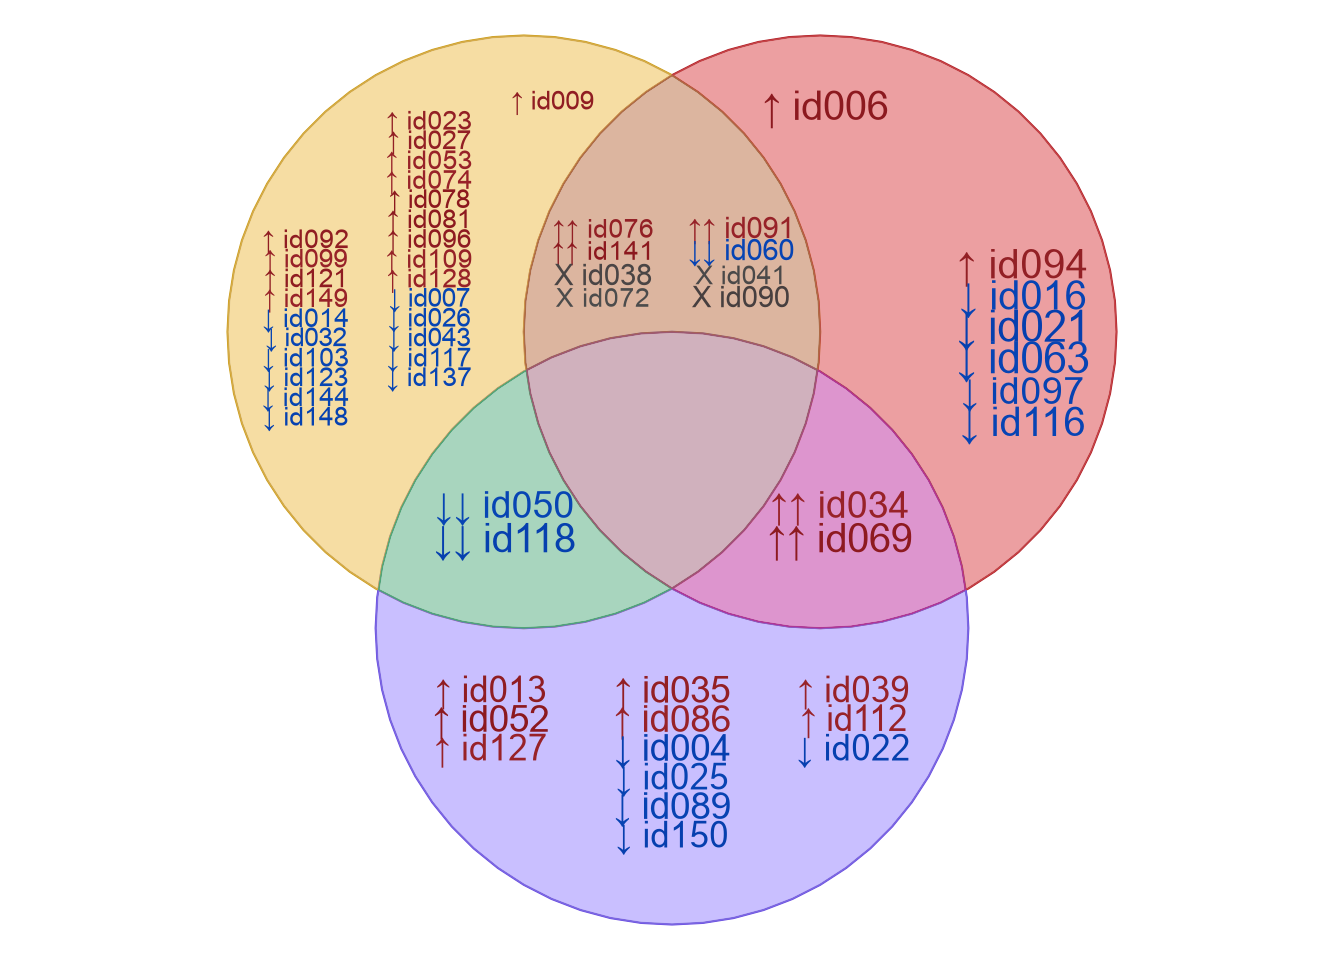
Figure 3.28: Four Venn diagrams, showing examples using different values for 'xyratio' and 'label_method'. Higher 'xyratio' values tend to become more column-oriented.
3.4.5 Item buffer
Two arguments are used during item labeling, both of which are motivated to help place typical text labels inside the respective Venn overlap region:
- The argument
item_bufferis used to impose a reasonable distance between item labels and the border of the region to be labeled. Units are relative to the fraction of area that would shrink the region to zero. - The argument
width_bufferadds a small buffer to the left and right sides of each region, which is intended to correct for wide text labels.
The default item_buffer = -0.15 is negative in order to shrink
the region by this relative amount, and -0.15 shrinks the
region by 15% relative to the available buffer size for the
region.
Note that item_buffer = -0.15 (15% buffer) is a slightly different
size for each region.
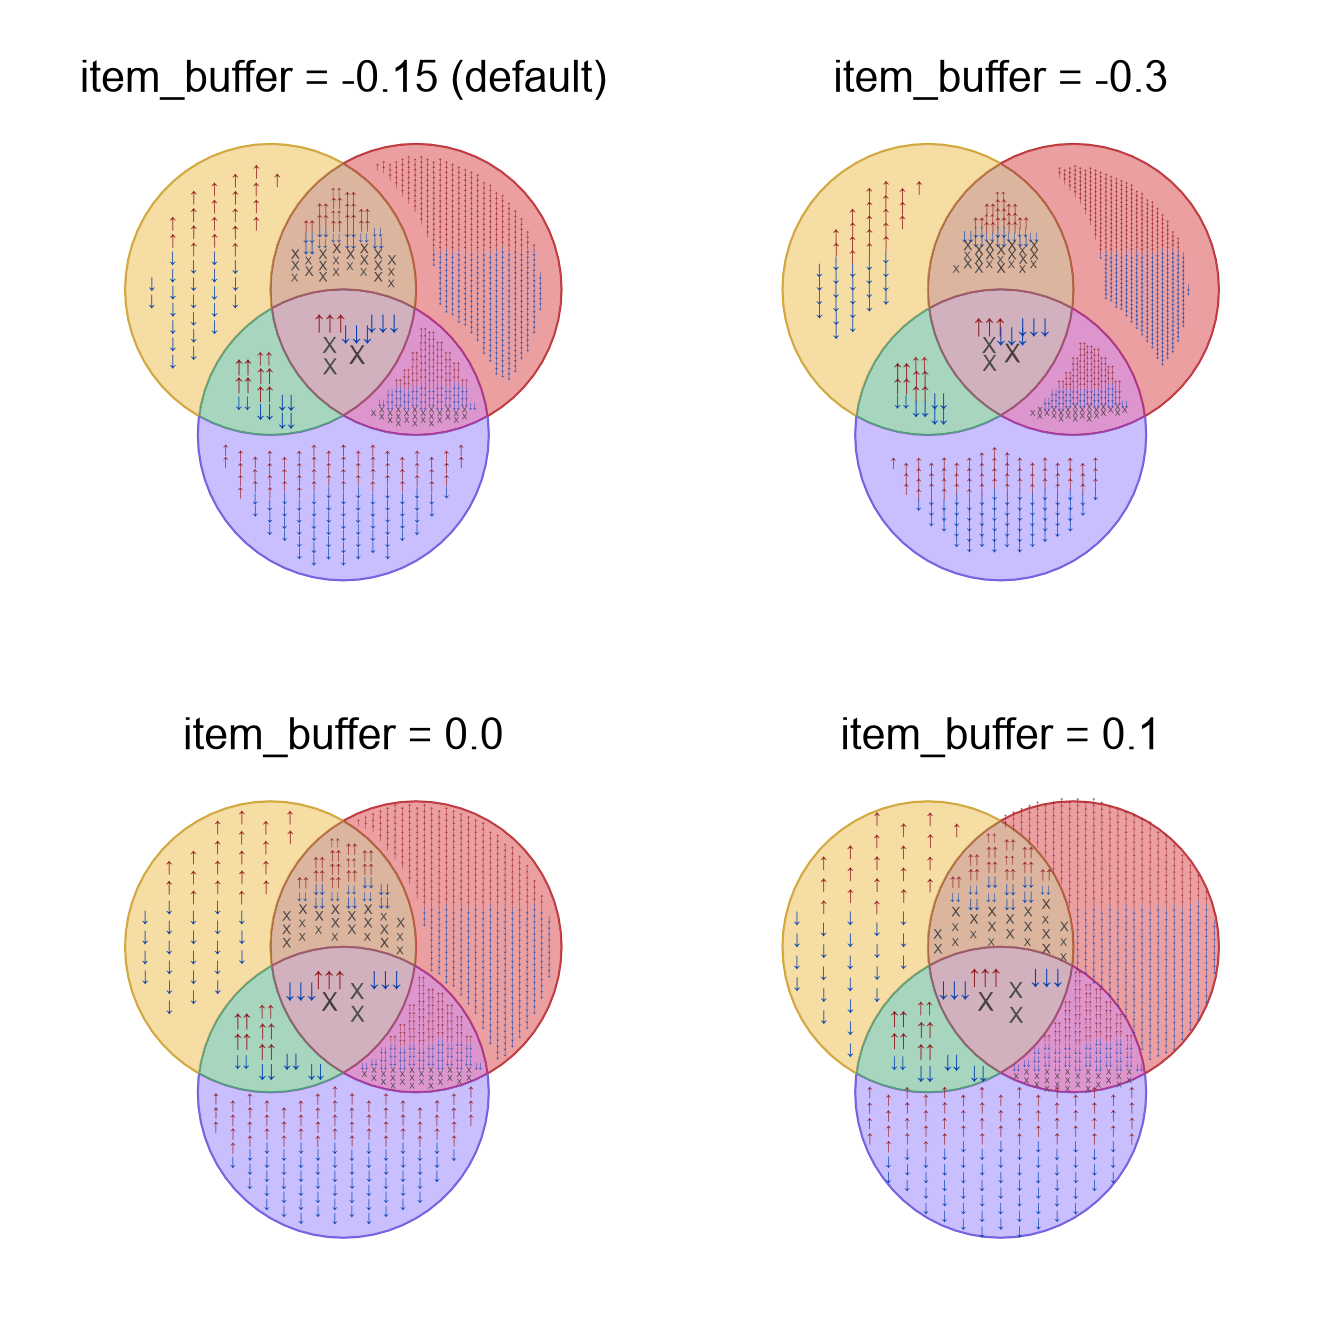
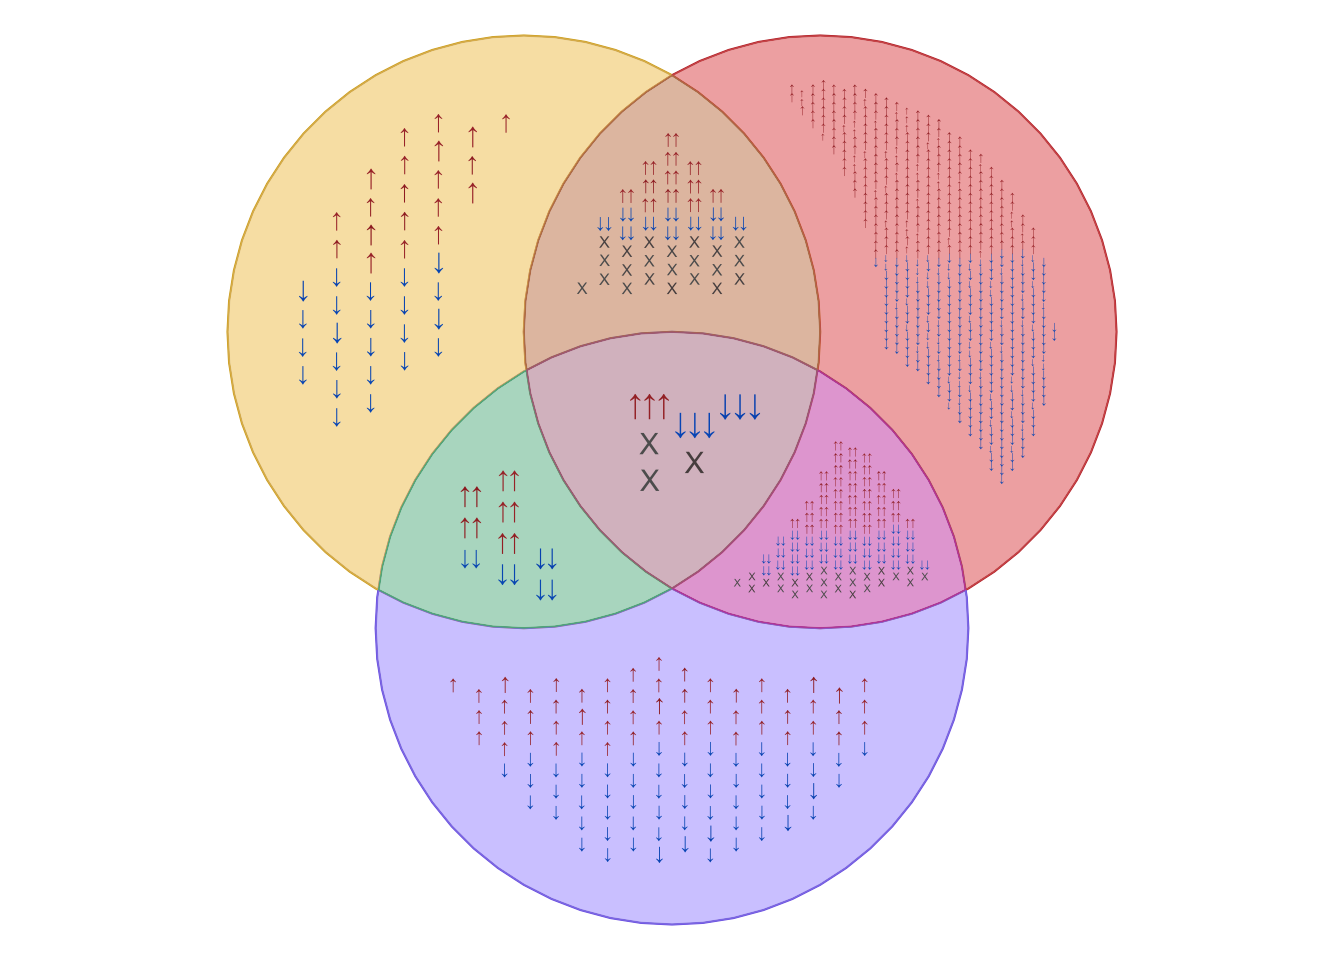


Figure 3.29: Four Venn diagrams showing the effects of adjusting 'item_buffer'.