4.8 Hidden Overlaps
Euler diagrams may offer improvements to standard Venn layout, by giving a visual indication of the relative area within each set and the corresponding overlaps. However, Euler diagrams are only determinant for two sets, exactly correct. With more than two sets, a Euler diagram provides the best approximation of the overlap sizes.
Some overlaps in a Euler diagram cannot be represented at all, due to limitations of 2-dimensional geometry.
Venndirobjects retain all set overlaps, including those which cannot be displayed in a Euler diagram.
Four strategies mitigate the limitations:
- Discover hidden counts using
warnings(Venndir). - Recover hidden overlaps using
overlaplist(Venndir). - Adjust the Euler diagram, for example see Nudge Venndir Circles.
- Optimize Euler modeling options with
eulerr::eulerr_options().
Data from Bisogno et al help
demonstrate how to workaround the issue.
Overlap counts were imported to create a setlist.
overlaps <- c(A=187, B=146, C=499,
   `A&B`=1,
   `A&C`=181,
   `B&C`=219,
   `A&B&C`=20);
setlist <- counts2setlist(overlaps)
The resulting setlist is shown in Figure 4.10 as a
Venn diagram (left), and Euler diagram (right).
It uses custom set_colors to match the published figure.
An astute observer may notice that
1is missing in the Euler diagram.
This may be a good time to point out that the Euler diagram can also be rotated, see Rotate the Venndir.
bisogno_colors <- c(A="firebrick2", B="dodgerblue", C="#BBBBBB")
v <- venndir(setlist,
   set_colors=bisogno_colors)
ve <- venndir(setlist,
   proportional=TRUE,
   set_colors=bisogno_colors)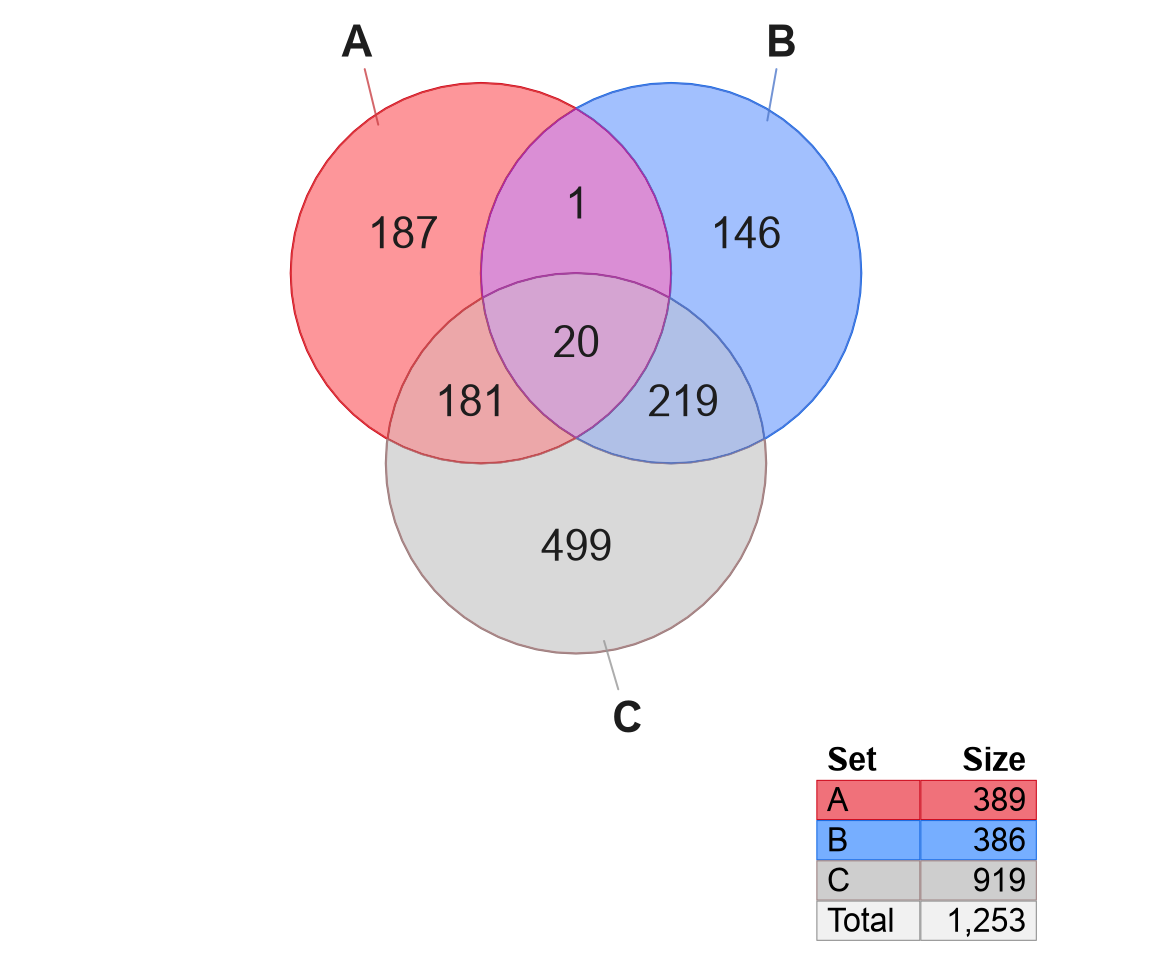
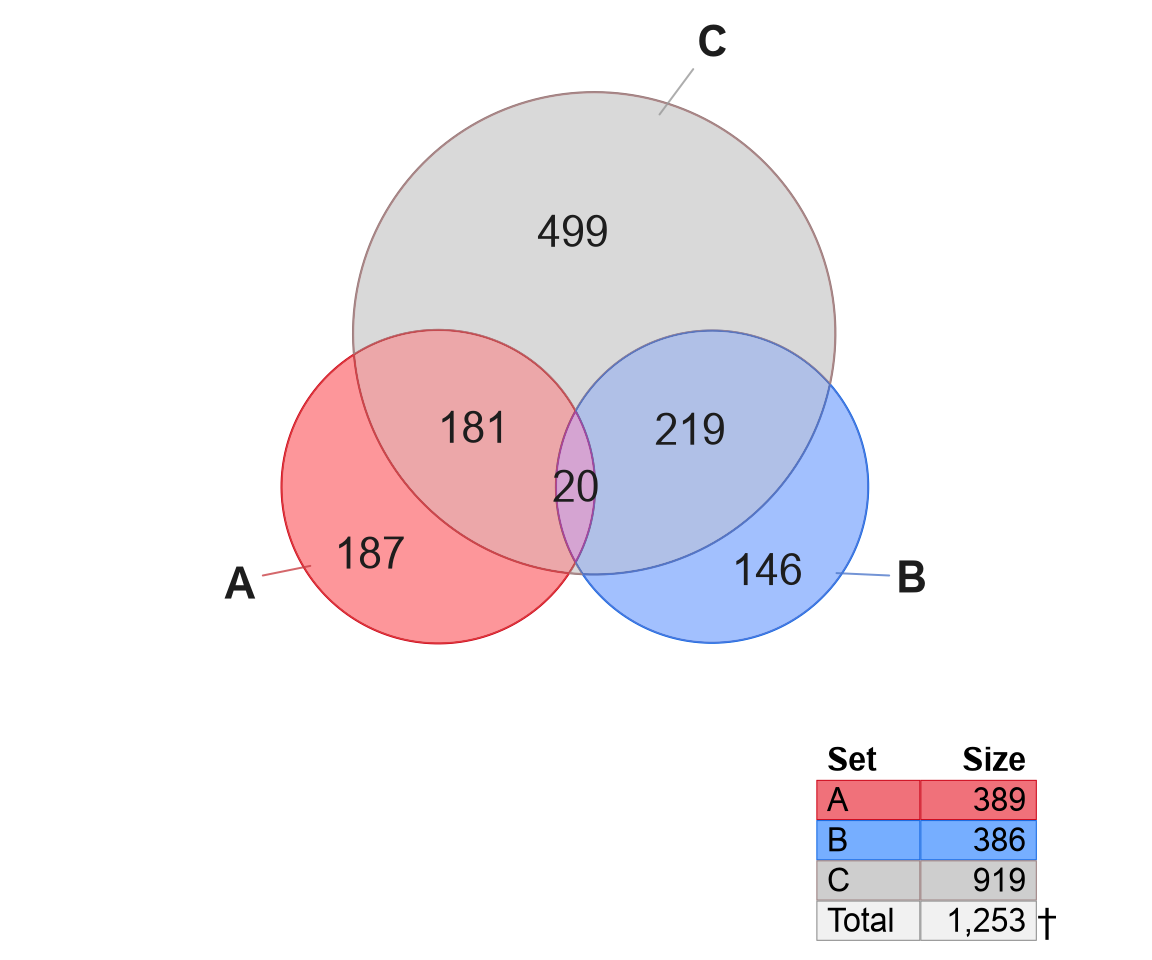
Figure 4.10: Venn diagram using test data from Bisogno et al, as Venn (left) and Euler (right) diagrams. Notice the footnote in the bottom-right corner of the Euler diagram.
Discover hidden counts with warnings(ve):
## Warning message:
## In "A&B" : 1
The output means there is one overlap 'A&B' with 1 item which is not
displayed.
Recover overlaps using overlaplist(ve). The output list provides a
convenient way to summarize size of overlap by using lengths(),
shown below.
##     A     B     C   A&B   A&C   B&C A&B&C
##   187   146   499     1   181   219    20
Adjust is shown in the next section Nudge Venndir Circles, which allows moving the Euler circles to create the geometry for overlap labels.
Optimize is beyond scope of Venndir, and is discussed in the R package eulerr documentation (Larsson 2024).
4.8.1 Nudge Venndir Circles
The example in Hidden Overlaps Figure 4.10 illustrates a weakness in using proportional Euler diagrams, while also showing a straightforward alternative. The Venn or Euler circles used can be nudged, prior to being used for visualization.
In the example, the overlap 'A&B' is not represented in the
Euler diagram returned by eulerr, therefore the label 1
cannot be displayed. Two possible solutions:
- Move A and B closer to each other so they overlap outside C.
- Move C higher so that A and B overlap outside C.
The argument circle_nudge should be passed to venndir() in order
for the geometry to be adjusted before the Venn overlap labels
are assigned to the corresponding overlap regions.
This argument should be a list, where each element is named
using the set name. Each element should be a numeric vector
with two values, the x and y coordinate adjustment.
The example in Figure 4.11 moves set 'A'
to the right, and set 'B' to the left.
ve <- venndir(setlist,
   proportional=TRUE,
   set_colors=bisogno_colors)
vn <- venndir(setlist,
   circle_nudge=list(A=c(1, 0), B=c(-1, 0)),
   proportional=TRUE,
   set_colors=bisogno_colors)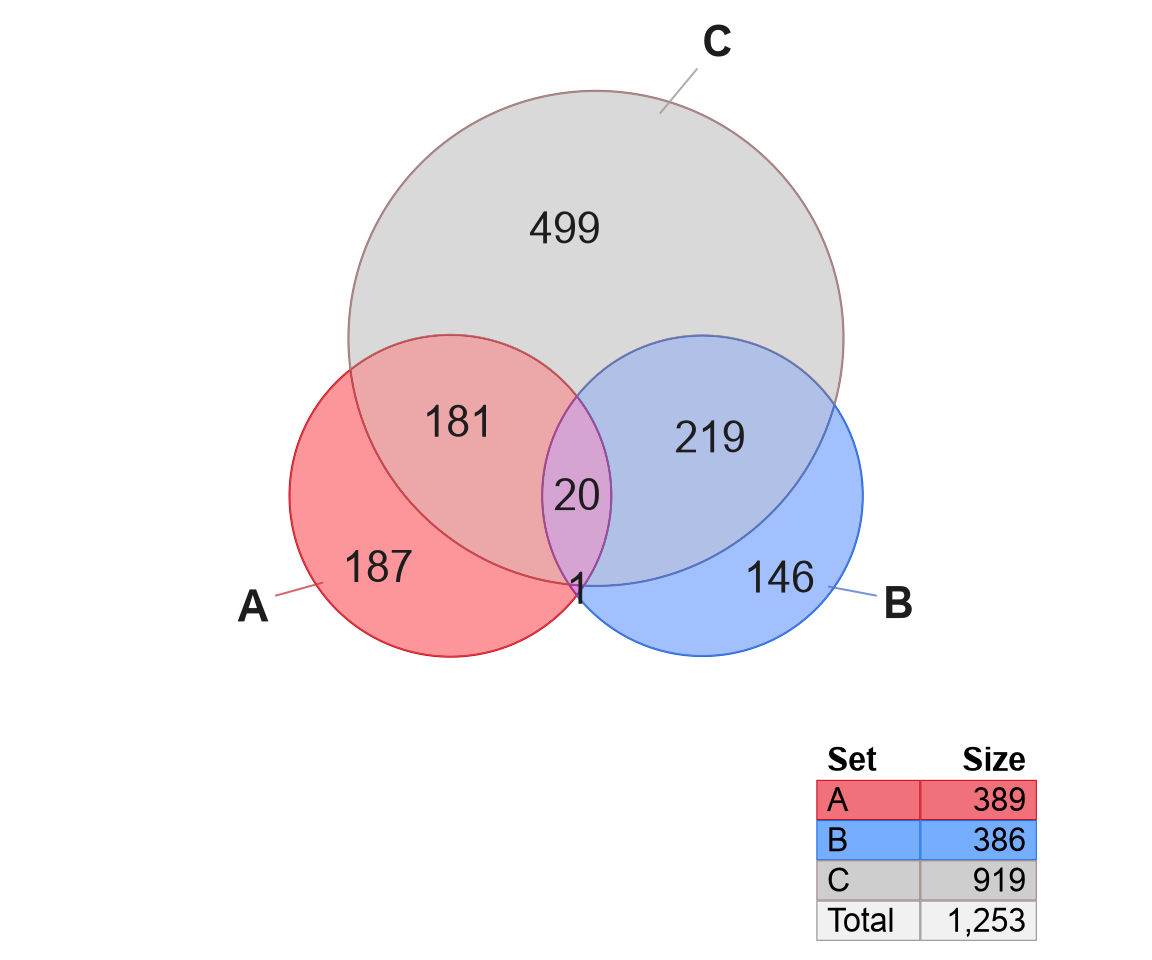
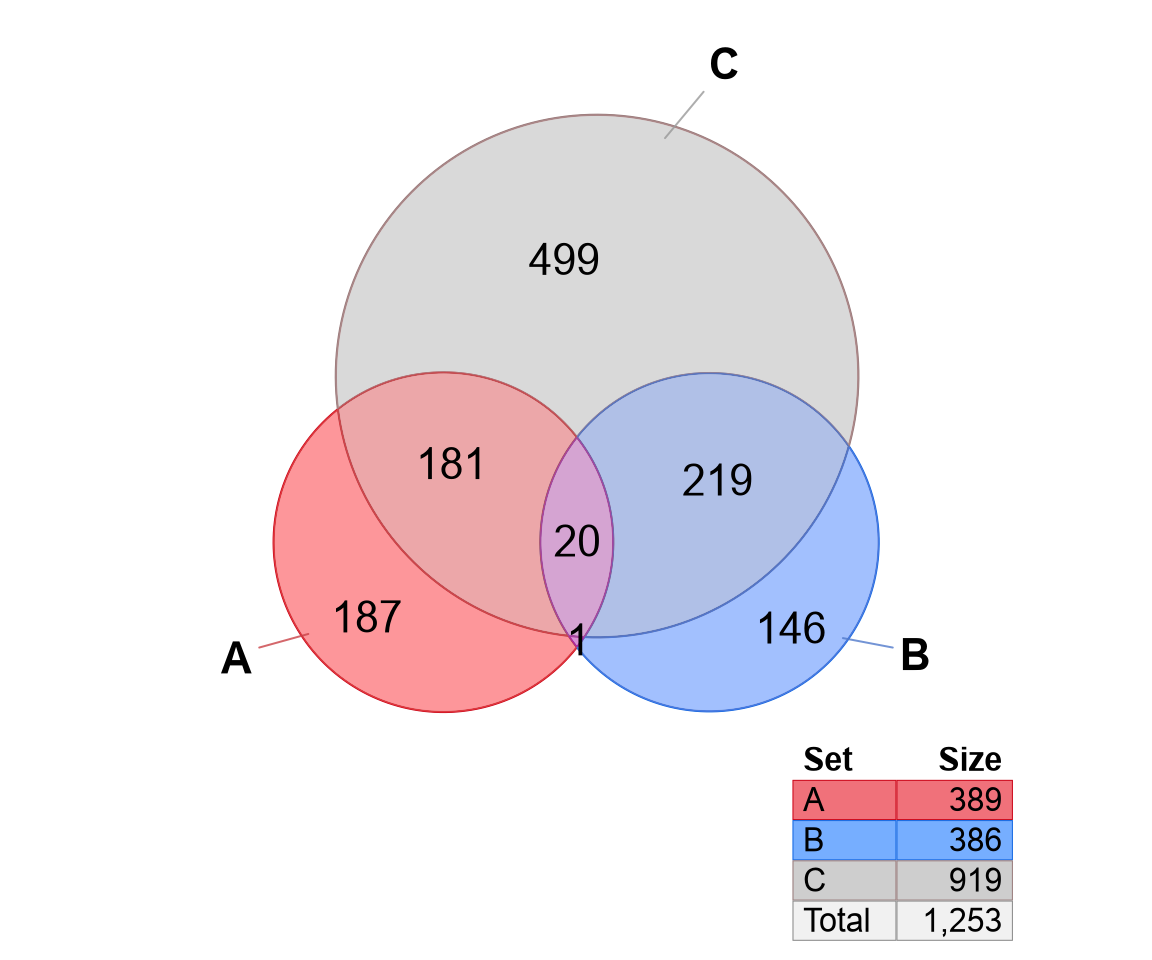
Figure 4.11: Venn diagram showing the default Euler (left) with footnote, and nudged circles (right) with no footnote indicated. The overlap for 'A&B' now shows 1 count.