Chapter 1 What is a Venn diagram?
A Venn diagram is a deceptively simple figure, intended to compare two or more sets in a visually intuitive way.
Each set is represented by a circle, drawn with a label beside it.
Two circles are shown below for sets A and B, and these circles
are drawn so they partially overlap.
The overlapping region represents the intersection of
sets A and B. Using mathematical symbols, the intersect is written
\(A∩B\),
but we use A&B for convenience since the symbol \(∩\)
does not exist on most computer keyboards.
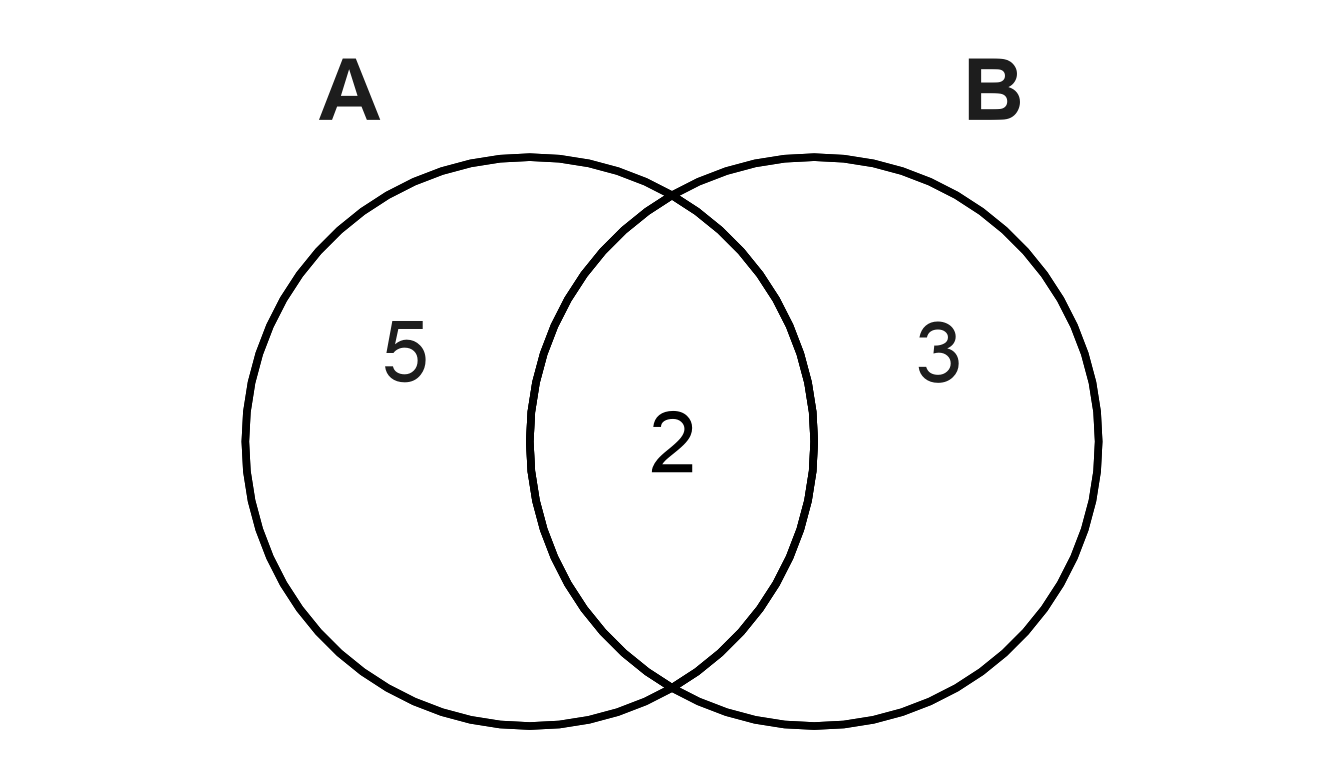
Figure 1.1: A simple Venn diagram is shown with two sets: A and B.
The numbers in the Venn diagram represent the number of items in each logical grouping:
- '5' is the number of items in 'A' and 'not B'.
- '3' is the number of items in 'B' and 'not A'.
- '2' is the number of items in 'A' and 'B'.