4.7 Nudge the Legend
The legend placement is defined by legend_x when calling venndir(),
render_venndir(), or plot(); or defined by x when calling
venndir_legender() separately. This argument takes character string
with combinations of 'top', 'bottom', 'left', and 'right'.
Two words can be used, for example the default legend_x="bottomright"
places the legend in the bottom-right corner of the grid viewport.
The Venndir viewport is defined to be square, to maintain 1:1 aspect ratio, and to make sure circles maintain their shape. As a result, sometimes there is whitespace on the left/right sides, or top/bottom edges.
The legend is 'inset' from the exact outer edge using arguments
x_inset and y_inset, and these arguments can be passed through '...'
ellipses from venndir() to modify the legend. The default places
the legend '2 lines' inside the viewport border, using 2 character
lines of text as the unit. Any valid grid::unit can be provided,
however a good starting point is to adjust by units of 'lines'.
v3a <- venndir(make_venn_test(),
   proportional=TRUE)
v3b <- venndir(make_venn_test(),
   x_inset=grid::unit(-5, "lines"),
   proportional=TRUE)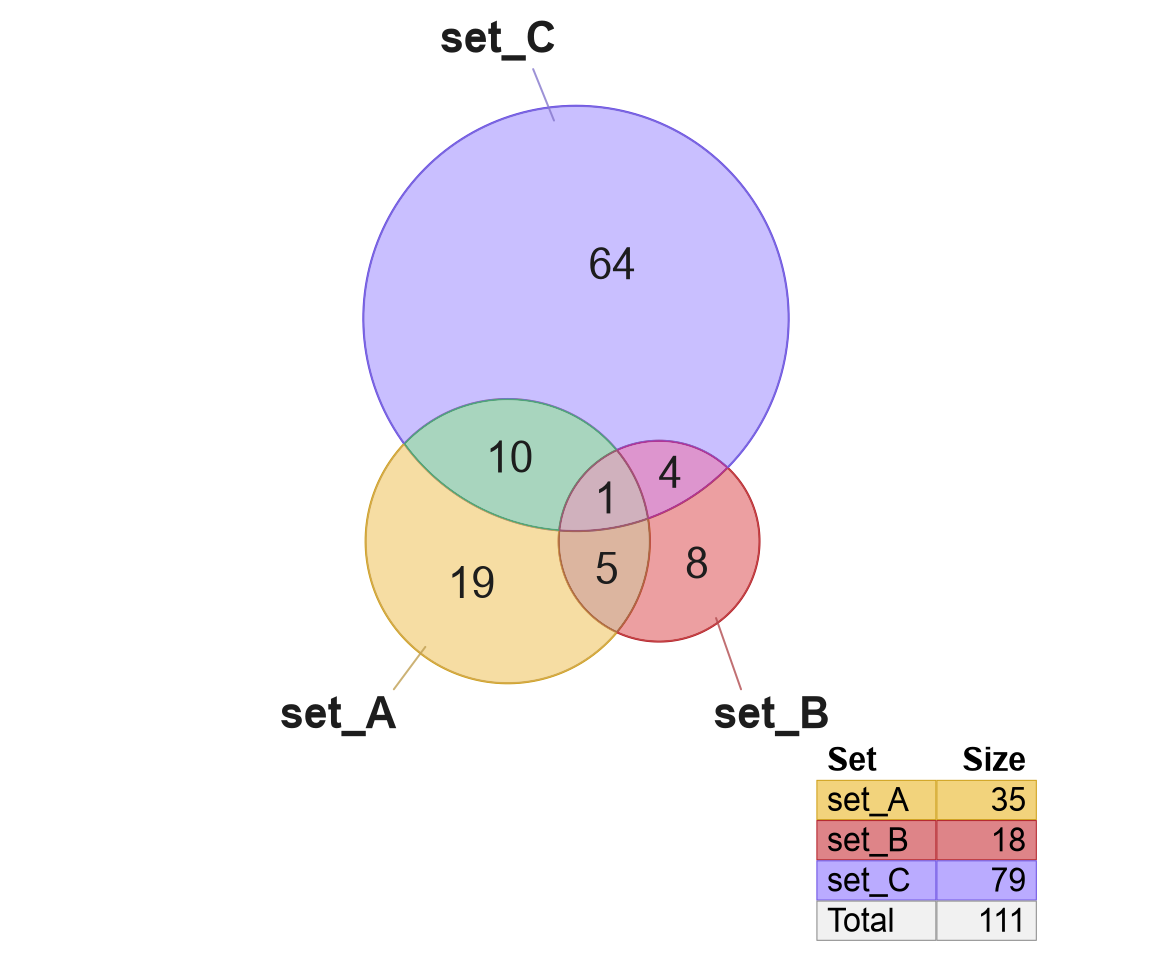
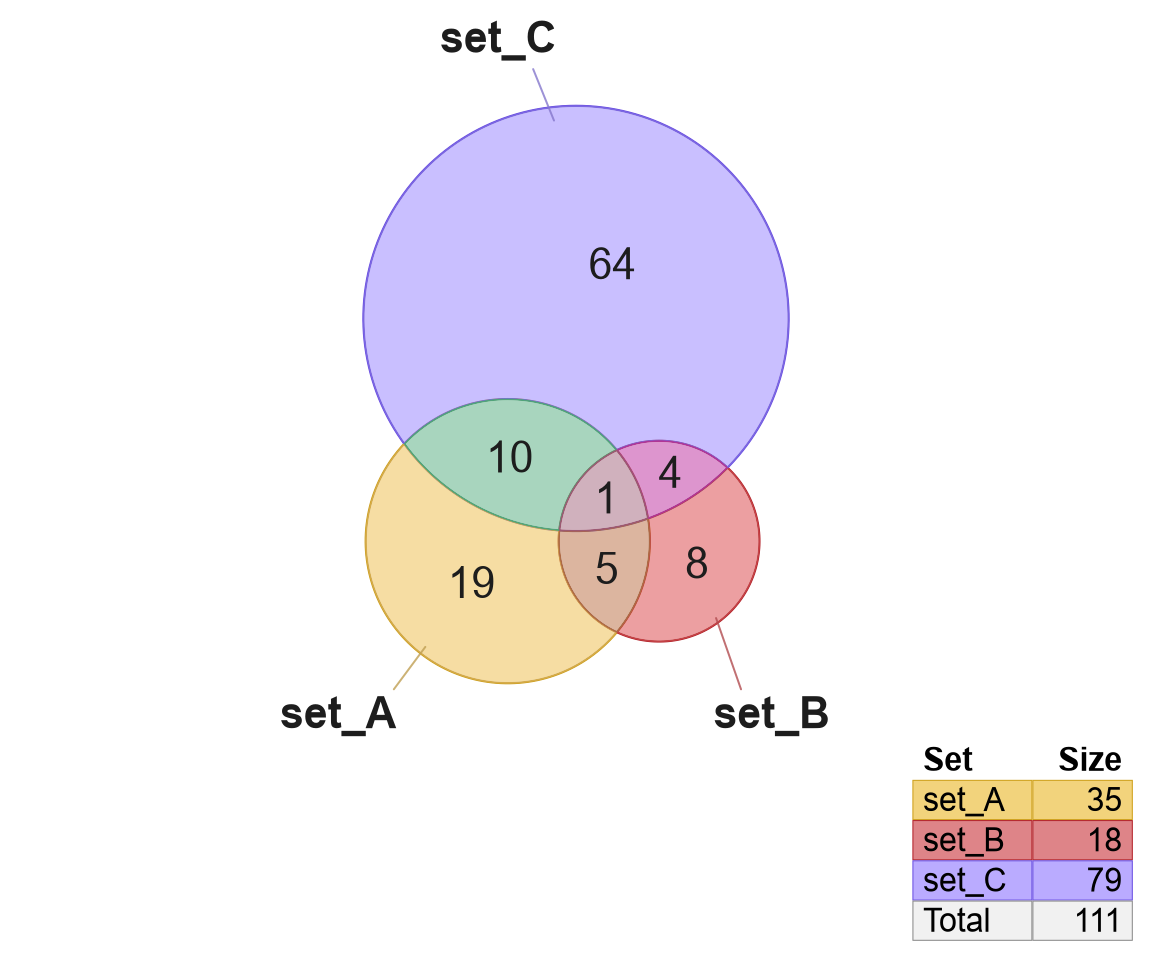
Figure 4.9: Two Euler diagrams showing default legend (left) and legend nudged 5 character lines (right).