3.3 Venndir Labels
3.3.1 Label Content
The term 'label' may refer to many elements of a Venndir figure. Of course, the sets have labels, and Venn overlap counts have labels. When using signed data, there are also signed count labels. There are also optional labels such as percent overlap, and even individual item labels. In future, there may be additional labels such as Jaccard overlap, Kruskal's directional concordance, or z-score of directionality.
There are so many types of labels, it became unwieldy to assign
a separate function argument for each label, which is why
labels are controlled by one argument: show_labels.
Table 3.1 describes each type of label, and the letter assigned to each.
(fig:label-table) Summary of recognized options for the argument show labels.
| Label | Letter | Notes |
|---|---|---|
| Name | 'N' or 'n' | The set name provided in 'setlist'. |
| Count | 'C' or 'c' | The count of the number of items in each Venn region. This label is sometimes referred to as 'main count' or 'overlap count'. |
| Signed | 'S' or 's' | The count of the number of items by each observed combination of signs. |
| Percent | 'P' or 'p' | The percent of items in each Venn region, related to the total items represented in the diagram. |
| Item | 'i' | The item labels represented in each Venn region. Items can only be displayed inside the Venn diagram. |
Including the respective letter will enable that label. Using UPPERCASE places the label outside, and using lowercase places the label inside the Venn diagram.
The default show_labels="Ncs" places the Name outside, then
counts and signed counts inside.
Tip:
A good default to include the percentage is show_labels="Ncsp".
The percentage is always located with the main counts,
unless main counts are not shown.
Currently, item labels can only be placed inside. It is possible to place item labels in a table outside the Venn diagram, however it involves advanced techniques.
Figure 3.13 illustrates common examples for show_label,
showing how the components of each label are grouped together.
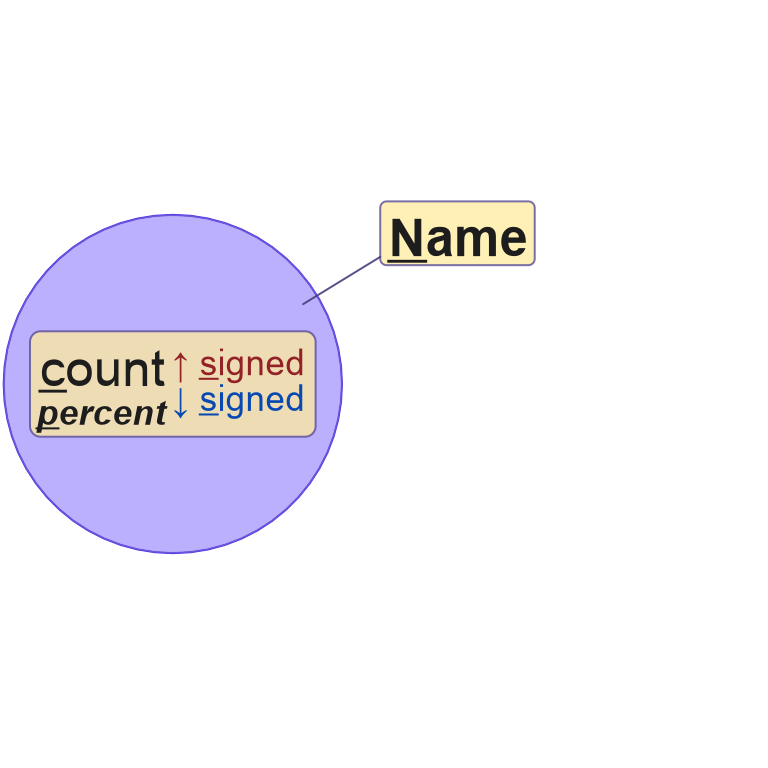
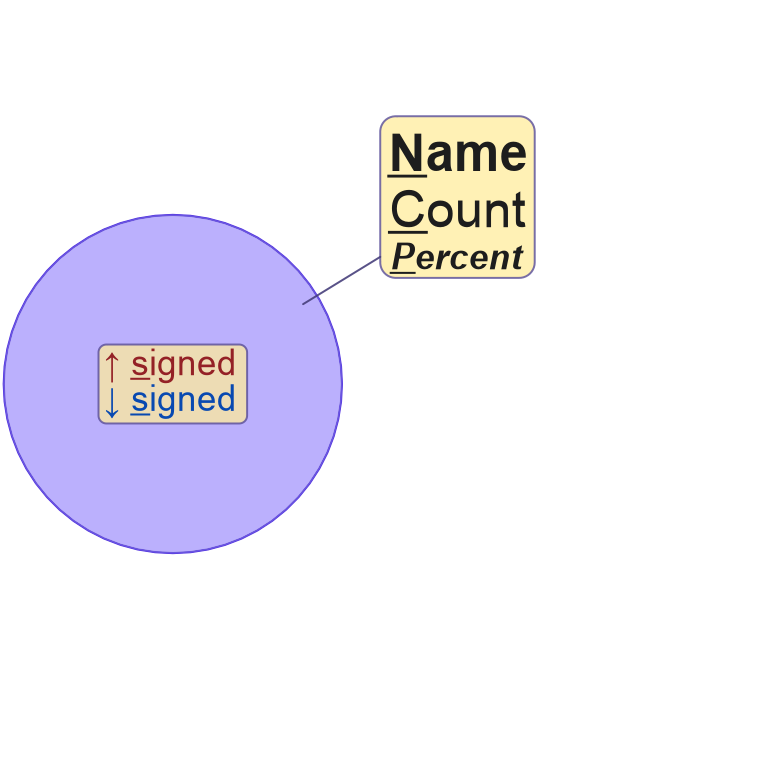
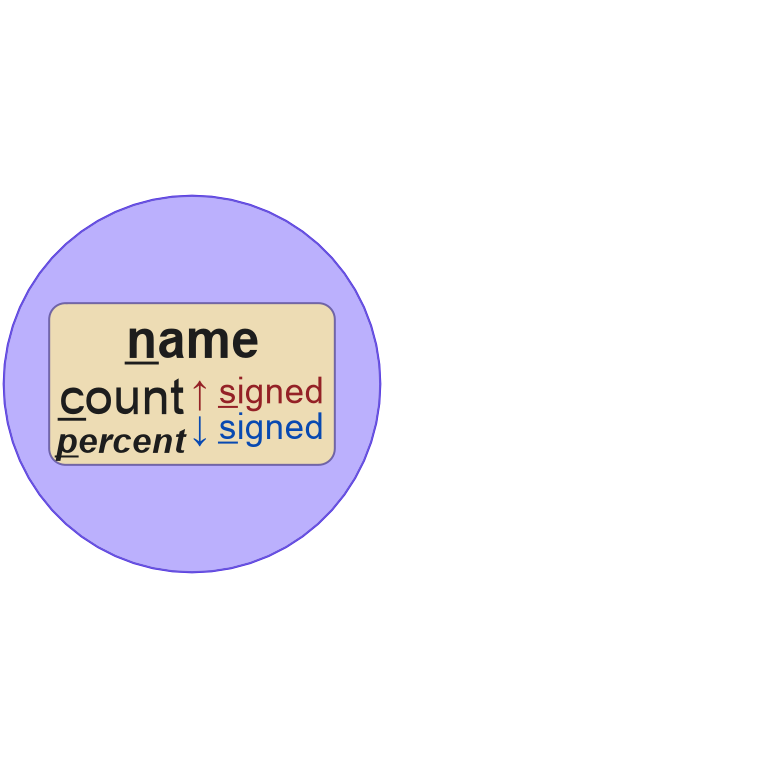
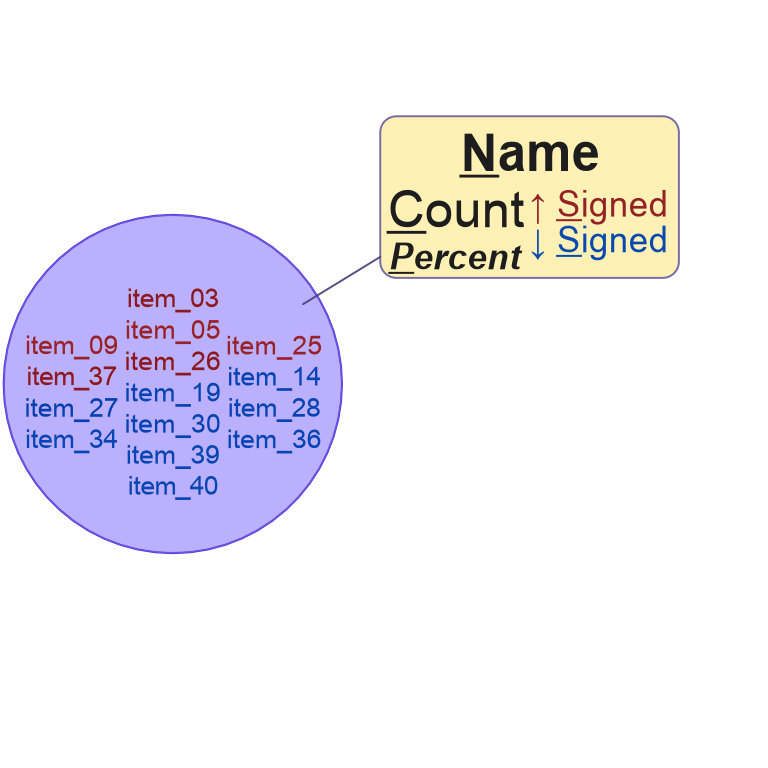
Figure 3.13: Four examples of various Venndir labels, placed inside or outside each figure. The label components are grouped by location, then organized in a defined way.
3.3.2 Overlap Type
The argument overlap_type provides different approaches to
summarize directional overlaps. This option determines which
count labels will be displayed in the Venndir figure.
Table 3.3 summarizes the options for overlap_type.
(fig:overlap-type-table) Summary of recognized overlap types, with a description of the associated output in a Venndir figure.
| overlap_type | Description |
|---|---|
| 'overlap' | Only the summary overlap counts are displayed. |
| 'concordance' | The summary overlap counts are displayed. Signed counts are tabulated for overlaps involving one direction. All other signed counts are summarized with 'X' for discordance. |
| 'each' | The summary overlap counts are displayed. Signed counts are tabulated for each combination of signs observed. |
| 'agreement' | The summary overlap counts are displayed. Signed counts are tabulated based upon agreement or disagreement of the directional sign. |
- When the input
setlistis not signed,overlap_type='overlap'is the default. - When the input
setlistis signed,overlap_type='concordance'is the default.
Figure 3.14 illustrates the four values for
overlap_type.
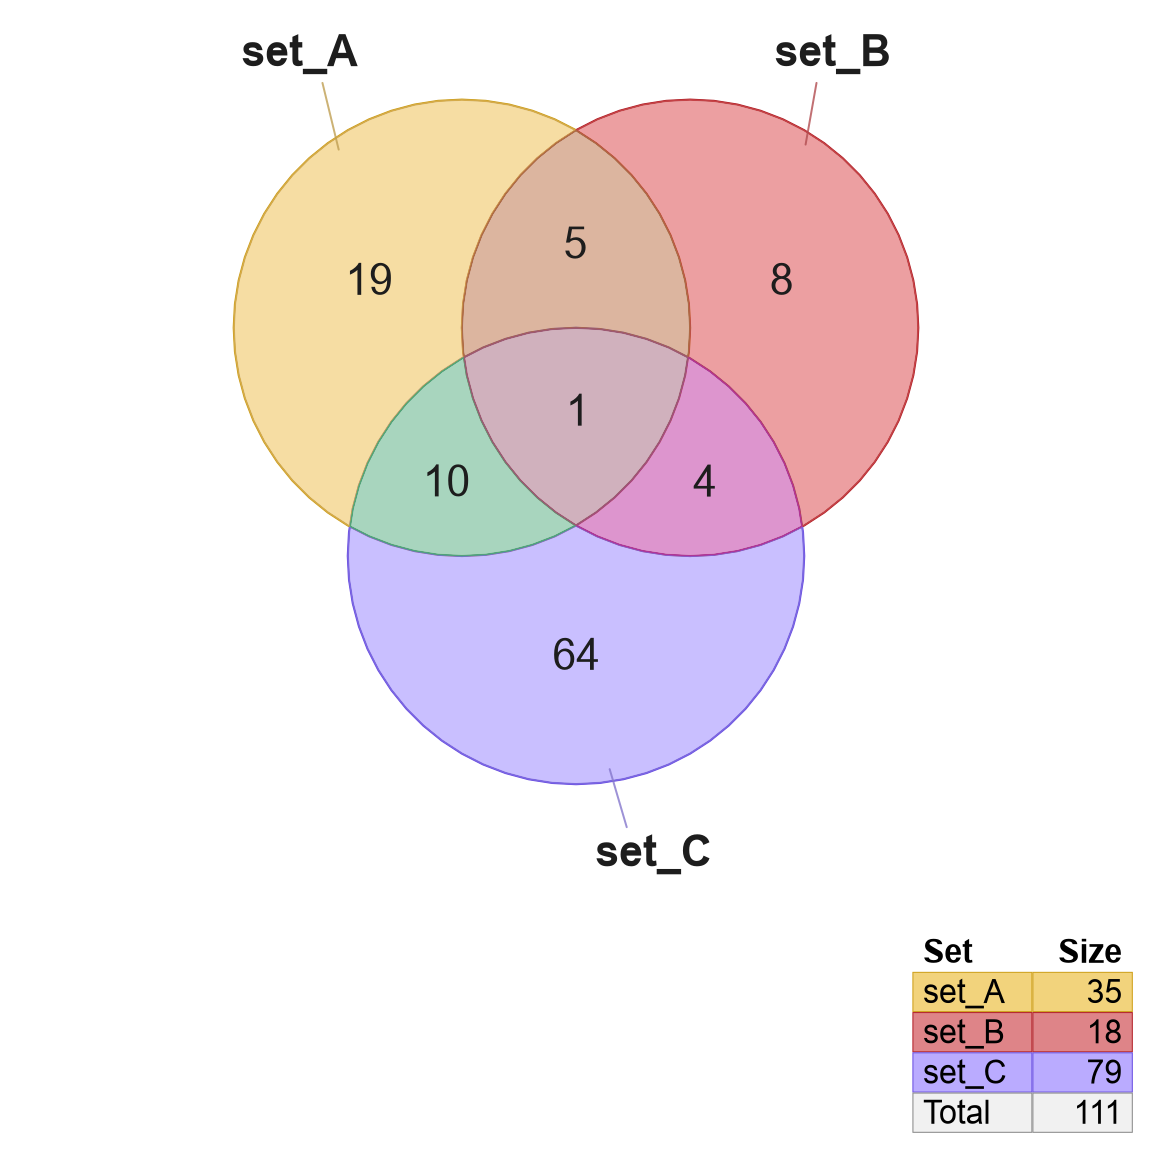

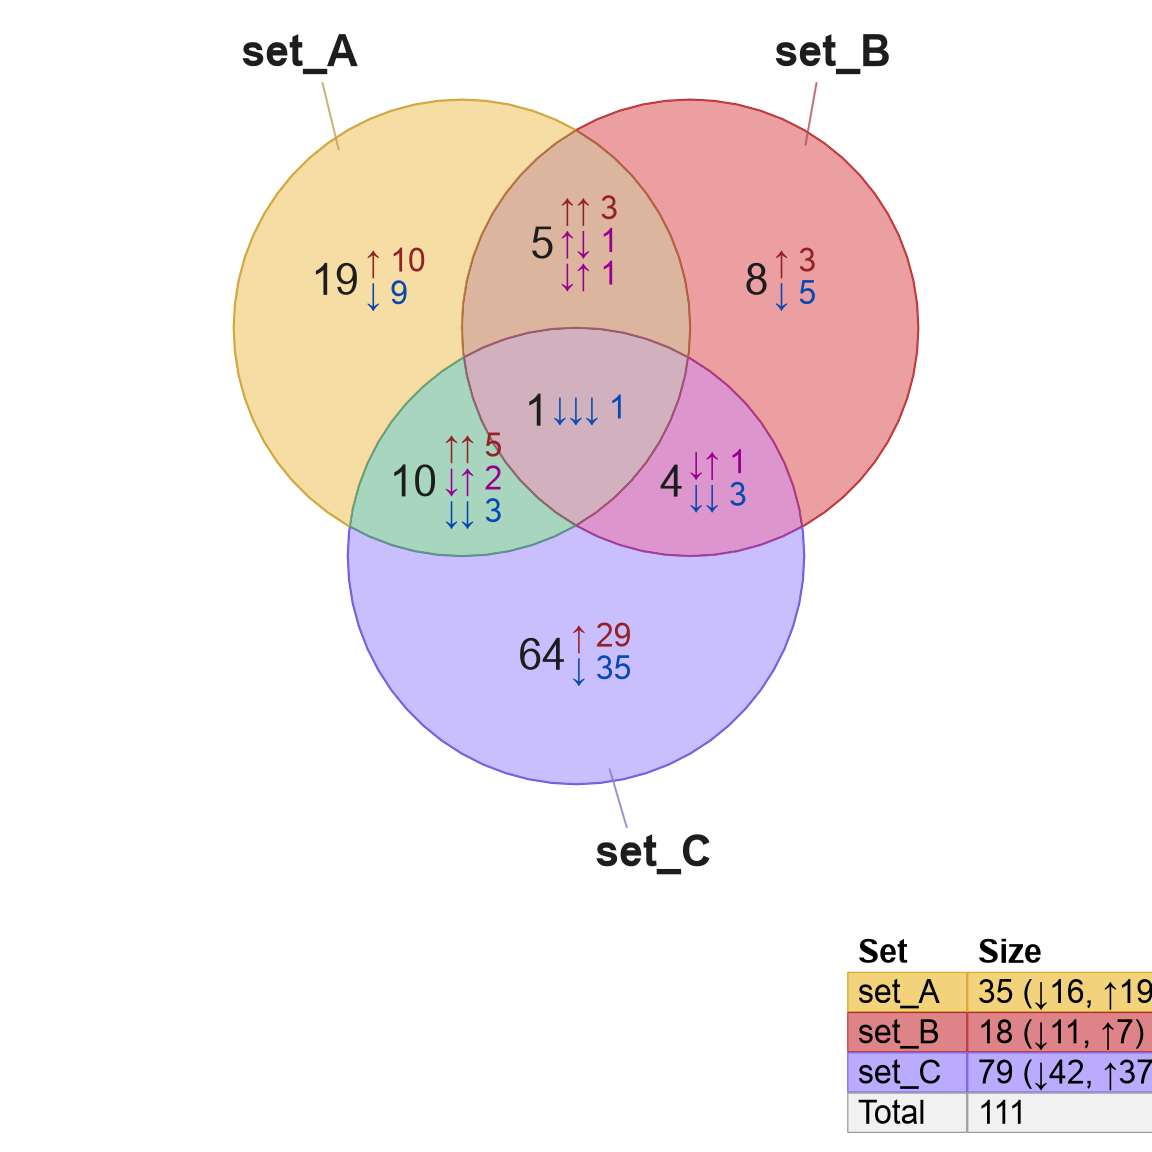

Figure 3.14: Venn diagrams showing four overlap types recognized: 'overlap' (default for non-signed data), 'concordance' (default for signed data), 'each', and 'agreement'.
3.3.3 Signed Label Placement
Signed count labels are placed beside main count labels by default, however they can be placed below main count labels.
The argument template controls the signed label placement,
and there are two options, illustrated in Figure 3.15.
template='wide'(default) labels signed counts beside main overlap counts.template='tall'labels signed counts below main overlap counts.
setlist3 <- make_venn_test(n_sets=3, do_signed=TRUE)
vt1 <- venndir(setlist3)
vt2 <- venndir(setlist3, template="tall")
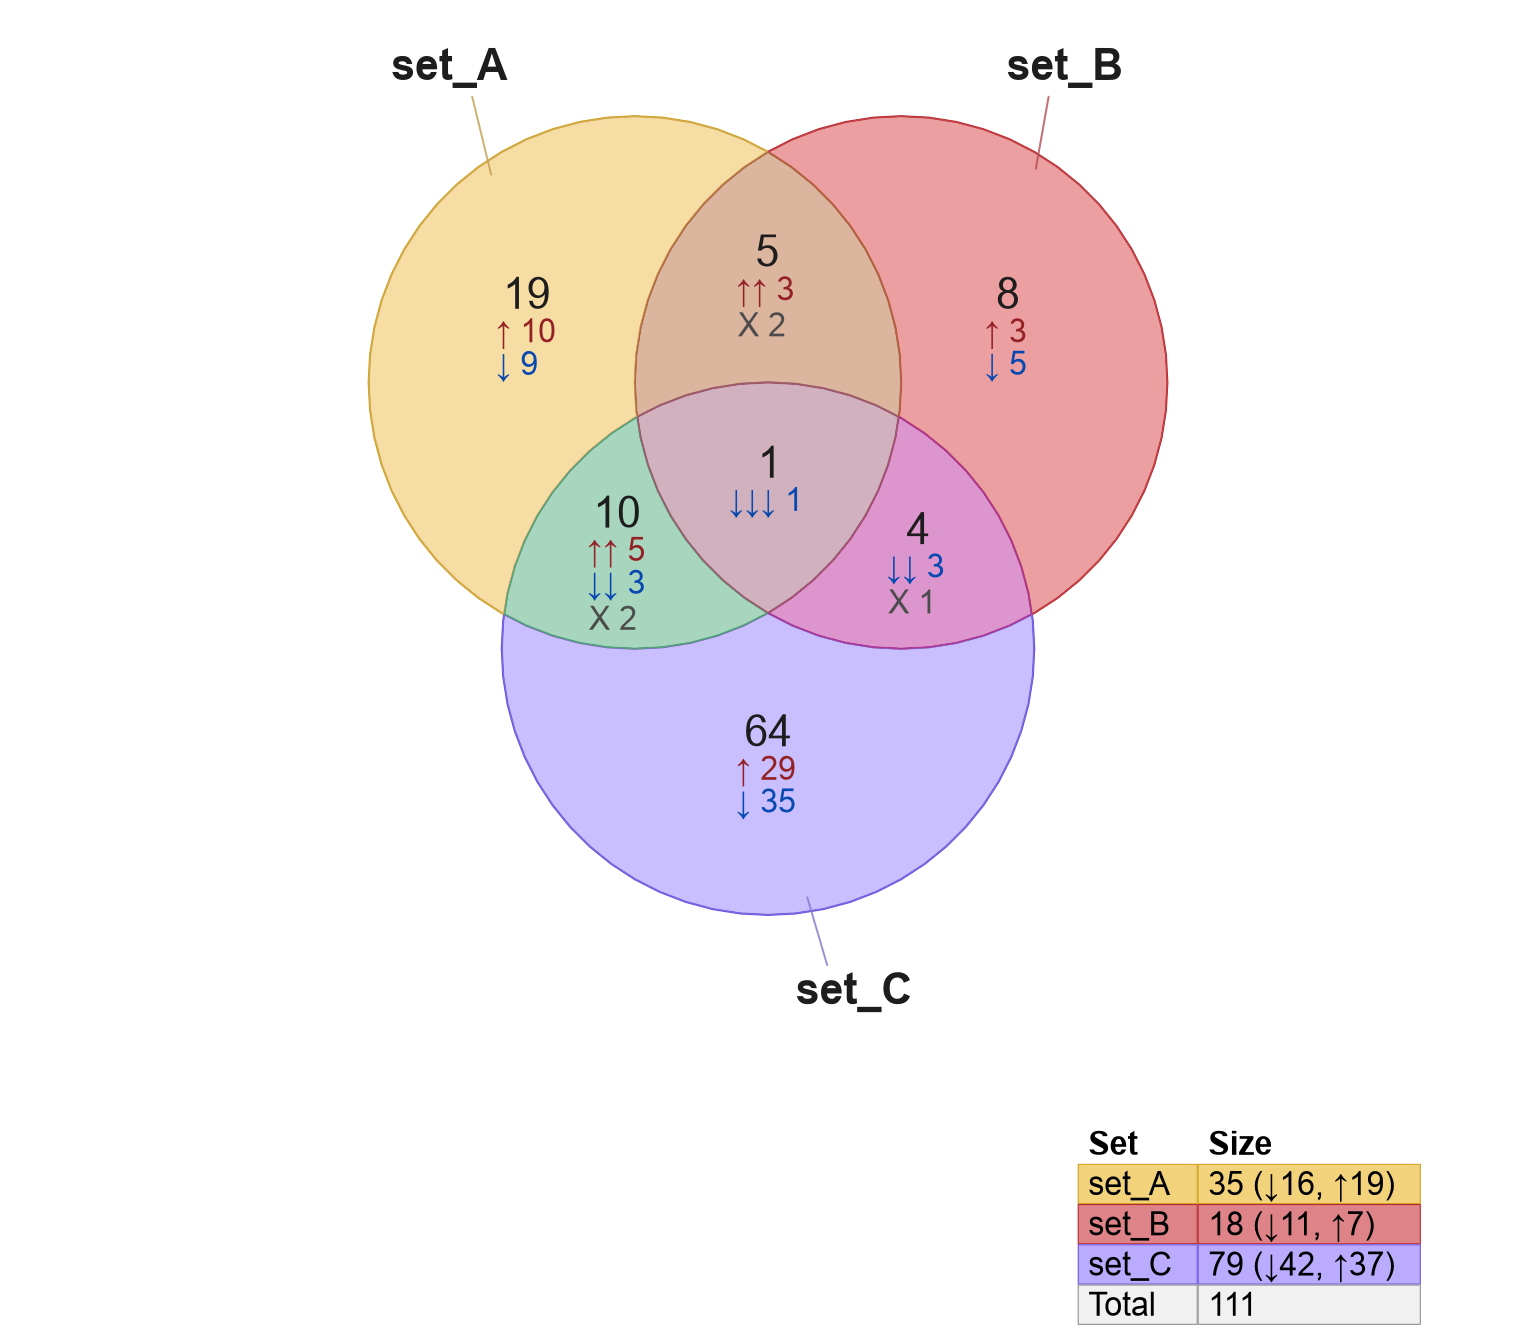
Figure 3.15: Venn diagram with signed counts labeled beside overlap counts (left) using template='wide'; and below overlap counts (right) using template='tall'.
3.3.4 Visual Styles
By default, Venn count and set labels are drawn without any particular
color shading or border. The argument label_style is used to enable
background color fill, and optional border.
The recognized keywords for label_style:
"lite"- light background"shaded"- semi-transparent shaded color background"fill"- full color background"box"- draw a box as a border around the label
A straightforward example is shown in Figure 3.16
using label_style="lite box" with signed counts.
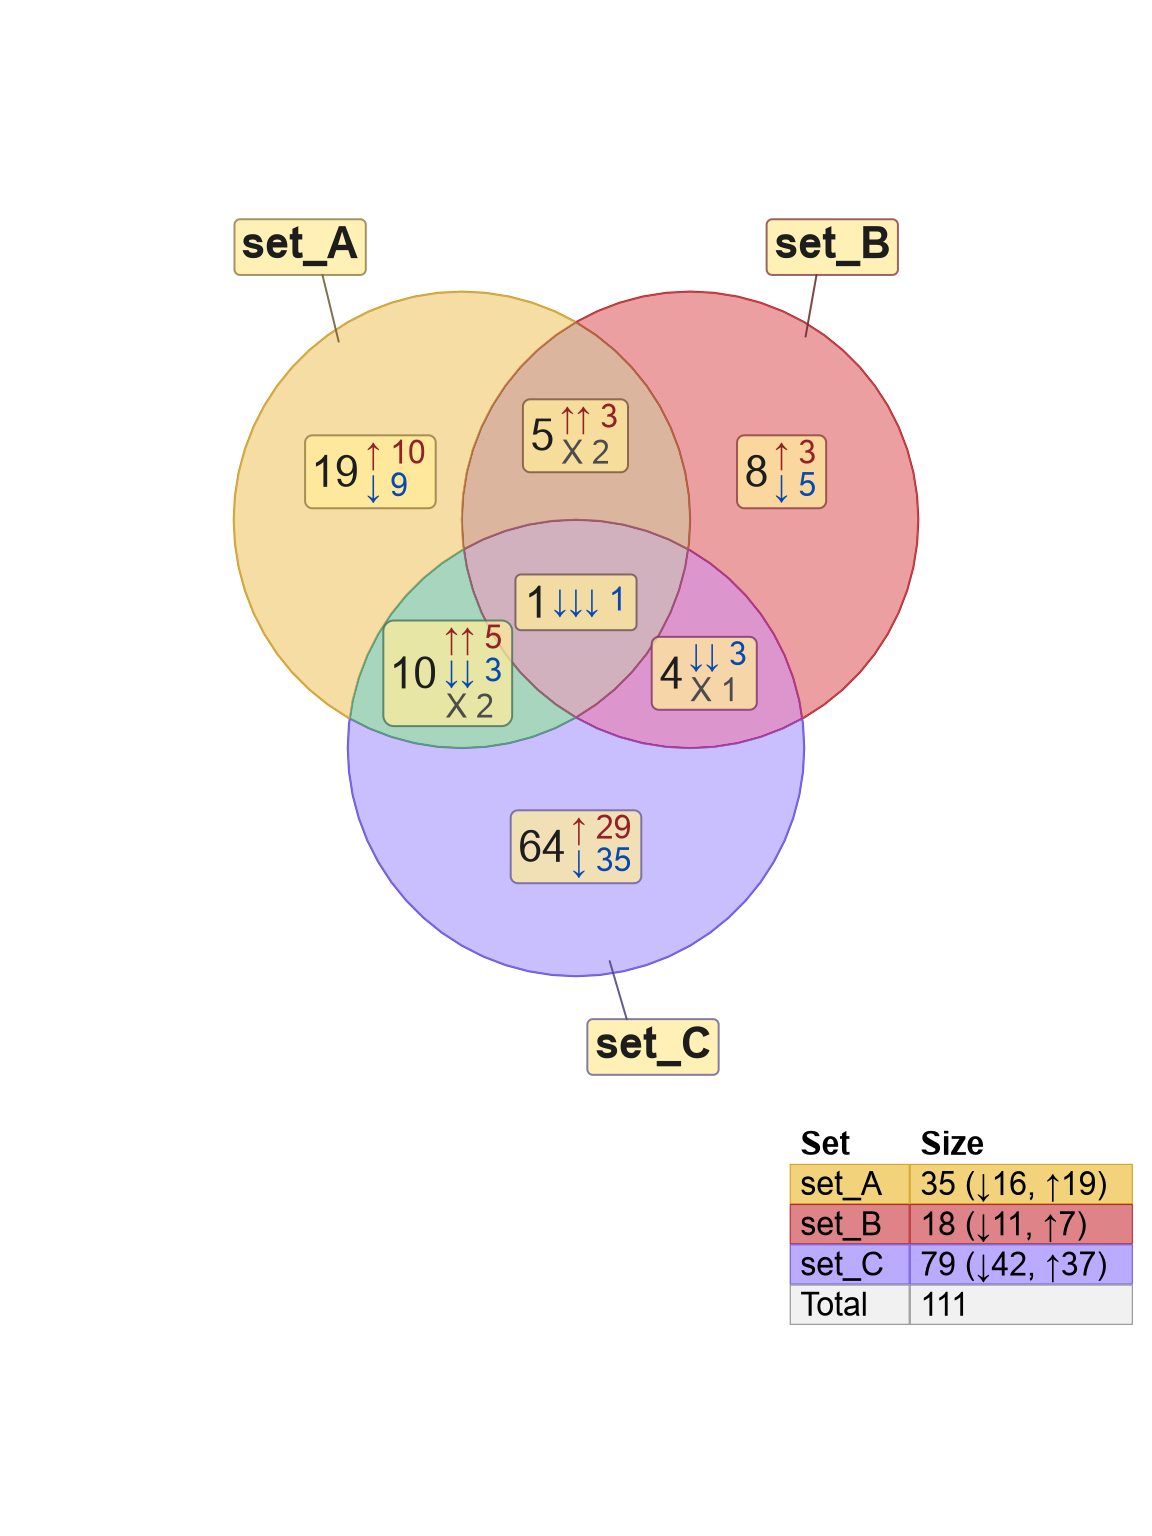
Figure 3.16: Venn diagram showing signed counts, using label style 'lite box'.
Figure 3.17 illustrates several possible styles. In general, when using a fill color with any of the options 'lite', 'shaded', 'fill', it may be preferred to add 'box' to include a visual border. For example, try 'lite box' or 'shaded box'.
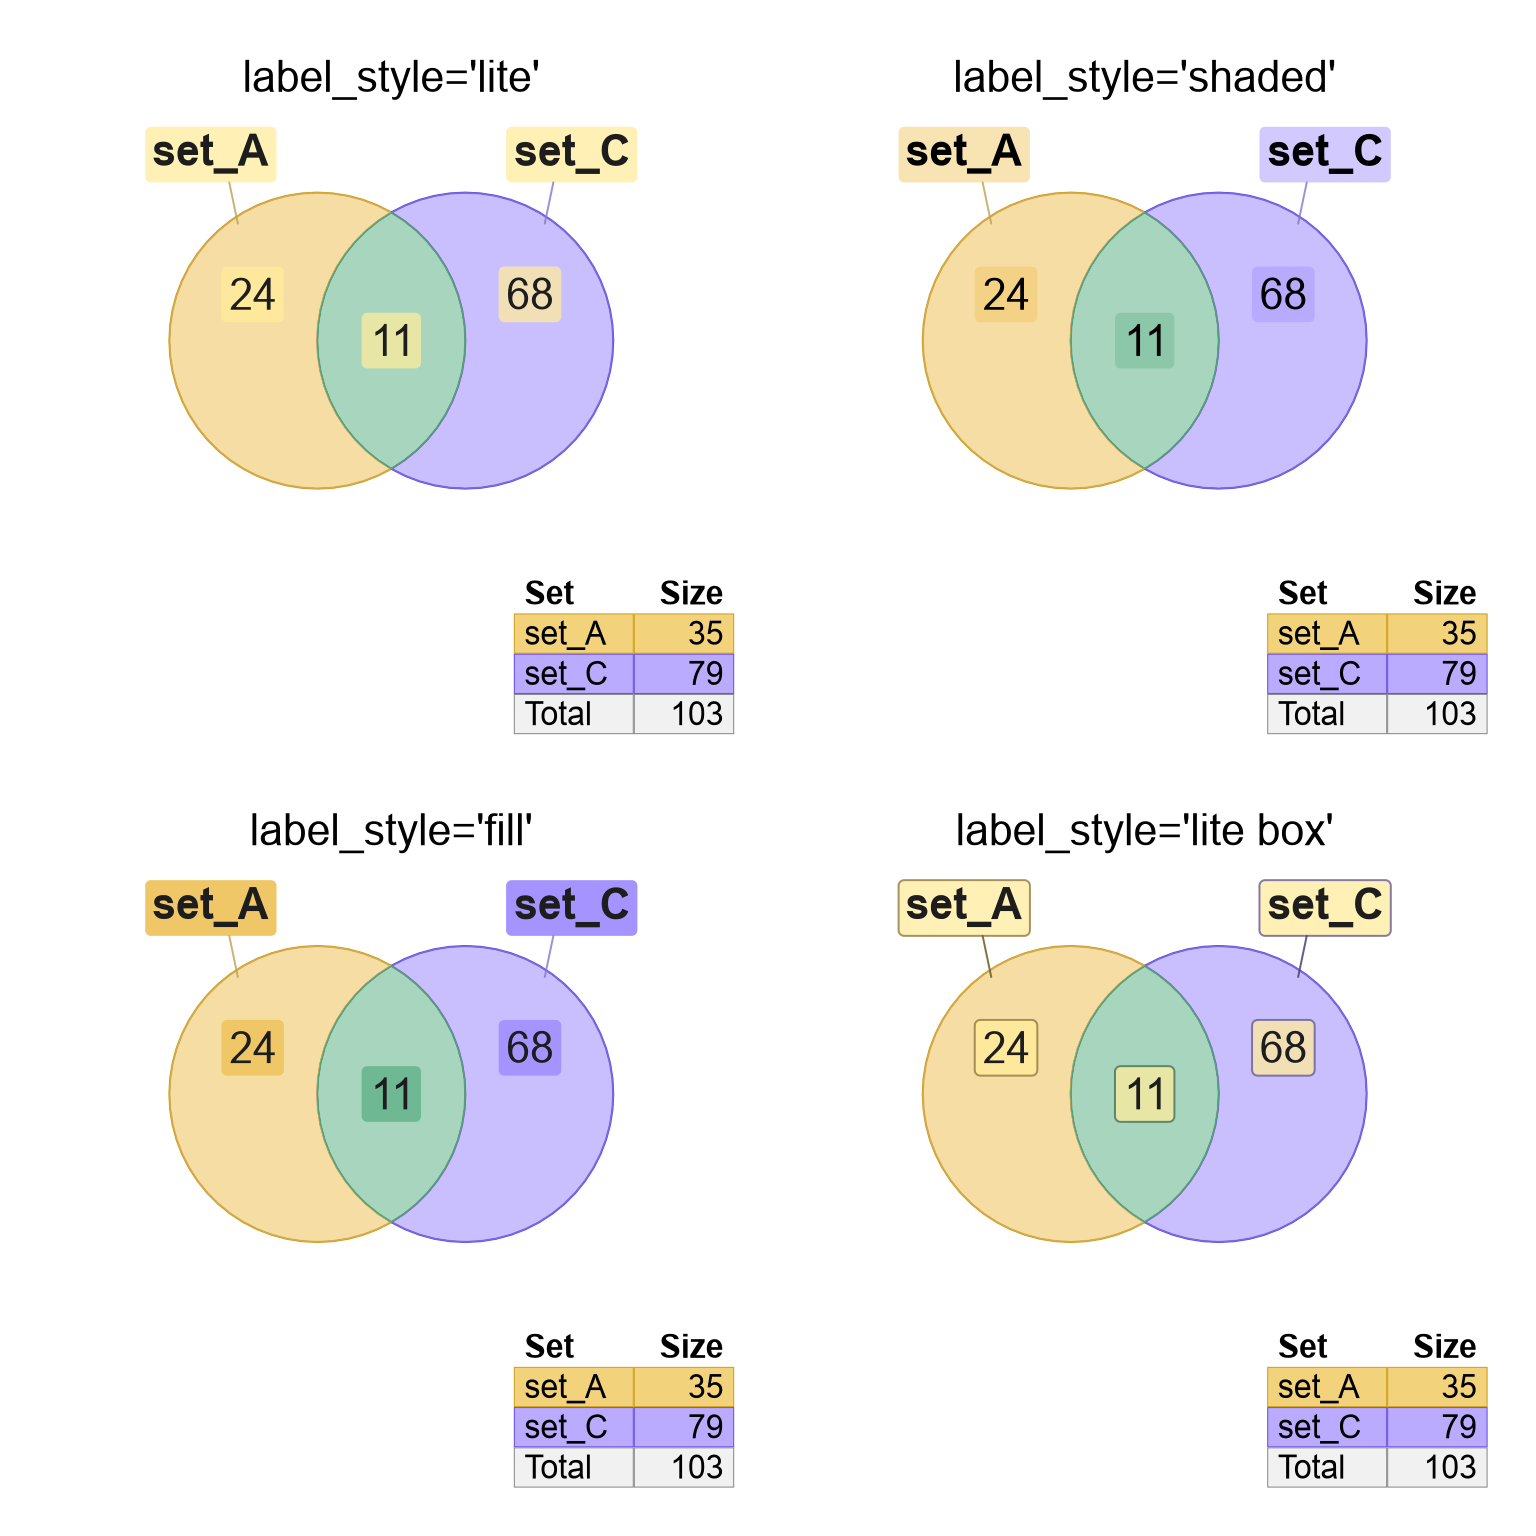
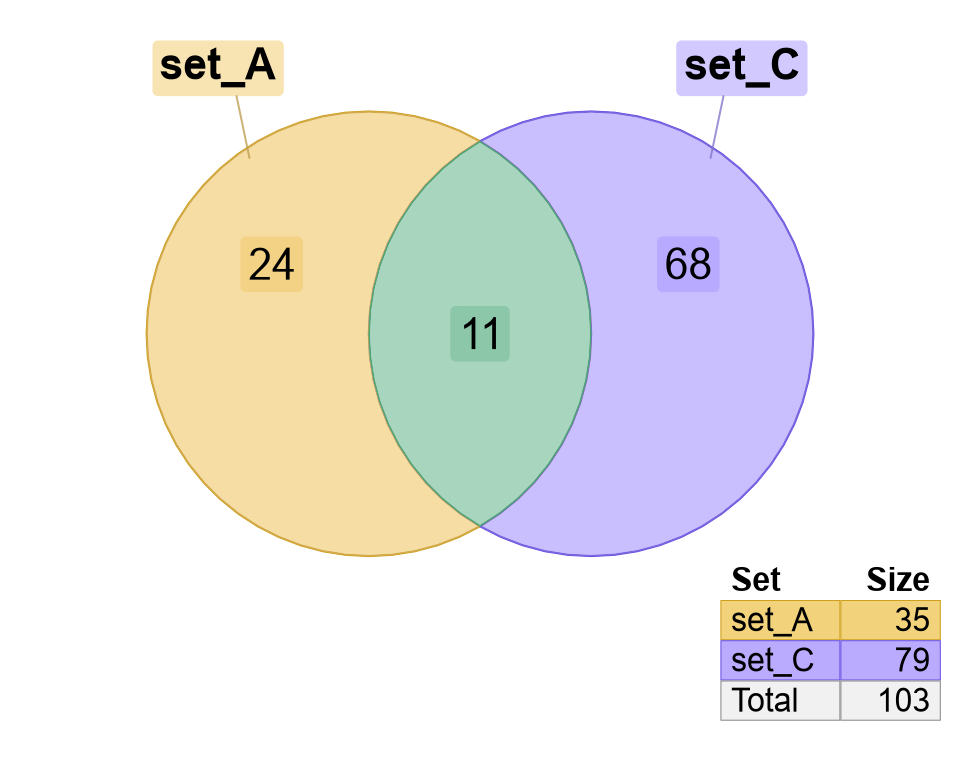
Figure 3.17: Venn diagrams showing the different label style options in each of four panels.
3.3.5 Nudge a Venn Label
To nudge, that is to reposition, one label in a Venndir diagram,
use nudge_venndir_label().
Note that venndir() will define a label position for every Venn overlap,
and defines a position 'inside' and 'outside' the Venn region.
Exception:
Sometimes a proportional Euler diagram cannot represent every overlap, due to geometric constraints. In this case, not every overlap will be assigned a label position.
For a discussion of that issue, see Section 4.8 Hidden Overlaps.
To nudge a label, define the label to nudge using these two arguments:
set- the overlapping region to nudgelabel_location- the inside or outside label associated with that set
The label adjustment uses two coordinates. Units are proportional
to the overall Venndir plot region, where 1 is the full width
or height of the plot, whichever is larger.
x_offsety_offset
The process requires an existing Venndir object.
In the example below, a simple 3-way Venn diagram is stored
in variable v.
The label for 'set_C' is moved left (decreasing the x coordinate),
and up (increasing the y coordinate).
# default Venn
setlist <- make_venn_test()
v <- venndir(setlist)

# nudge 'set_C' up-and-left
v2 <- nudge_venndir_label(v,
   x_offset=-0.45, y_offset=0.25,
   set="set_C",
   label_location="outside")
plot(v2)
Figure 3.18 shows the Venn with
default labels (left), and with the label 'set_C' adjusted (right).
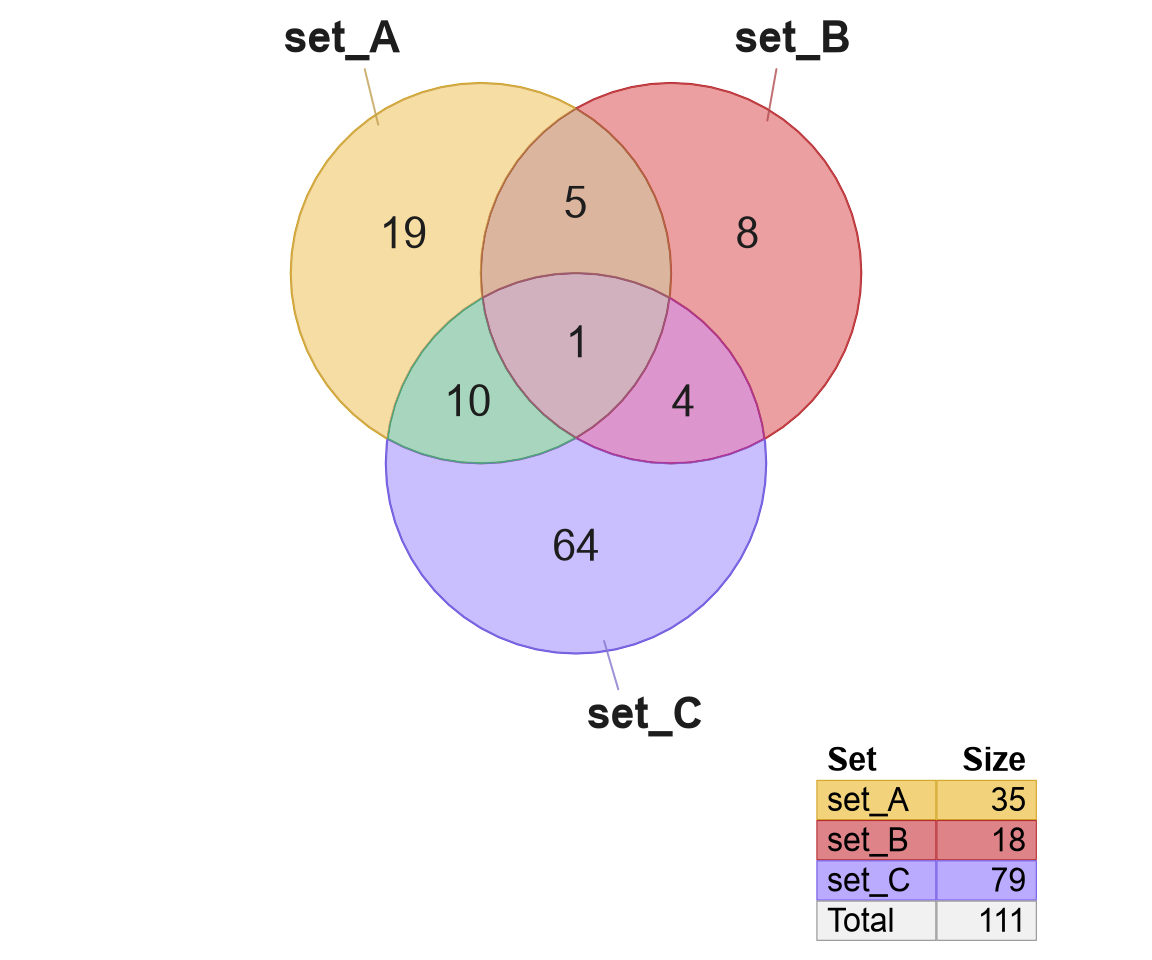
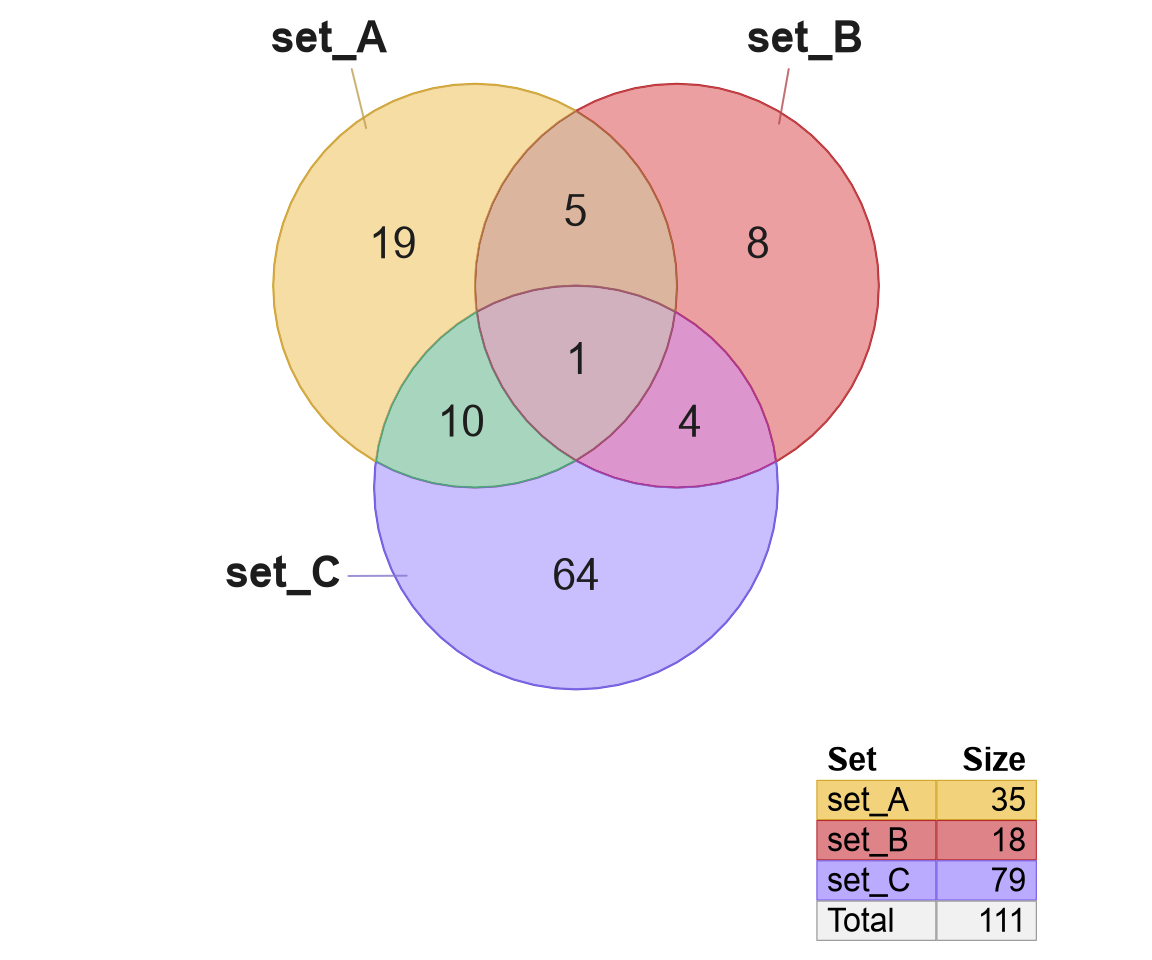
Figure 3.18: Default 3-way Venn diagram (left), with label 'set_C' moved up and to the left (right).
Notice that after the label is adjusted, the new Venndir object v2
can be visualized using plot().
3.3.6 Label Placement Rules
For each Venndir figure, sets are each represented by a circle or ellipse. It should be "easy" to label each circle, right? Experience has shown this to be more difficult than expected.
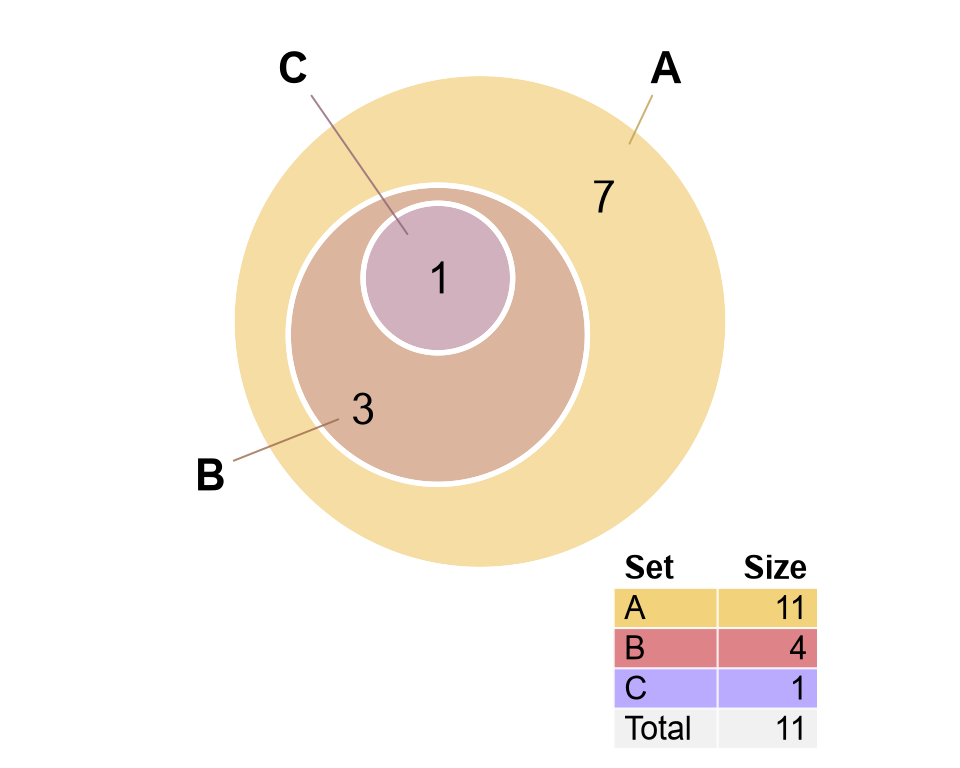
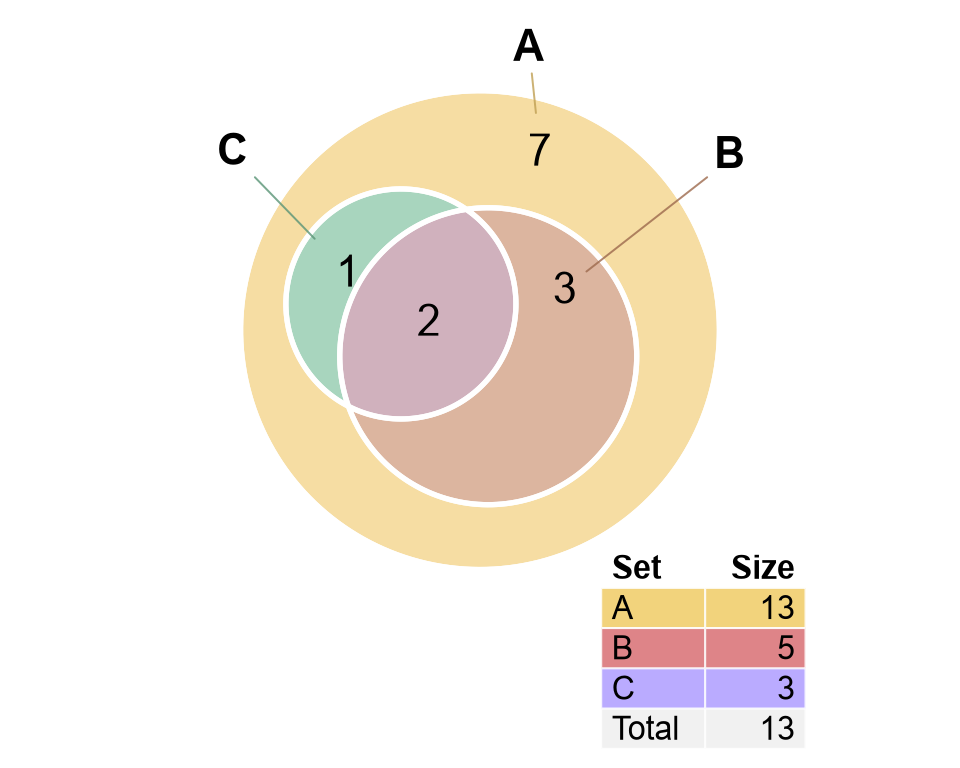
Figure 3.19: Two examples of with very challenging labels.
In Figure 3.19, where should the Set label be placed? Where should the line segments connect?
Specific rules for placing labels in the Venn figure:
Set labels are directed to the most specific region in the figure.
- For Venn diagrams, Set labels refer to the region "unique to set_A", with no other overlapping sets.
- For Euler diagrams, Set labels refer to the region "unique to set_A" if it exists. Otherwise the Set refers to a region containing "set_A" with the fewest overlapping sets.
- In Figure @ref(fig.label-rules) (left) Set 'C' refers to the region inside B and C.
- In Figure @ref(fig.label-rules) (right) Sets 'B' and 'C' each refer to regions as unique to B and C as possible, respectively.
Count labels will only be associated with the specific overlap region.
- If the specific overlap region does not exist in the figure, the count label is not shown. Even though it may seem obvious, sometimes a count label cannot be shown. See Hidden Overlaps.
- If a count label is placed outside, a line segment will connect the label to the corresponding region.
- The argument
inside_percent_thresholdmay be used to place a label outside when the region is small.
Set and Count labels may be grouped together when both are inside or outside.
- When placed inside, a Set label will be grouped with the count label to which the Set label refers, as described in Rule 1.
- When placed outside, a Set label will only appear with a count label that is specific to that Set.
Percentage labels are shown together with main counts when main counts are shown.
- Percentages are calculated directly from main counts, and as a result it is most intuitive for them appear together.
- However, if main counts are hidden, the percentage may be placed inside or outside.
Items labels are only displayed inside, see Item Labels.
- Count labels are "moved outside" if they were enabled inside and items are to be displayed.
- When the number of items exceeds
max_itemsthen items are hidden, and the count labels may be displayed in their place. - Set names may be displayed inside, together with item labels, however no effort is made to prevent overlapping labels. Set labels can be manually nudged, see Nudge a Venn Label.