3.1 Default Venndir
The following steps begin with a setlist, which contains varying
examples for the purpose of demonstrating various features.
To create a setlist, refer to Data Import for detailed
examples.
3.1.1 Data for Testing
Most examples use make_venn_test() to create a setlist.
This function creates simple sets by default,
or signed sets with argument do_signed=TRUE.
The arguments help customize useful characteristics:
n_items=200: Overall number of items in the "universe".n_sets=3: Number of sets.do_signed=FALSE: Whether to create signed sets.concordance=0.5: The directional concordance on a scale of -1 to 1.sizes: Specific sizes for each set, optional.min_size,max_size: Minimum and maximum set size, whensizesis NULL.items: The full universe of items to use, optional.set_names: Specific set names, optional.
3.1.2 Create the Venn
Given a setlist, a Venn diagram is straightforward with venndir().
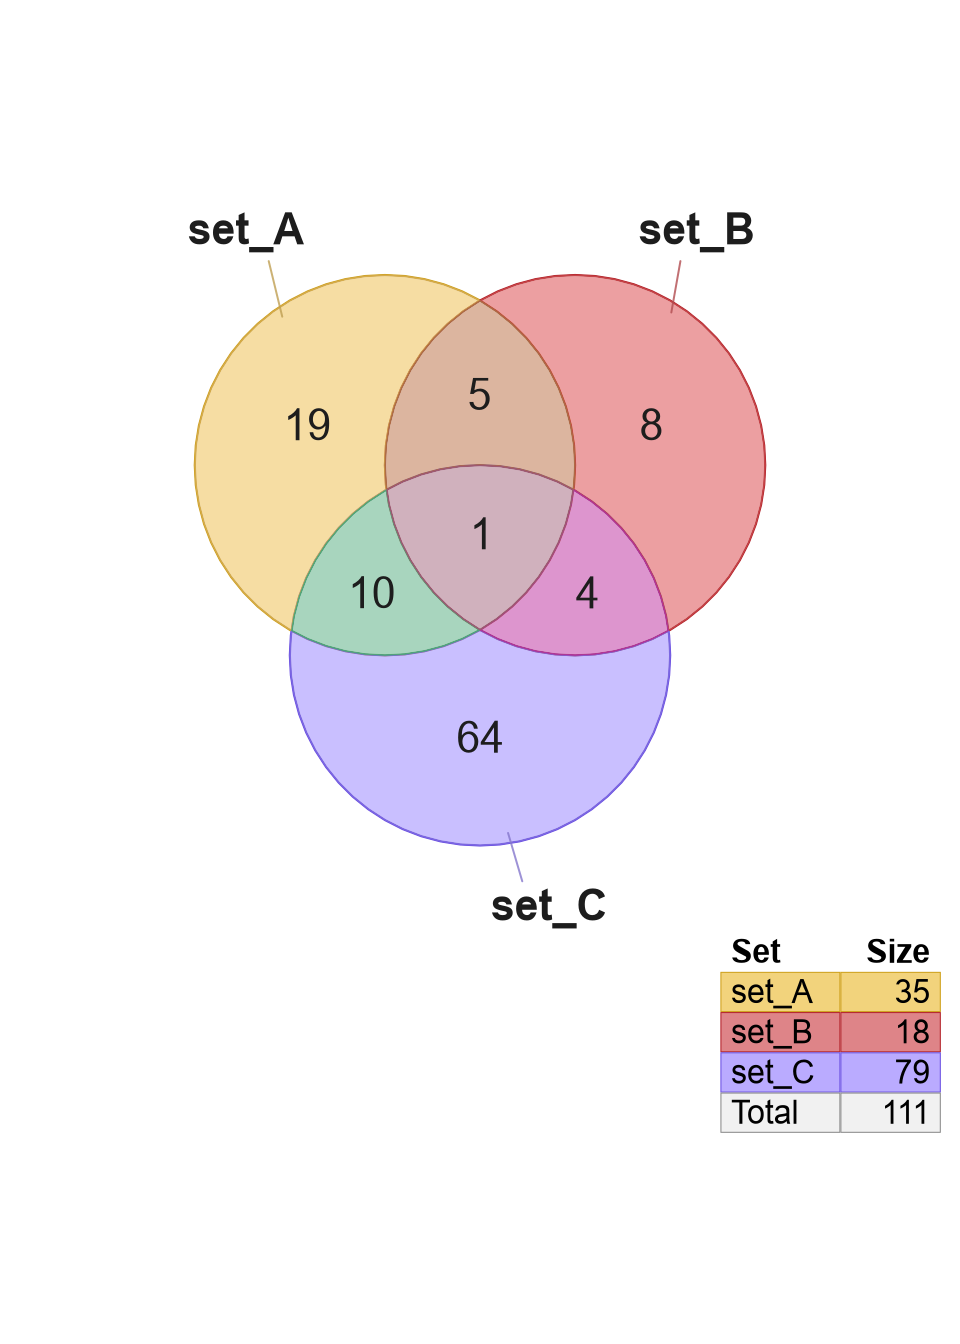
Figure 3.2: Default Venn diagram with three sets.
The output of venndir() is an object with class Venndir,
returned invisibly. Returning the object invisibly means that the
object is not printed to screen, but can be assigned to a variable
if desired.
The Venndir object contains all the supporting data
required to make a figure, in addition to other relevant data that can
be exported for review, or edited to customize the figure.
A Venndir object can be printed which shows a brief summary.
## class: Venndir
## number of sets: 3
## number of polygons: 3 sets, 7 overlaps
## overlap_type: 'overlap'
## sets:
##   set_name setlist_labels legend_labels set_colors size
## 1    set_A          set_A         set_A    #EEC12E   35
## 2    set_B          set_B         set_B    #D54848   18
## 3    set_C          set_C         set_C    #9F8DFF   79
There are many customization options, which will be explored in detail throughout this user guide.
3.1.3 Create the Euler
To make a proportional Euler diagram, use argument
proportional=TRUE, Figure 3.3.
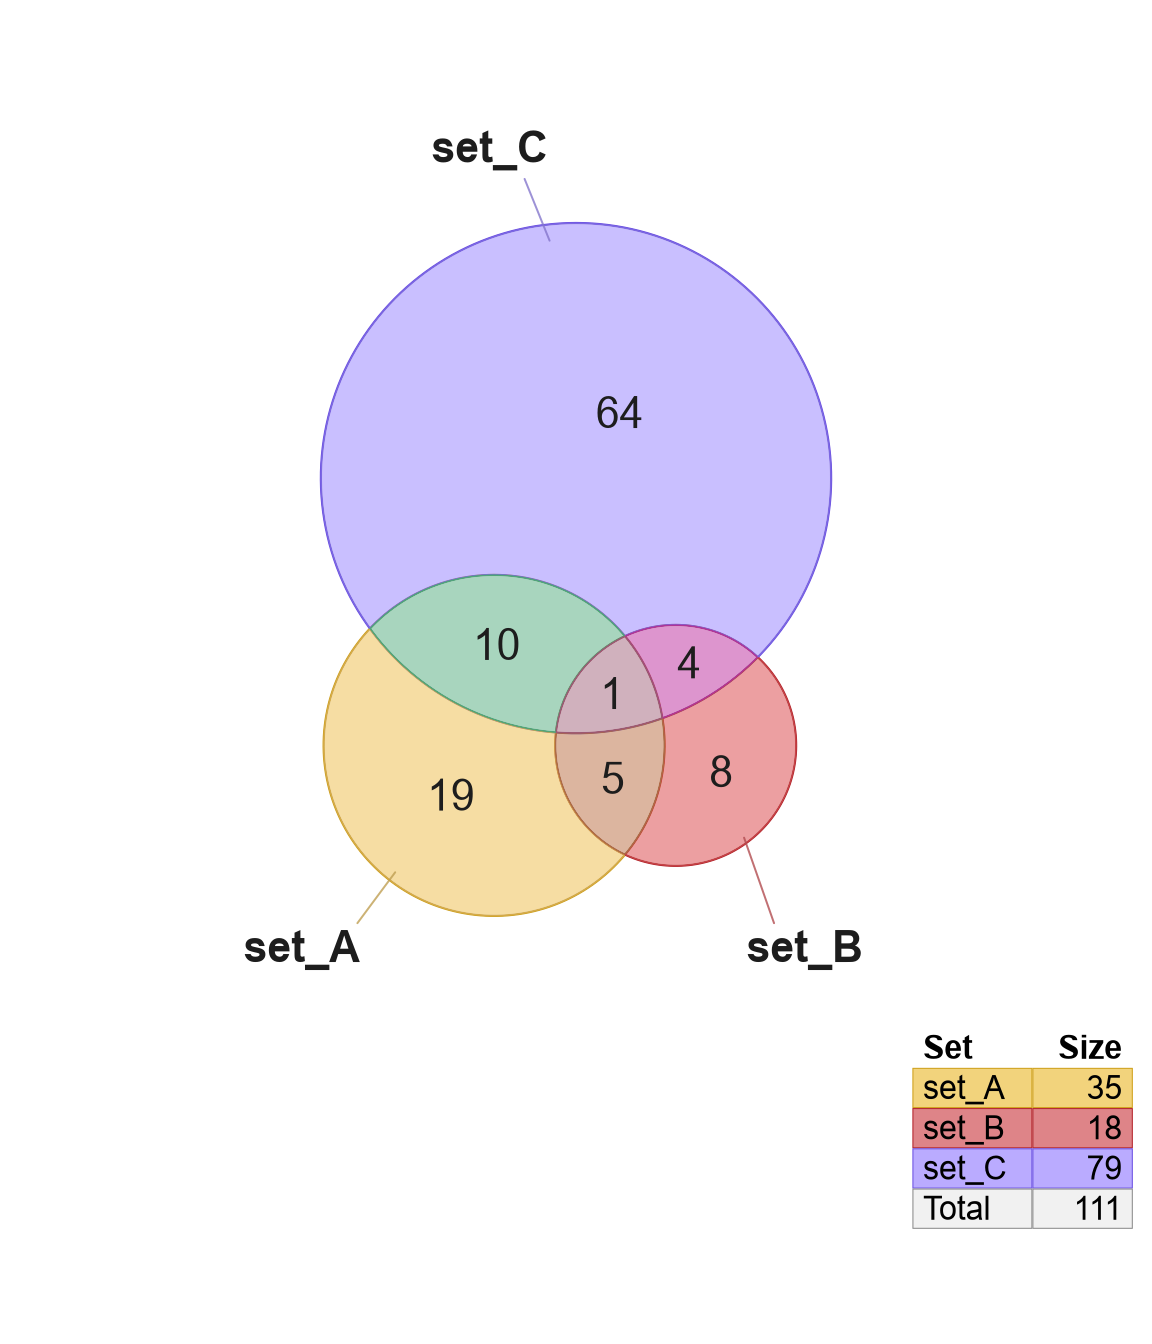
Figure 3.3: Default proportional Euler diagram with three sets.
3.1.3.1 Euler with ellipse
Venndir uses R package eulerr (Larsson 2024) to define the
model Euler diagram, which uses circles by default.
However, it can be coerced to use ellipse shapes with
argument shape="ellipse".
Figure 3.4 compares circular and elliptical shapes, and illustrates that neither option is perfect. The circular option shows one empty set
setlist <- make_venn_test(sizes=c(33, 18, 69))
v1 <- venndir(setlist,
   vector_method="label",
   proportional=TRUE)
v2 <- venndir(setlist,
   proportional=TRUE,
   vector_method="label",
   shape="ellipse")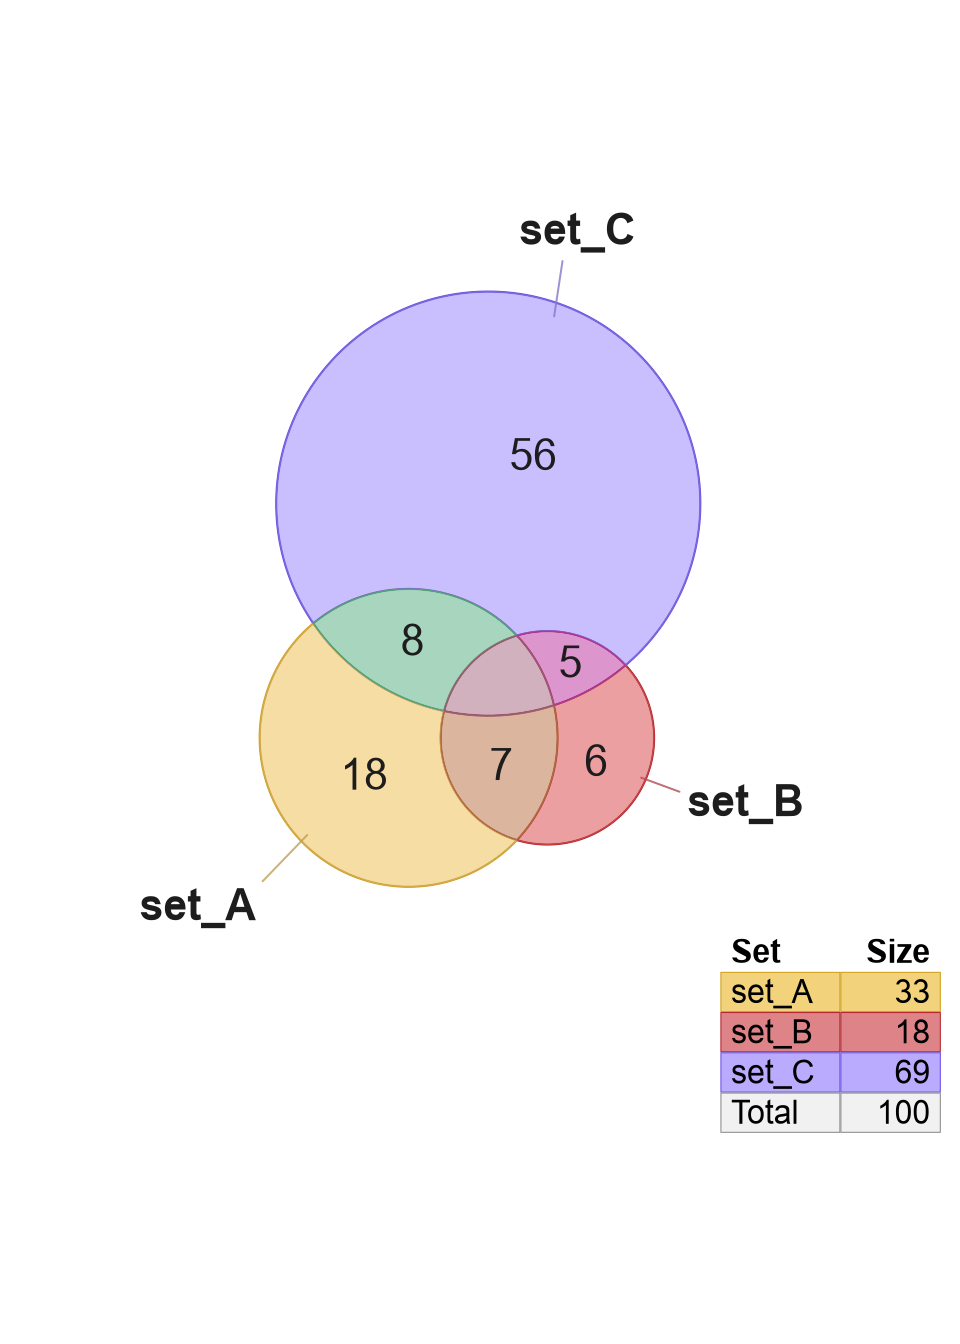
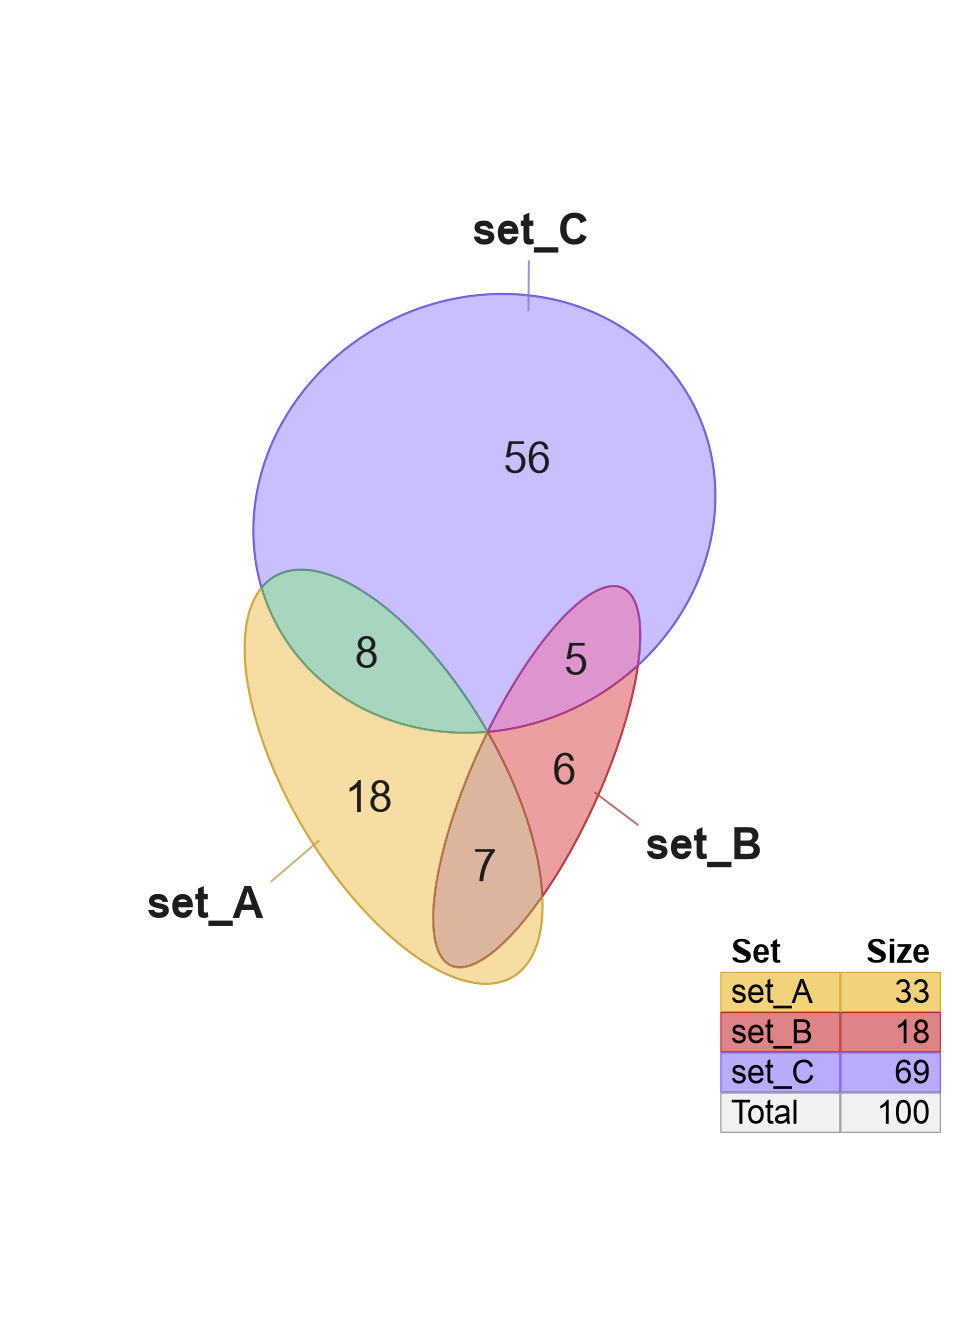
Figure 3.4: Proportional Euler diagram using circle (left) and ellipse (right).
Euler diagrams are imperfect with three or more sets, which means there is no guaranteed geometry (with circles or ellipses) that guarantees the overlap regions will be exactly proportional to the number of items in each region.
Now is a good time to mention that Euler diagrams are useful but imperfect.
Key Points:
- Euler diagrams are only approximately proportional for three or more sets.
- Some overlap regions may be shown which have no items.
- Some overlap regions may not be shown which contain items.
A diagram with any hidden overlaps will display a small footnote symbol \(†\) in the bottom-right corner.
Points 1 and 2 test one's coping skills: "When is it okay not to be perfect?"
Point 3 is more concerning, and is discussed in detail in the section Hidden Overlaps. Briefly:
- Hidden overlaps are indicated by a footnote.
- Hidden overlaps and are stored in the
Venndirobject. - Information about "hidden overlaps" can be reviewed
using:
print(v),footnotes(v),warnings(v), oroverlaplist(v).
The footnote is rendered on the bottom-left corner by default,
and can be controlled using arguments in render_venndir_footnotes().
Notably, argument footnote_style can be:
'symbol': (default) only the footnote symbol'footnote': one line for each footnote'header': Simple summary of footnote marks.
The intention is for the footnote to be subtle, but visible, so there is clear indication when something should be reviewed in detail.
setlist3 <- make_venn_test(500, n_sets=4)
v3 <- venndir(setlist3,
   draw_legend=FALSE,
   proportional=TRUE)
v3b <- venndir(setlist3,
   footnote_style="footnote",
   footnote_fontsize=12,
   draw_legend=FALSE,
   proportional=TRUE)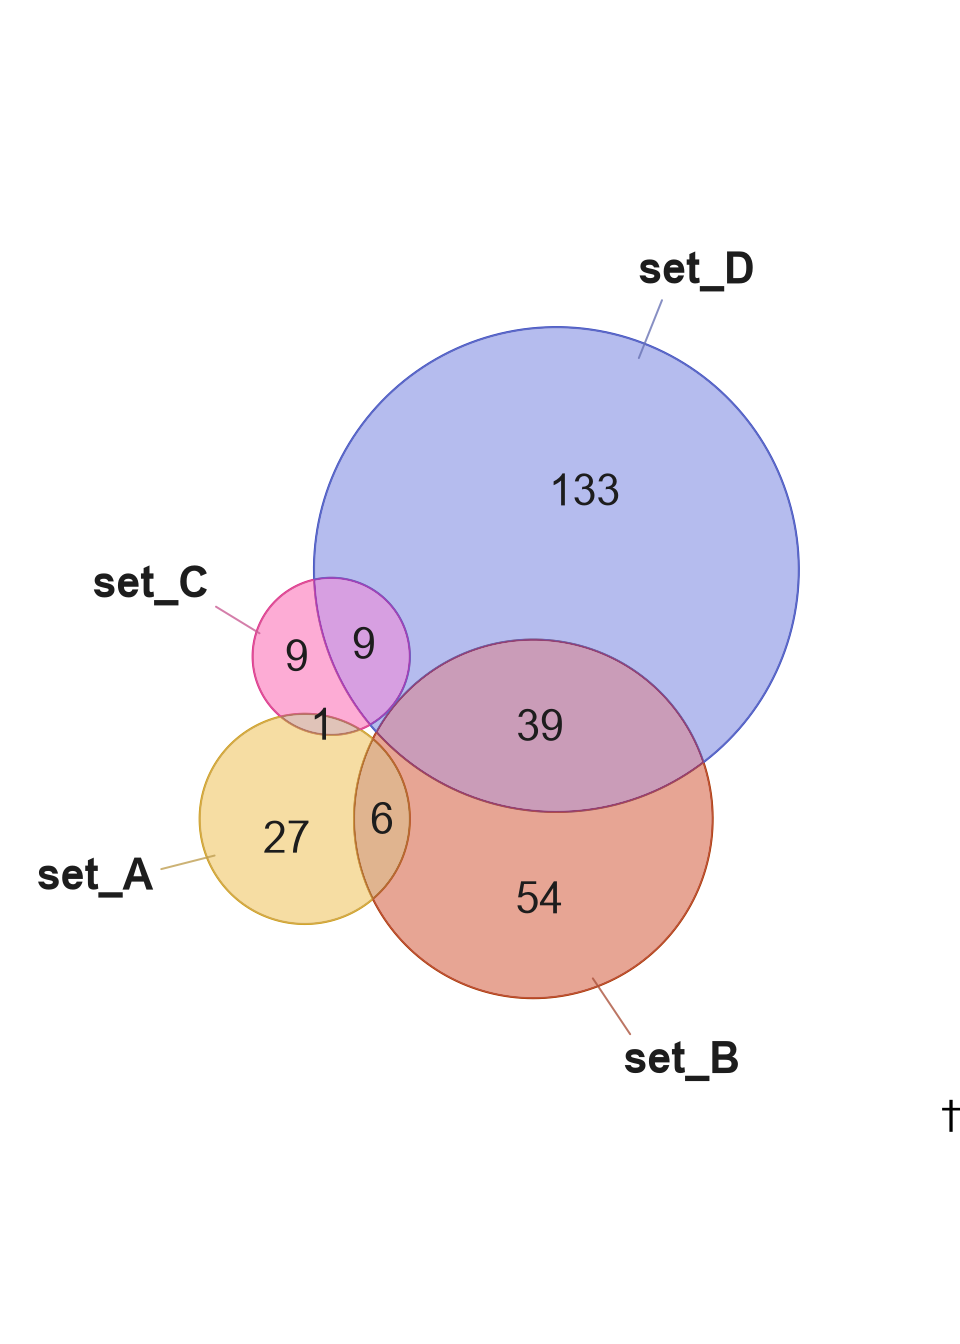
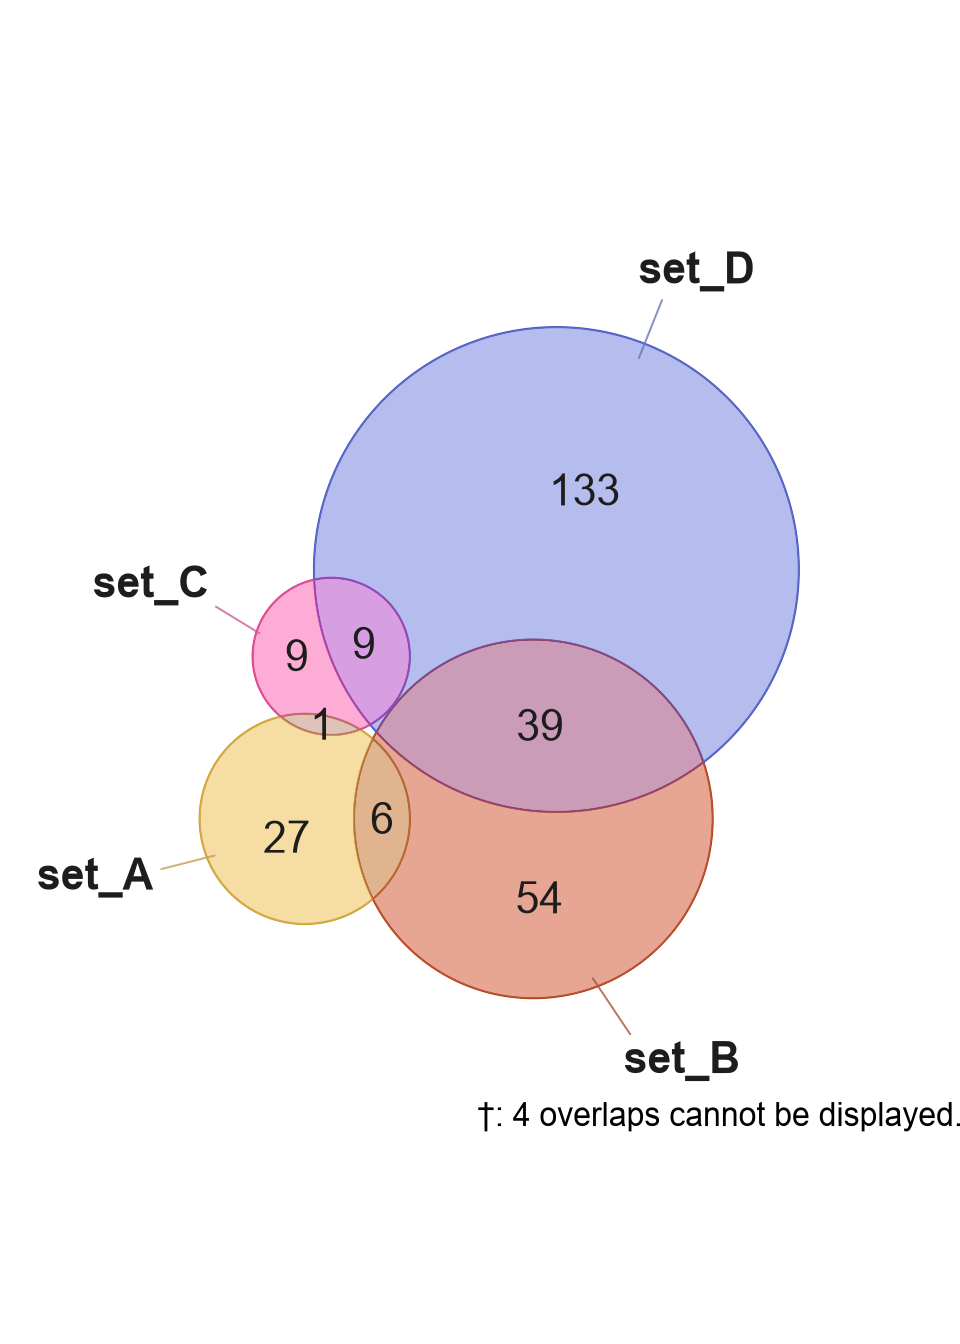
Figure 3.5: Euler diagrams showing a footnote symbol (left panel), and footnote comment (right panel).