2.1 Common Data Input Types
2.1.1 List of sets
The simplest input is a List of sets, where each set is
represented as an R vector of items.
## List of 3
##  $ set_A: chr [1:35] "item_014" "item_195" "item_170" "item_050" ...
##  $ set_B: chr [1:18] "item_155" "item_188" "item_053" "item_135" ...
##  $ set_C: chr [1:79] "item_041" "item_175" "item_090" "item_060" ...
Each vector is not considered 'signed', because each vector has no names().
This setlist can be used directly with venndir().
In Figure 2.1 there are no
signed counts displayed.
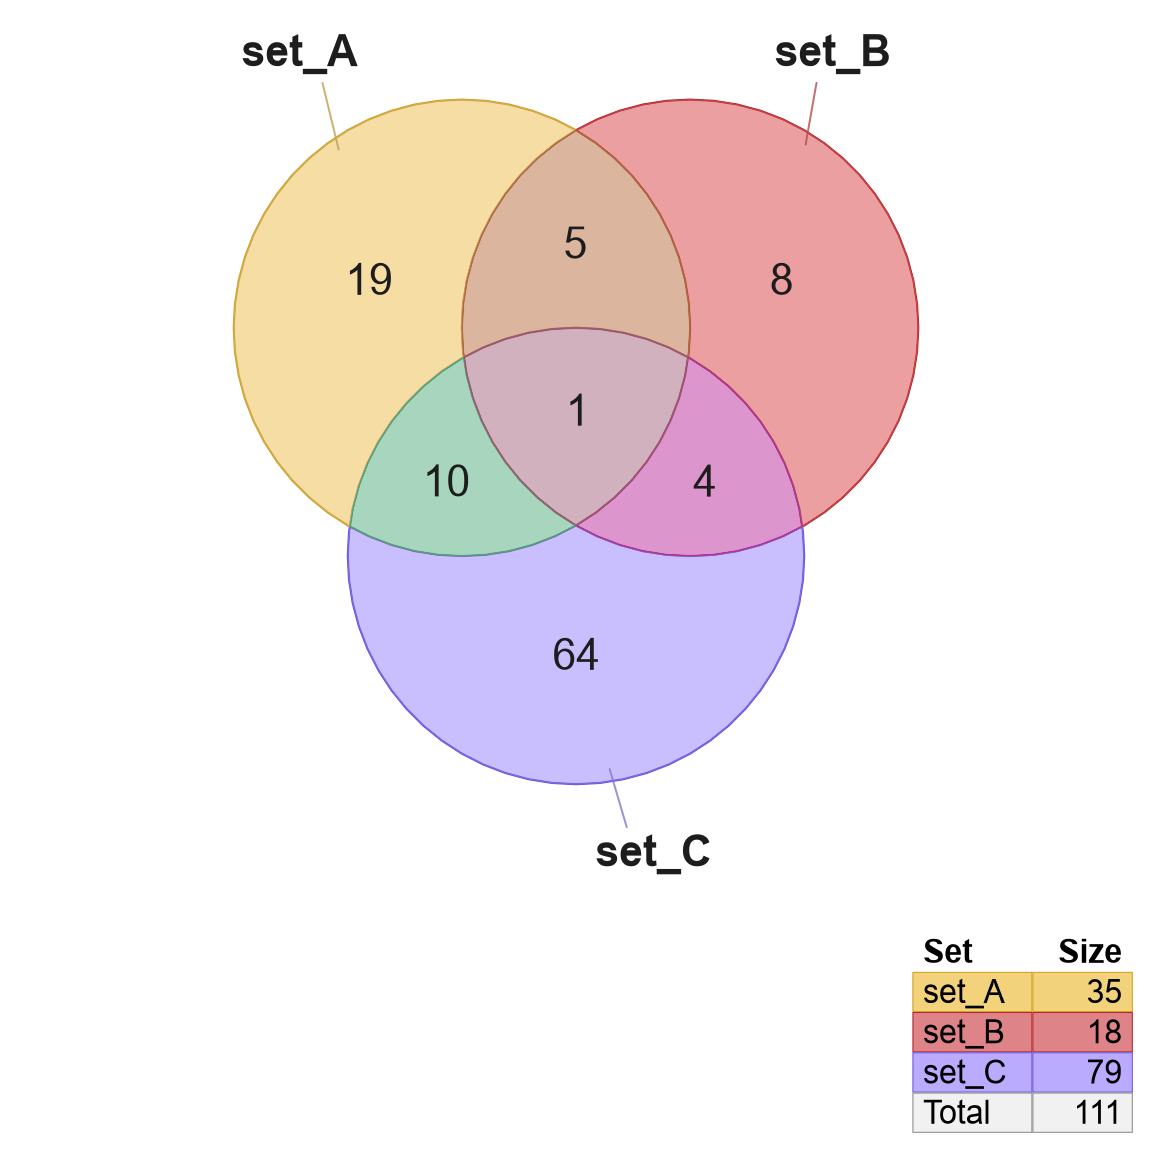
Figure 2.1: Default Venn diagram with three sets.
2.1.2 List of signed sets
The next common input is a list of signed sets,
represented as numeric vectors with items stored as names().
An example is shown below, showing only the first six elements of each
vector. The vector names are "item_014", "item_195",
while the values are '-1', '1'.
## $set_A
## item_014 item_195 item_170 item_050 item_118 item_043
##       -1       -1        1        1       -1       -1
##
## $set_B
## item_155 item_188 item_053 item_135 item_198 item_200
##       -1        1        1       -1        1        1
##
## $set_C
## item_041 item_175 item_090 item_060 item_016 item_116
##        1        1       -1       -1       -1       -1
Figure 2.2 illustrates the
output from venndir(), where
signed counts are displayed using
overlap_type='concordance' by default for a
signed setlist.
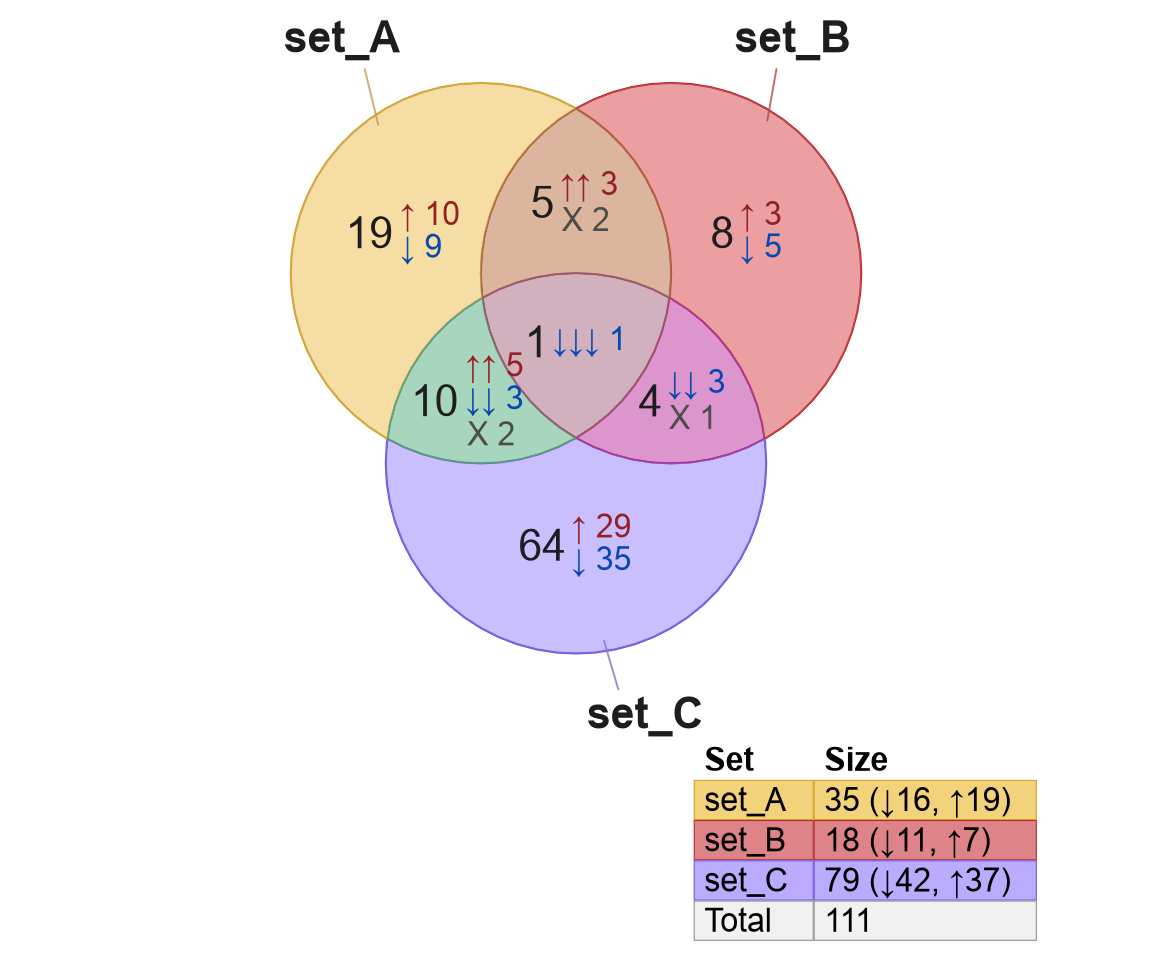
Figure 2.2: Default Venn diagram with three signed sets. The overlap counts are each tabulated by directional sign.
The output is described below:
- The region
"set_A"contains19items that are not present in any other set for this Venn diagram.10of these19items are "up", indicated by the red label which includes the up arrow \(↑ 10\).9of these19items are "down", indicated by the blue label which includes the down arrow \(↓ 9\).
- The region of overlap between
'set_A'and'set_B'contains 5 items which are only present in these two sets, and not present in'set_C'.3of these5items are "up" in both'set_A'and'set_B', indicated by the red label with two up arrows: \(↑↑ 3\).2of these5items are discordant in direction, which means the sign in'set_A'disagrees with'set_B'. The label is indicated in grey color and large'X'\(X 2\). The purpose of using one'X'is to avoid describing all possible combinations of "up" and "down".
The default summary for a signed setlist is
overlap_type="concordance",
which summarizes directional discordance in one category 'X', and
tabulates counts in each subset that involves only one direction.
For other approaches to summarize directional counts, see the summary in Table 3.3, in the section Overlap Type.
2.1.3 Incidence matrix
An incidence matrix (im) is another common input format,
a matrix whose rownames are items, and colnames are sets.
Any non-zero, non-empty value in the matrix indicates the item (row) exists
in the set (column).
##          set_A set_B set_C
## item_014     1     0     0
## item_195     1     0     1
## item_170     1     0     0
## item_050     1     0     1
## item_118     1     0     1
## item_043     1     0     0
## item_200     1     1     0
## item_196     1     0     1
## item_153     1     1     1
## item_090     1     0     1
Figure 2.3 shows the Venn diagram
created by venndir() accepts an incidence matrix as input data.
The input data is converted to a setlist within the function.
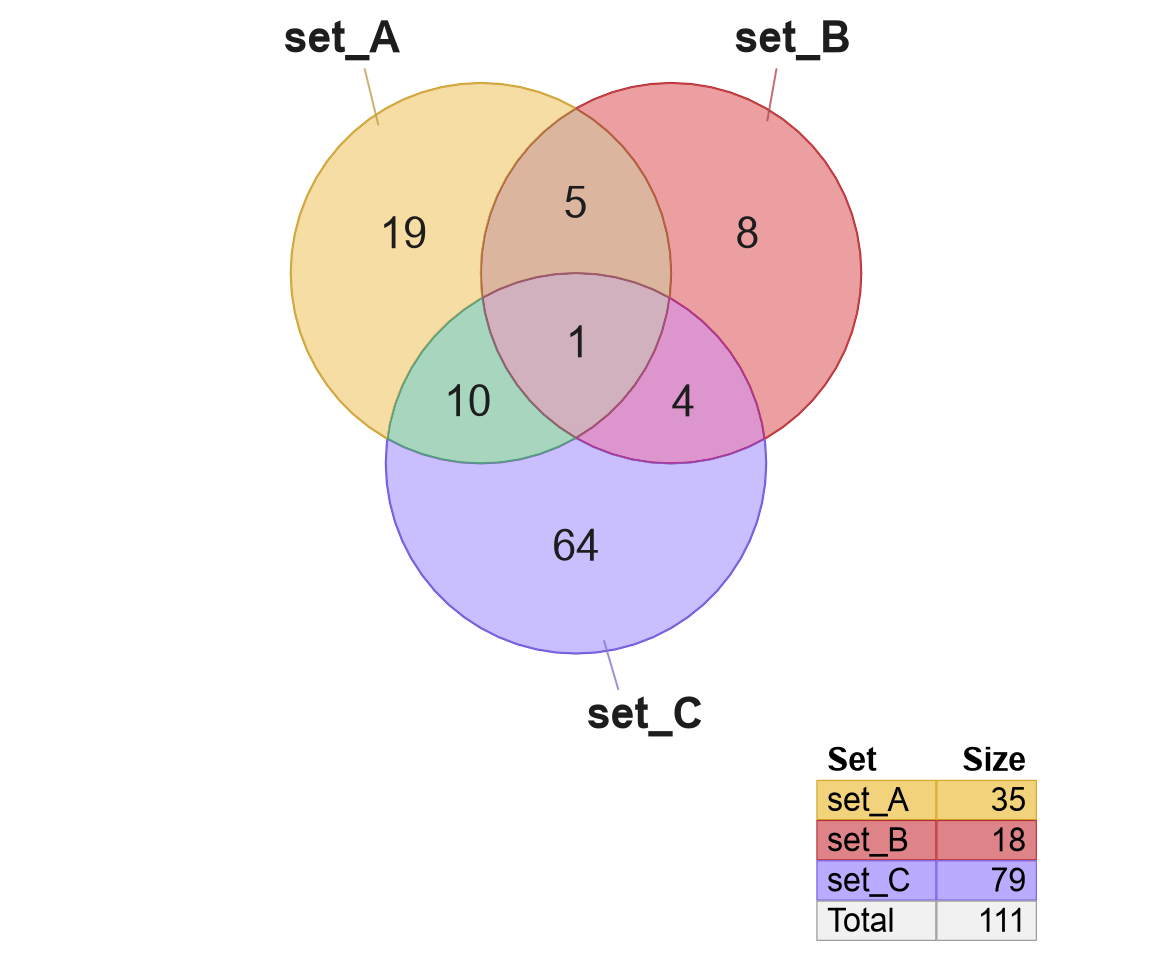
Figure 2.3: Default Venn diagram with three sets, using an incidence matrix as input data.
When the incidence matrix only contains positive values, it is
assumed to be non-directional. This assumption can be changed
by using the argument overlap_type.
2.1.4 Signed incidence matrix
A signed incidence matrix is similar to an incidence matrix, except that it may include positive and negative values.
##          set_A set_B set_C
## item_014    -1     0     0
## item_195    -1     0     1
## item_170     1     0     0
## item_050     1     0     1
## item_118    -1     0    -1
## item_043    -1     0     0
## item_200     1     1     0
## item_196    -1     0    -1
## item_153    -1    -1    -1
## item_090    -1     0    -1
Figure 2.4 shows the signed Venn
diagram created by venndir() also accepts a
signed incidence matrix
as input data, and subsequently displays signed counts.
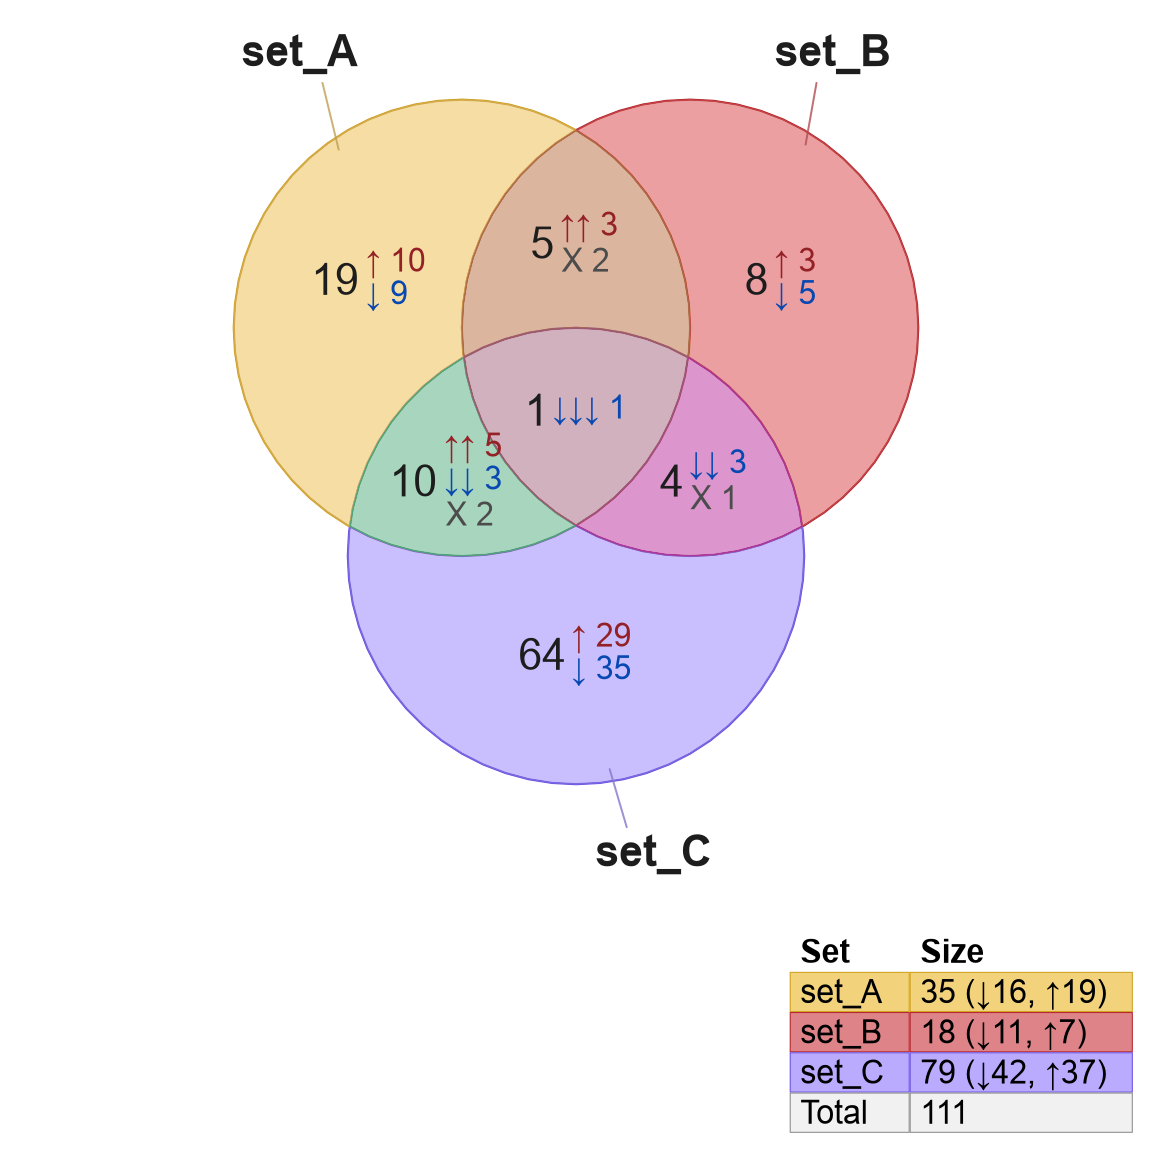
Figure 2.4: Default Venn diagram with three sets, using a signed incidence matrix as input data.
2.1.5 Overlap counts
If the Venn overlap counts are already known, they can also be used to re-create the corresponding Venn diagram.
The function counts2setlist() accepts Venn counts, and returns
the corresponding setlist.
The counts should be named by the Venn overlap, by using the name
of each set involved, separated by ampersand '&'.
The example below uses sets "A" and "B", and the corresponding
overlap between 'A' and 'B' is named 'A&B'.
Note that the overlap name should be defined in quotes in R code,
so the ampersand '&' is stored properly.
## List of 2
##  $ A: chr [1:27] "A_1" "A_2" "A_3" "A_4" ...
##  $ B: chr [1:24] "B_1" "B_2" "B_3" "B_4" ...
Figure 2.5 shows the output of venndir()
using this setlist as input.
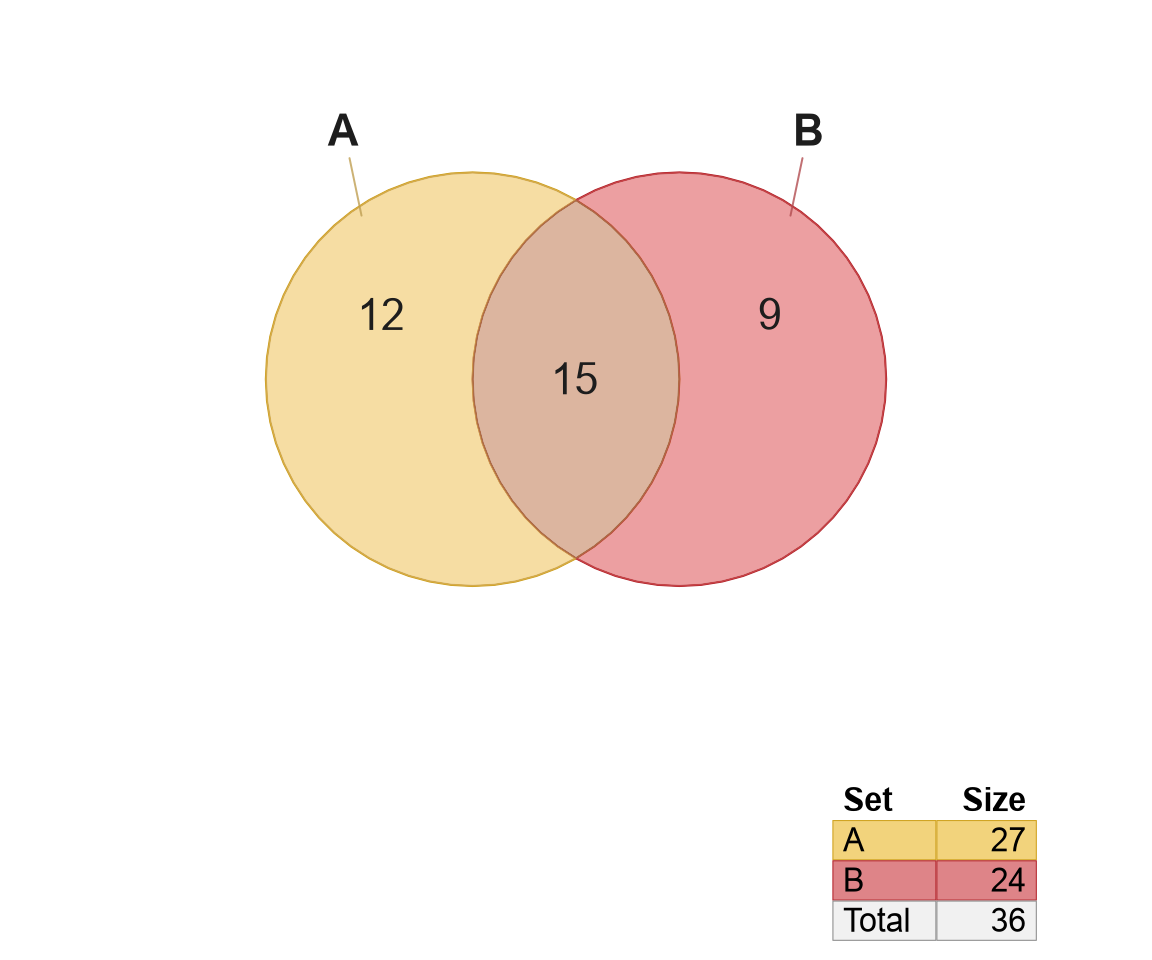
Figure 2.5: Venn diagram created by using overlap counts as input data.
Tip:
When starting with overlap counts, it is recommended to define
set names with single characters, such as 'A', 'B', and 'C'.
- The set names can be adjusted afterwards by editing
names(setlist). - However, the preferred approach is to use
venndir()argumentssetlist_labelsandlegend_labels, also described in Custom legend labels. - Figure 2.6 illustrates this process.
The complete combination of sets and overlaps can be defined by
calling make_venn_combn_df() using a vector of set names.
For example rownames(make_venn_combn_df(LETTERS[1:3])) produces
the following:
'A', 'B', 'C', 'A&B', 'A&C', 'B&C', 'A&B&C'
venndir(setlist,
   setlist_labels=c("Set A:\ncontrol state",
      "Set B:\ntest state"),
   legend_labels=c("A: control state",
      "B: test state"))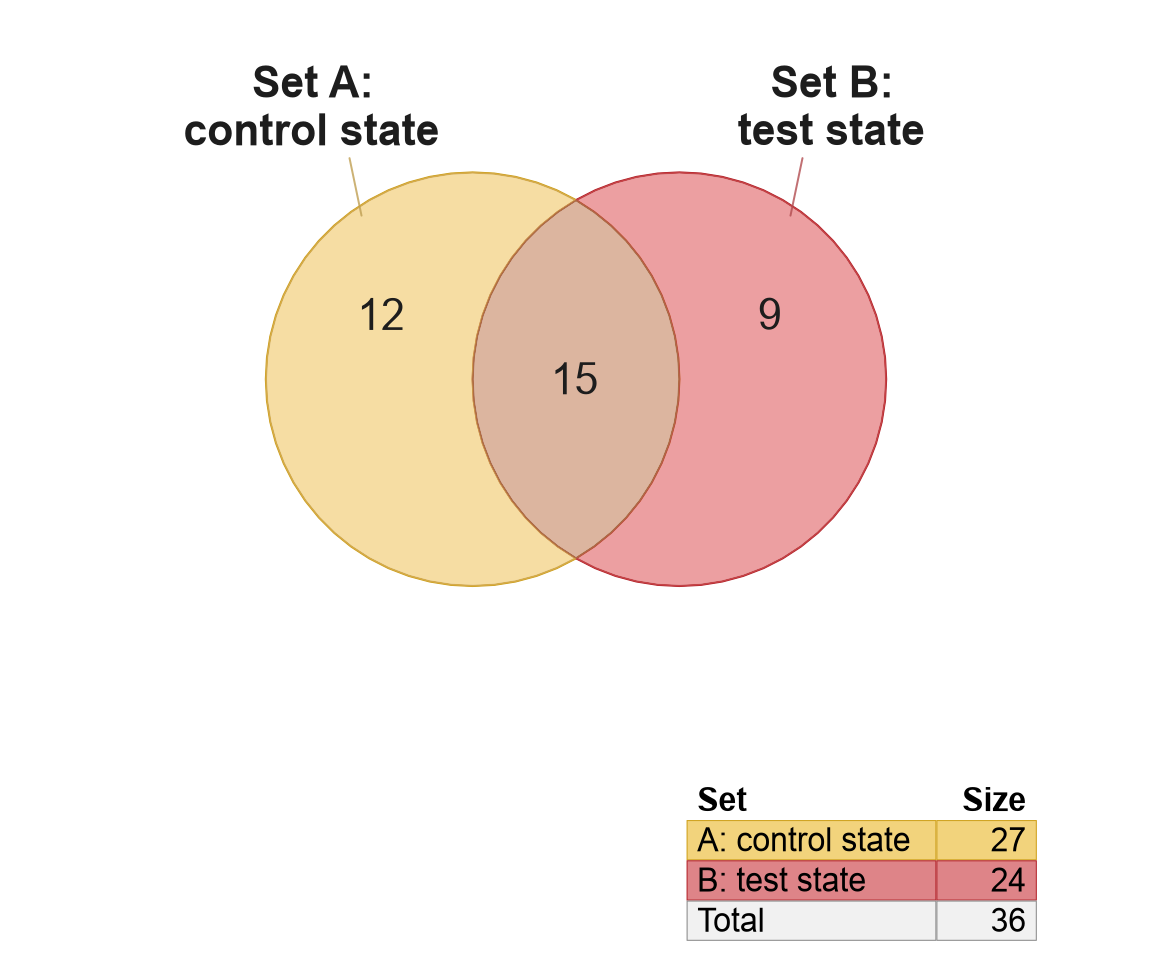
Figure 2.6: Venn diagram using custom set names using setlist_labels and legend_labels.
2.1.6 Signed overlap counts
Similar to providing overlap counts as above, this approach defines
counts for each directional overlap, using signed_counts2setlist().
This input is quite complex, also the least common.
The input is a list of integer count vectors. Each vector is
named by the overlap, for example "A" or "A&B". Each vector
is named by the direction, delimited by underscore "_", for
example "1" for 'up', or "1_-1" for 'up_down'.
Notice the format of the input data:
signed_counts <- list(
   "A"=c(
      "1"=80,
      "-1"=95),
   "B"=c(
      "1"=15,
      "-1"=30),
   "A&B"=c(
      "1_1"=100,
      "1_-1"=3,
      "-1_1"=4,
      "-1_-1"=125))
signed_counts
## $A
## 1 -1
## 80 95
##
## $B
## 1 -1
## 15 30
##
## $`A&B`
## 1_1 1_-1 -1_1 -1_-1
## 100 3 4 125This input format is complicated for 2-way data, and certainly even more complicated for 3-way data. However, sometimes it is the most practical way to produce a given figure.
Counts are converted to a signed setlist with signed_counts2setlist().
Item names are generated only to create the setlist and
are not otherwise useful.
## $A
##         A_1_1       A_-1_22    A&B_1_1_29  A&B_-1_-1_24 A&B_-1_-1_125
##           "1"          "-1"           "1"          "-1"          "-1"
##
## $B
##         B_1_1    A&B_1_1_25    A&B_1_1_94  A&B_-1_-1_56 A&B_-1_-1_125
##           "1"           "1"           "1"          "-1"          "-1"
Figure 2.7 shows the setlist
visualized with venndir().
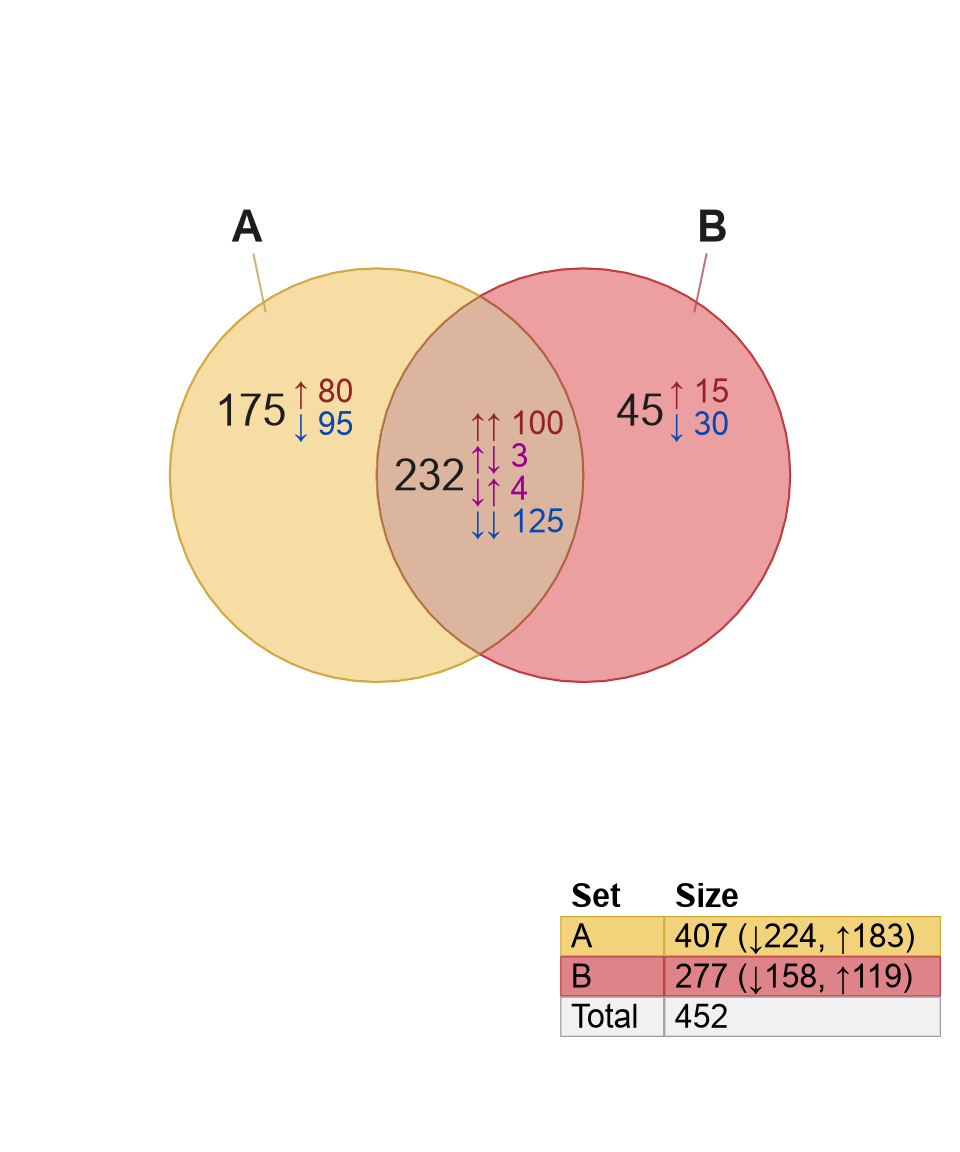
Figure 2.7: Venndir showing signed counts summarized using overlap_type="each", which includes counts for each combination of signs.
2.1.7 Overlap list
This approach is conceptually similar to Overlap counts which starts with the Venn counts as input, except in this case instead of supplying the integer count in each Venn overlap, the data contains the actual items.
Consider a simple example:
- two sets: 'A' and 'B'
- three total items, one only present in 'A', one unique to 'B', and one shared by both groups which is assigned to 'A&B'.
overlaplist <- list(
   A=c("Christina"),
   B=c("James"),
   "A&B"=c("Jillian", "Zander")
)
str(overlaplist)
## List of 3
## $ A : chr "Christina"
## $ B : chr "James"
## $ A&B: chr [1:2] "Jillian" "Zander"This overlaplist is converted into setlist using overlaplist2setlist(),
which can be input to venndir().
Figure 2.8 shows the default Venn diagram (left),
and a variation which displays the item labels (right) using argument
show_labels="Ni".
The show_labels argument is described in Label Content.
setlist <- overlaplist2setlist(overlaplist)
venndir(setlist)
venndir(setlist,keep_item_order=TRUE,
   item_cex_factor=c(0.6, 0.7, 0.9),
   show_labels="Ni")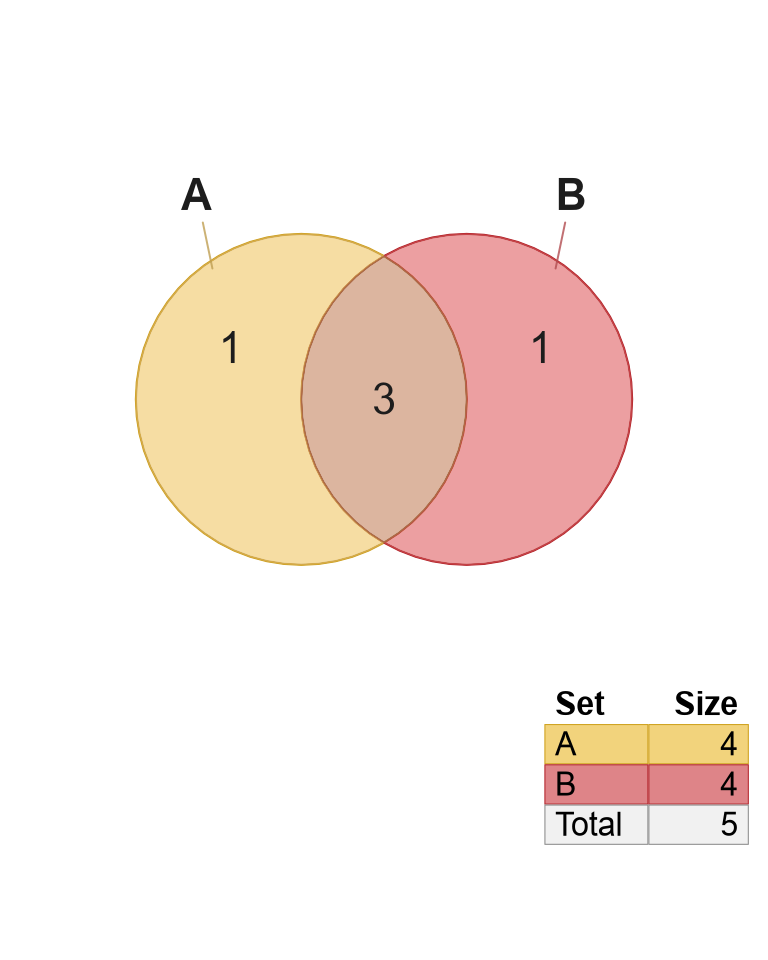
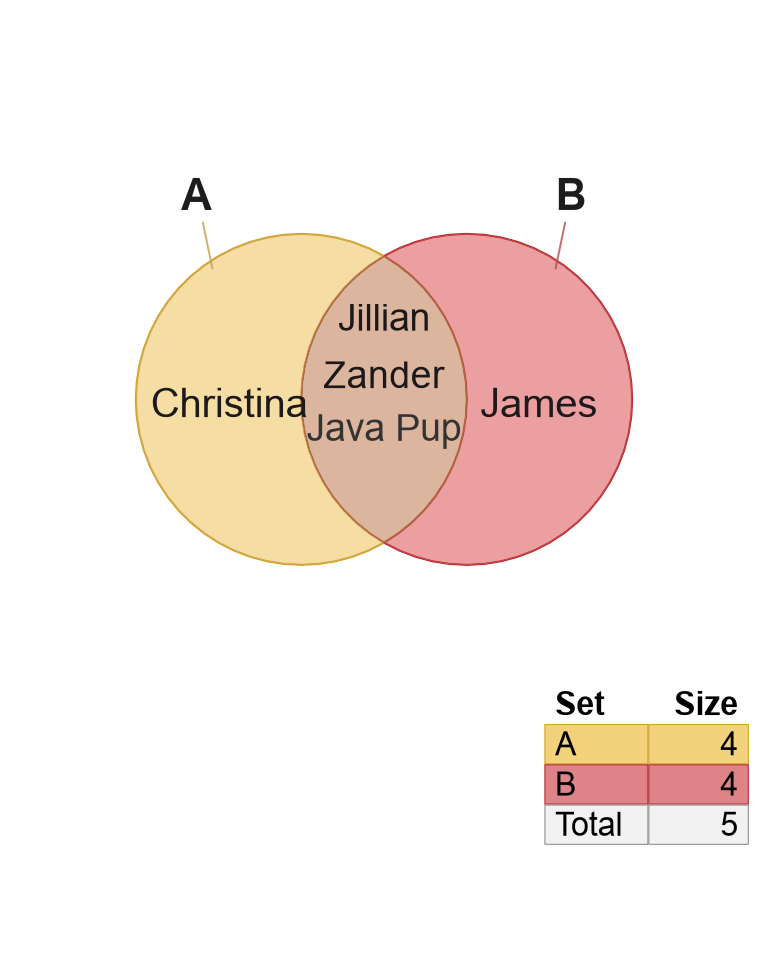
Figure 2.8: Venn diagram after converting an overlap list to setlist, showing overlap counts (left), and overlap item labels (right).
The argument item_cex_factor is used to adjust the item label font
size, and is described in Item Labels.
2.1.8 Signed overlap list
A powerful but complex import option is a signed overlap list, similar to the previous section Overlap list with the addition of directional sign.
The format is similar to overlap list:
listnamed by the Venn overlap: 'A', 'B', 'A&B'Each list element is also a
list, named by the directional sign.- Each sign is defined using
'1'or'-1'separated by a space. - Signs involving one set:
"1","-1" - Signs involving two sets:
"1 1","1 -1", etc. - Signs involving three sets:
"1 1 1","1 -1 1", etc.
- Each sign is defined using
signed_overlaplist <- list(
   A=list(
      "-1"=c("Item_A1"),
      "1"=c("Item_A2")),
   B=list(
      "1"=c("Item_B1", "ItemB2"),
      "-1"=c("ItemB3")),
   "A&B"=list(
      "1 1"=c("Item_AB2"),
      "1 -1"=c("Item_AB4"),
      "-1 1"=c("Item_AB1"),
      "-1 -1"=c("Item_AB3"))
)
str(signed_overlaplist)
## List of 3
## $ A :List of 2
## ..$ -1: chr "Item_A1"
## ..$ 1 : chr "Item_A2"
## $ B :List of 2
## ..$ 1 : chr [1:2] "Item_B1" "ItemB2"
## ..$ -1: chr "ItemB3"
## $ A&B:List of 4
## ..$ 1 1 : chr "Item_AB2"
## ..$ 1 -1 : chr "Item_AB4"
## ..$ -1 1 : chr "Item_AB1"
## ..$ -1 -1: chr "Item_AB3"The signed_overlaplist is converted to setlist using
overlaplist2setlist().
Figure 2.9 shows the resulting Venn diagram with item labels enabled. Notice the item labels include a directional arrow, and are colored by the sign.
setlist <- overlaplist2setlist(signed_overlaplist)
v <- venndir(setlist,
   show_labels="Ni",
   item_cex_factor=0.6,
   xyratio=1.5)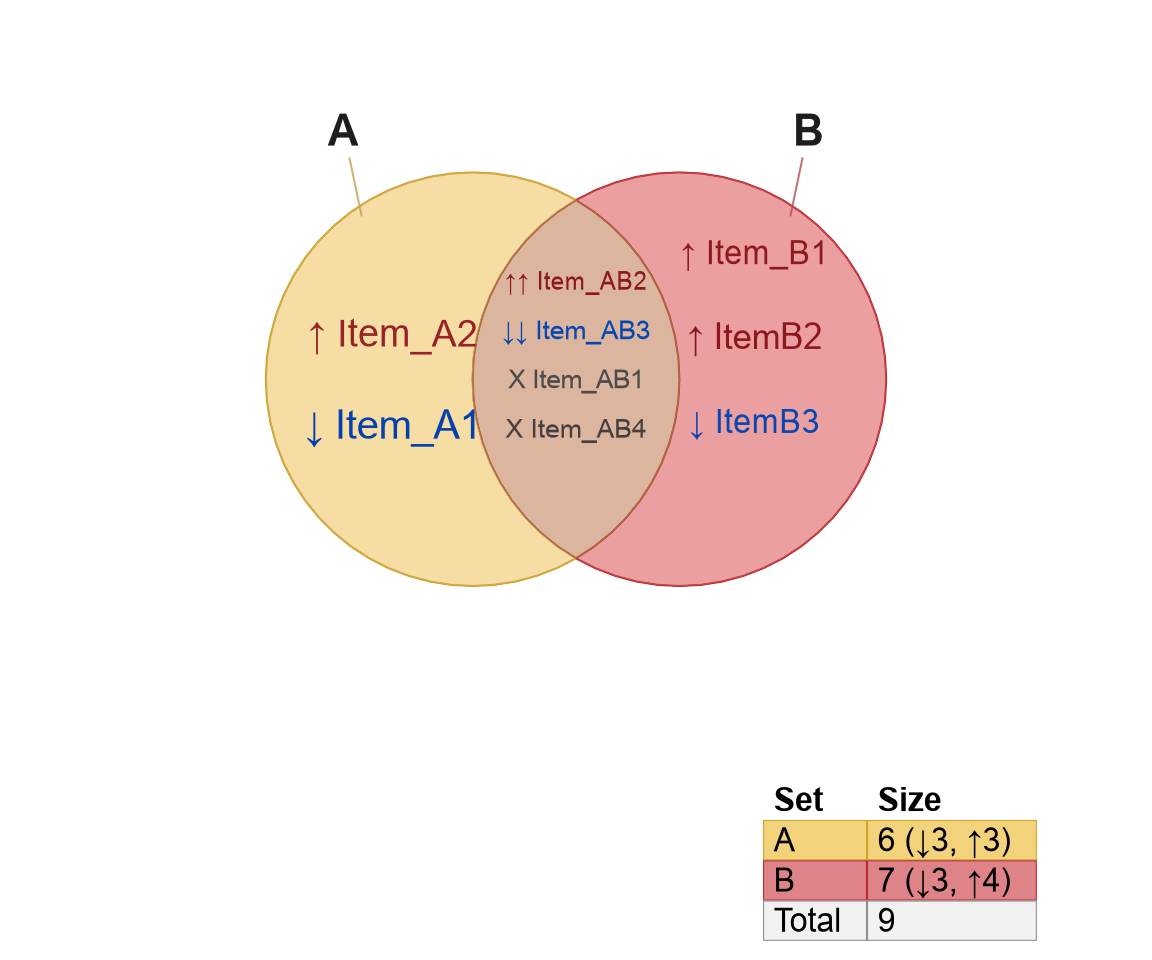
Figure 2.9: Venn diagram derived from a signed overlap list. The figure shows item labels which are colored by sign, and placed beside a directional arrow.
This input format can also be generated from the Venndir object
itself using overlaplist(v). However, it requires that venndir()
was called with argument overlap_type="each" to preserve each sign.
The default overlap_type="concordance" does not preserve signs
for discordant overlaps.
2.1.8.1 Alternative signed overlap list
An alternative input format is shown below, which may be more convenient to produce in some circumstances.
The alternate format is shown below:
alt_signed_overlaplist <- list(
   A=c("Item_A1"="-1",
      "item_A2"="1"),
   B=c("Item_B1"="1",
      "ItemB2"="1",
      "ItemB3"="-1"),
   "A&B"=c("Item_AB2"="1 1",
      "Item_AB4"="1 -1",
      "Item_AB1"="-1 1",
      "Item_AB3"="-1 -1"))
alt_signed_overlaplist
## $A
## Item_A1 item_A2
## "-1" "1"
##
## $B
## Item_B1 ItemB2 ItemB3
## "1" "1" "-1"
##
## $`A&B`
## Item_AB2 Item_AB4 Item_AB1 Item_AB3
## "1 1" "1 -1" "-1 1" "-1 -1"First, the alternative format is converted to the expected
format for overlaplist2setlist().
Then it is converted to setlist.
signed_overlaplist <- lapply(alt_signed_overlaplist, function(i){
   split(names(i), i)
})
setlist <- overlaplist2setlist(signed_overlaplist)
The resulting setlist can be used with venndir() as
in Figure 2.9.
2.1.9 Items
A streamlined approach to convert items from a vector or list
into setlist is provided by venn_meme(), as described Venn Memes.
The process assumes the input data is provided in a specific order.
The process is quite similar to that described in Overlap list,
except that this process assumes the order matches the output of
make_venn_combn_df().
The assumptions:
- Input must be provided in the order defined by
make_venn_combn_df(n)wherenis the number of sets, ormake_venn_combn_df(x)wherexis a vector of set names. - Input is provided without using overlap names, they are assigned based upon the length of the input data.
- Duplicate items are not permitted.
To illustrate the process, each example below uses a vector of
character LETTERS, showing how the letters are populated into
the Venn diagram.
Figure 2.10 illustrates the process by showing the
output of venn_meme(), with each panel using a slightly longer
vector of items.
- For 1 item: the output includes one set (not shown).
- For 2 or 3 items: A 2-way Venn diagram is created (a).
- For 3 to 7 items: A 3-way Venn diagram is created (b)
- For 8 to 15 items: A 4-way Venn diagram is created (c).
- For 16 to 31 items: A 5-way Venn diagram is created (d).
vm3 <- venn_meme(head(LETTERS, 3))
vm7 <- venn_meme(head(LETTERS, 7))
vm15 <- venn_meme(head(LETTERS, 15))
vm31 <- venn_meme(1:31)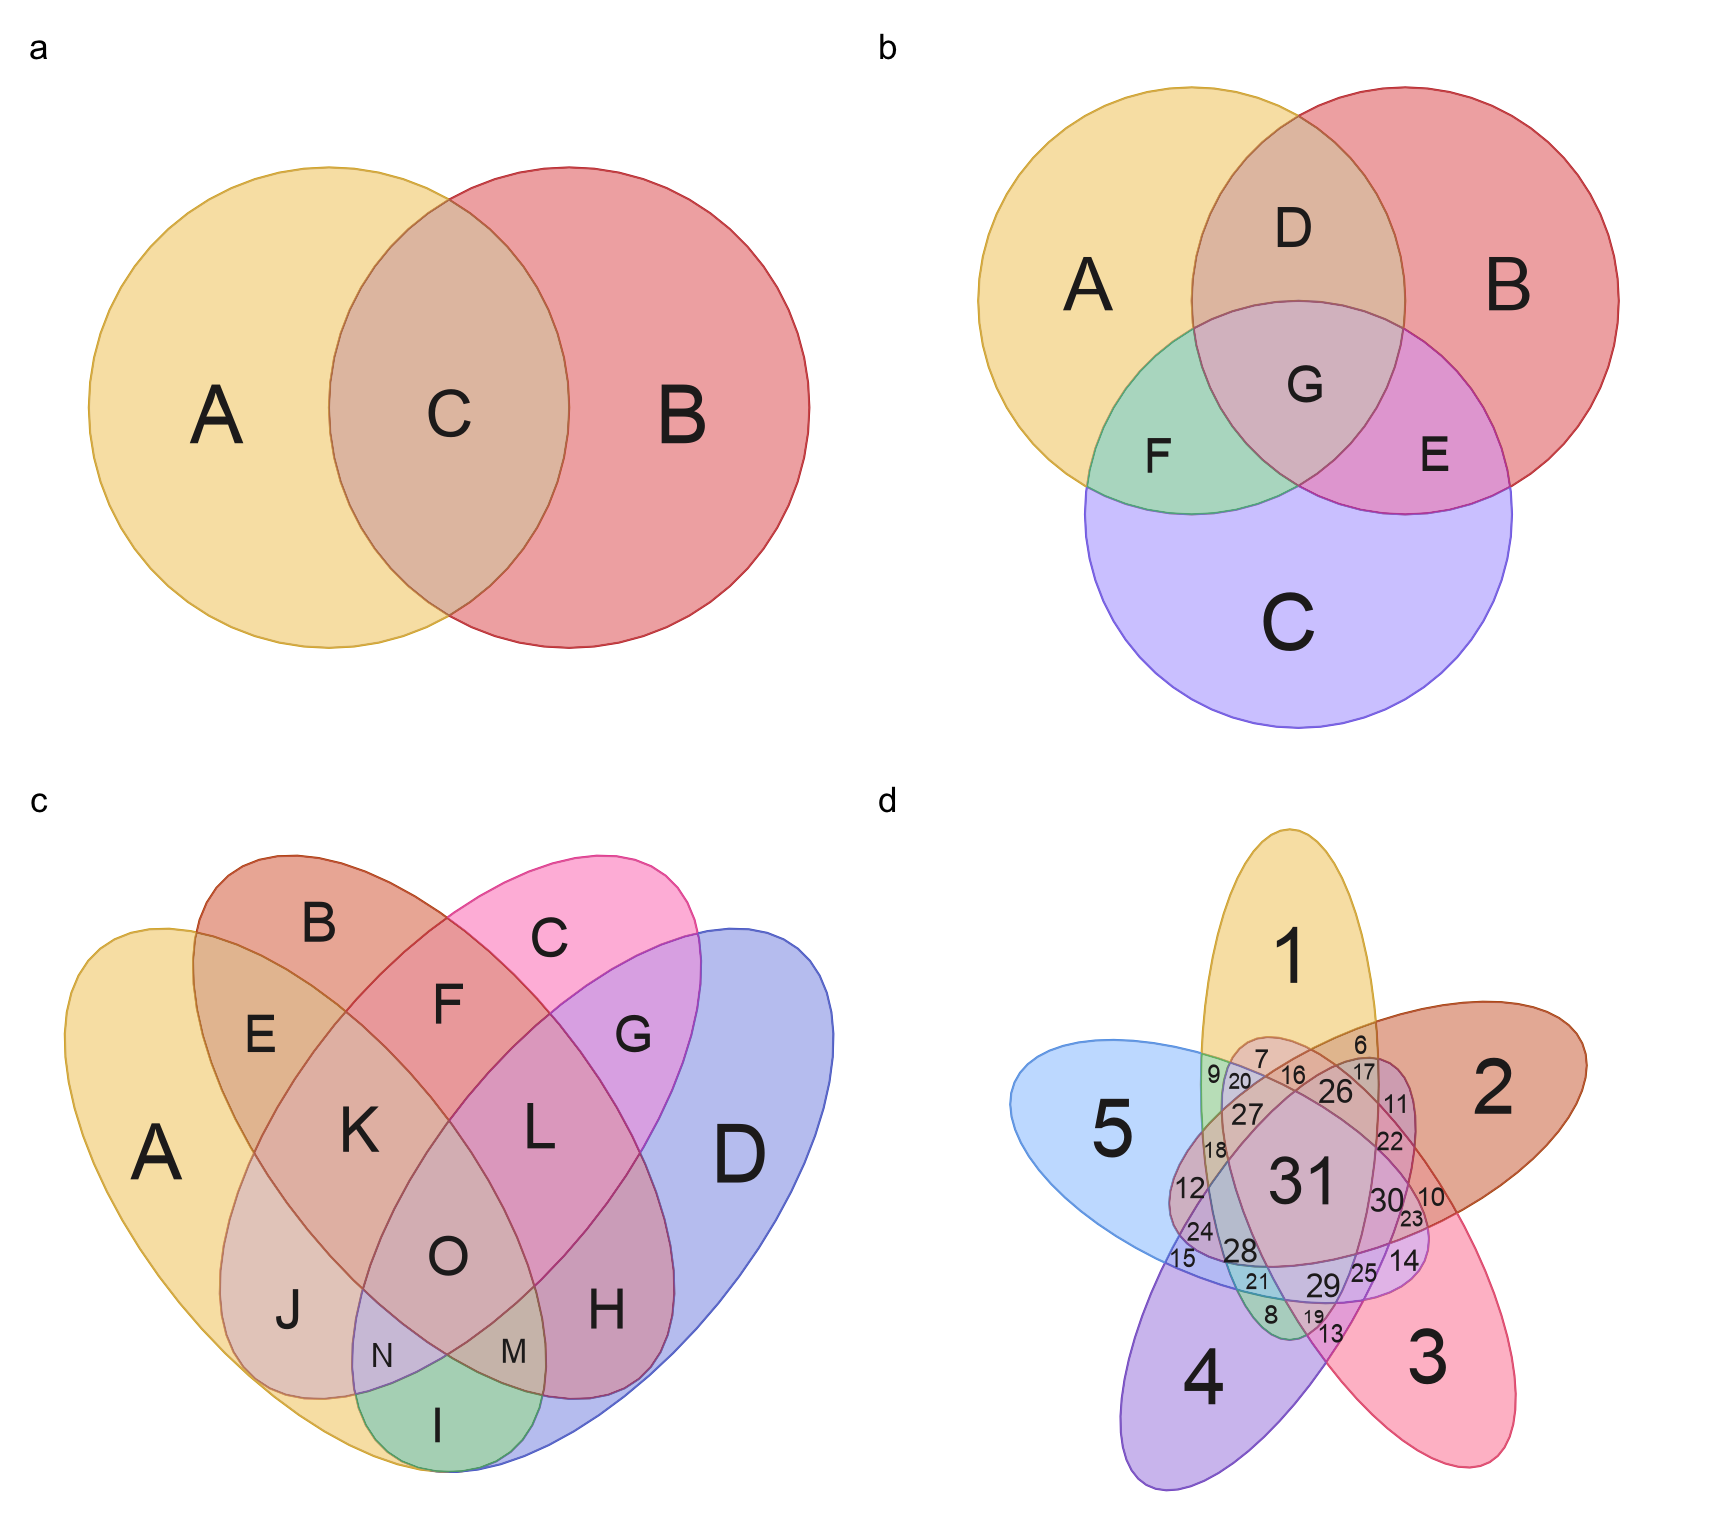
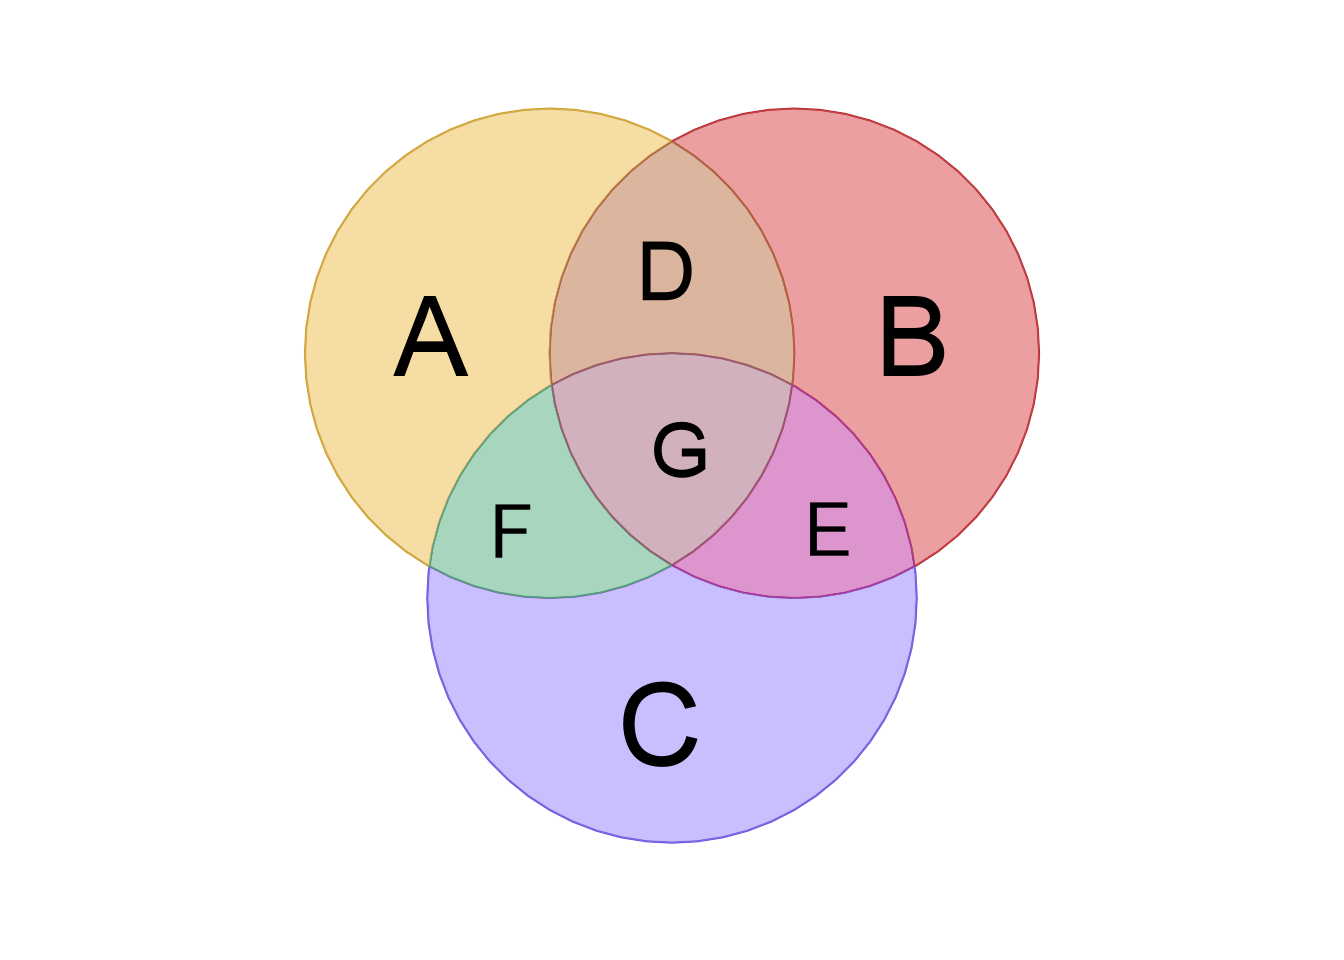
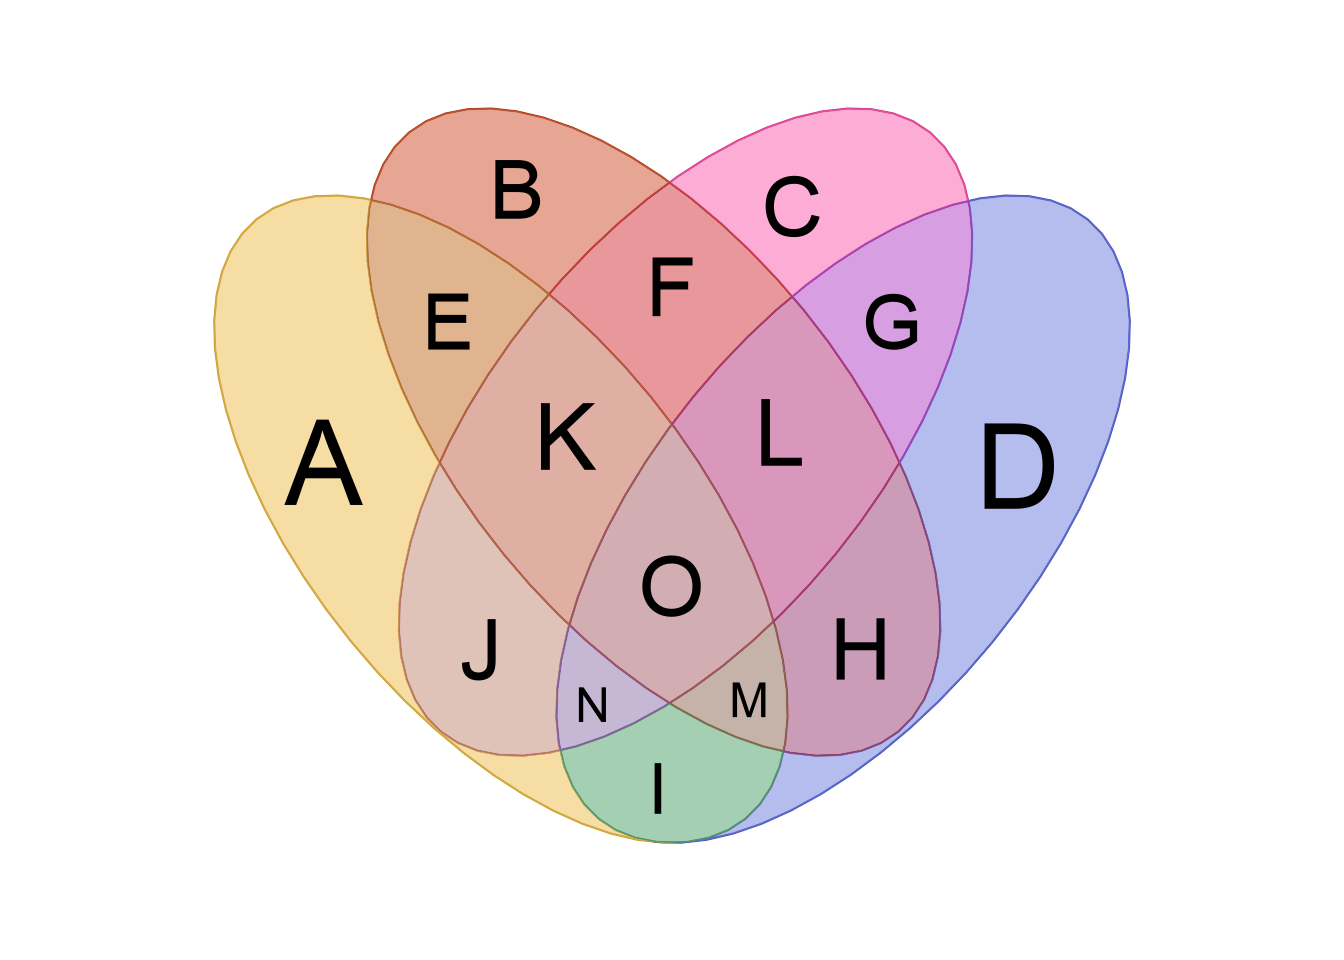
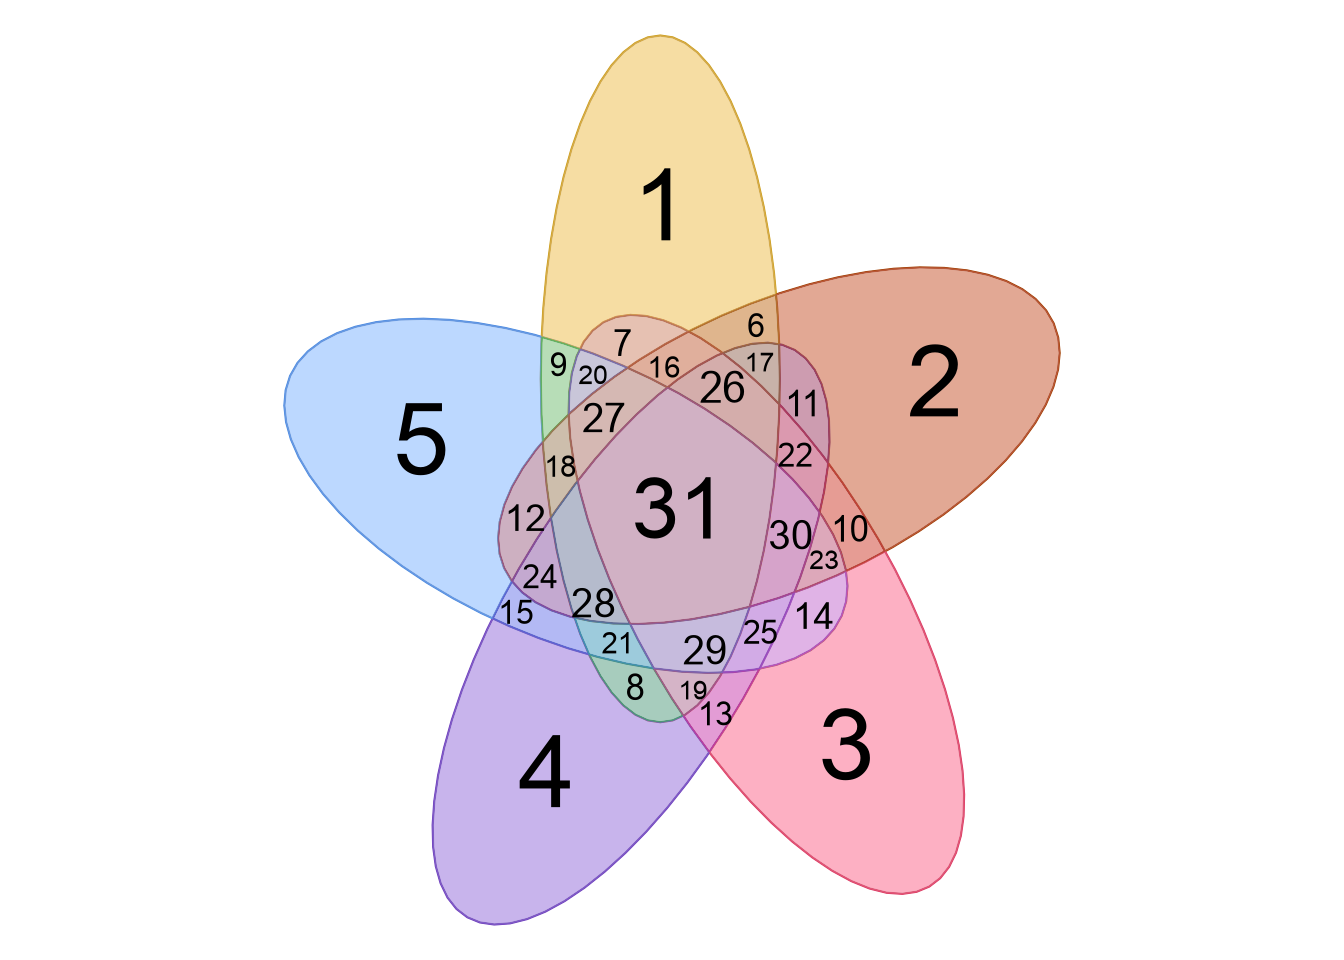
Figure 2.10: Four Venn diagrams showing the output from venn_meme() when providing a certain different number of items.
Tip:
A useful by-product of calling venn_meme() is the creation
of a setlist or overlaplist, without needing to provide
all the Venn overlap labels upfront.
For example, use setlist(vm3) to obtain the setlist,
or overlaplist(vm3) to obtain the overlap list,
created by the call to venn_meme().
## $A
## [1] "A" "C"
##
## $B
## [1] "B" "C"## $A
## [1] "A"
##
## $B
## [1] "B"
##
## $`A&B`
## [1] "C"2.1.10 List of data frames
A common starting point is a data.frame for each set,
with a column of numeric values, and column of item names.
Very often this input is a "table of stats" which may
also need to be filtered for statistical significance.
The general guidance is to filter each data.frame, then convert
the result into a vector. The vector can either be un-signed,
or signed.
- Setlist: a
charactervector of items. - Signed setlist: vector using
sign(), named by item.
To illustrate, consider the test data generated below, as two
data.frame objects with P-values and log2 fold changes.
# define some test data
set.seed(123)
df1 <- data.frame(
   item=paste0("item", jamba::padInteger(1:20)),
   pvalue=round(digits=3, stats::runif(20) / 5),
   log2FoldChange=round(digits=3, rnorm(20) * 3))

df2 <- data.frame(
   item=paste0("item", jamba::padInteger(1:20)),
   pvalue=round(digits=3, stats::runif(20) / 5),
   log2FoldChange=round(digits=3, rnorm(20) * 3))

head(df1)| item | pvalue | log2FoldChange |
|---|---|---|
| item01 | 0.058 | 3.672 |
| item02 | 0.158 | 1.079 |
| item03 | 0.082 | 1.202 |
| item04 | 0.177 | 0.332 |
| item05 | 0.188 | -1.668 |
| item06 | 0.009 | 5.361 |
Option 1. Setlist
One convenient approach is to create a list of data.frame objects,
apply a P-value filter to each entry, and return column 'item'.
This output does not have directional sign.
# create a list of data.frame objects
dflist <- list(Dataset1=df1,
   Dataset2=df2)

# iterate the list
setlist <- lapply(dflist, function(df){
   # apply stat threshold
   dfsub <- subset(df, pvalue < 0.1);
   # return the item name
   dfsub$item
})
str(setlist)
## List of 2
## $ Dataset1: chr [1:9] "item01" "item03" "item06" "item10" ...
## $ Dataset2: chr [1:11] "item02" "item03" "item04" "item06" ...Option 2. Signed setlist
The other common alternative is to extend Option 1 to create
a signed list, using the sign of 'log2FoldChange'.
The vector should be the sign, then named by 'item'.
# create a list of data.frame objects
dflist <- list(Dataset1=df1,
   Dataset2=df2)

# iterate the list
setlist_signed <- lapply(dflist, function(df){
   # apply stat threshold
   dfsub <- subset(df, pvalue < 0.1);
   # create vector using sign()
   x <- sign(dfsub$log2FoldChange);
   # add item names
   names(x) <- dfsub$item;
   x
})
setlist_signed
## $Dataset1
## item01 item03 item06 item10 item12 item15 item17 item18 item19
## 1 1 1 -1 -1 -1 1 1 -1
##
## $Dataset2
## item02 item03 item04 item06 item10 item14 item15 item16 item17 item19 item20
## -1 -1 1 -1 -1 1 -1 1 -1 1 1Figure 2.11 shows the resulting Venn diagram without sign (left) and with sign (right).
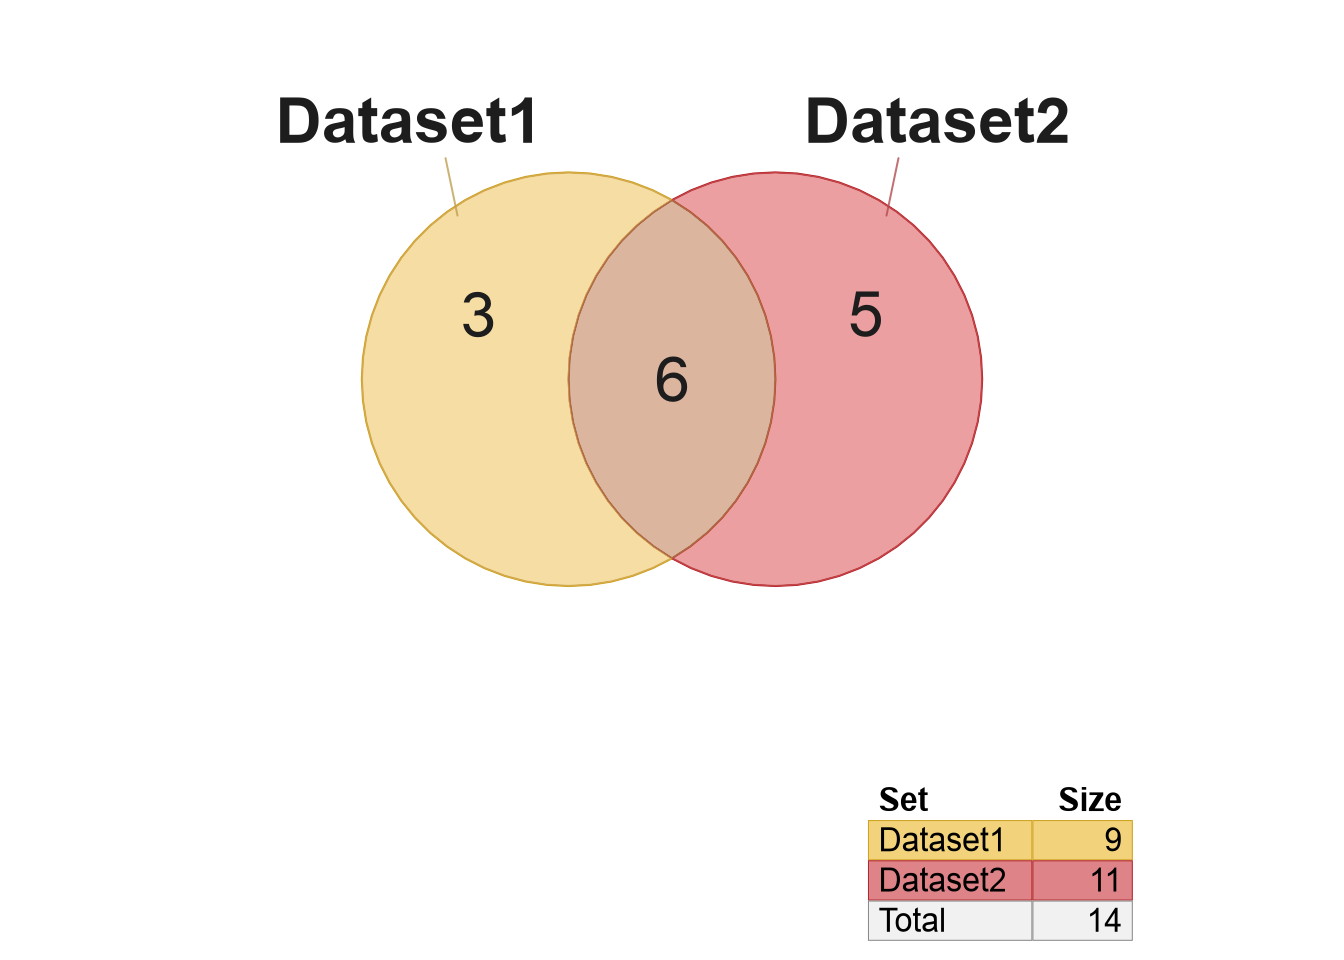
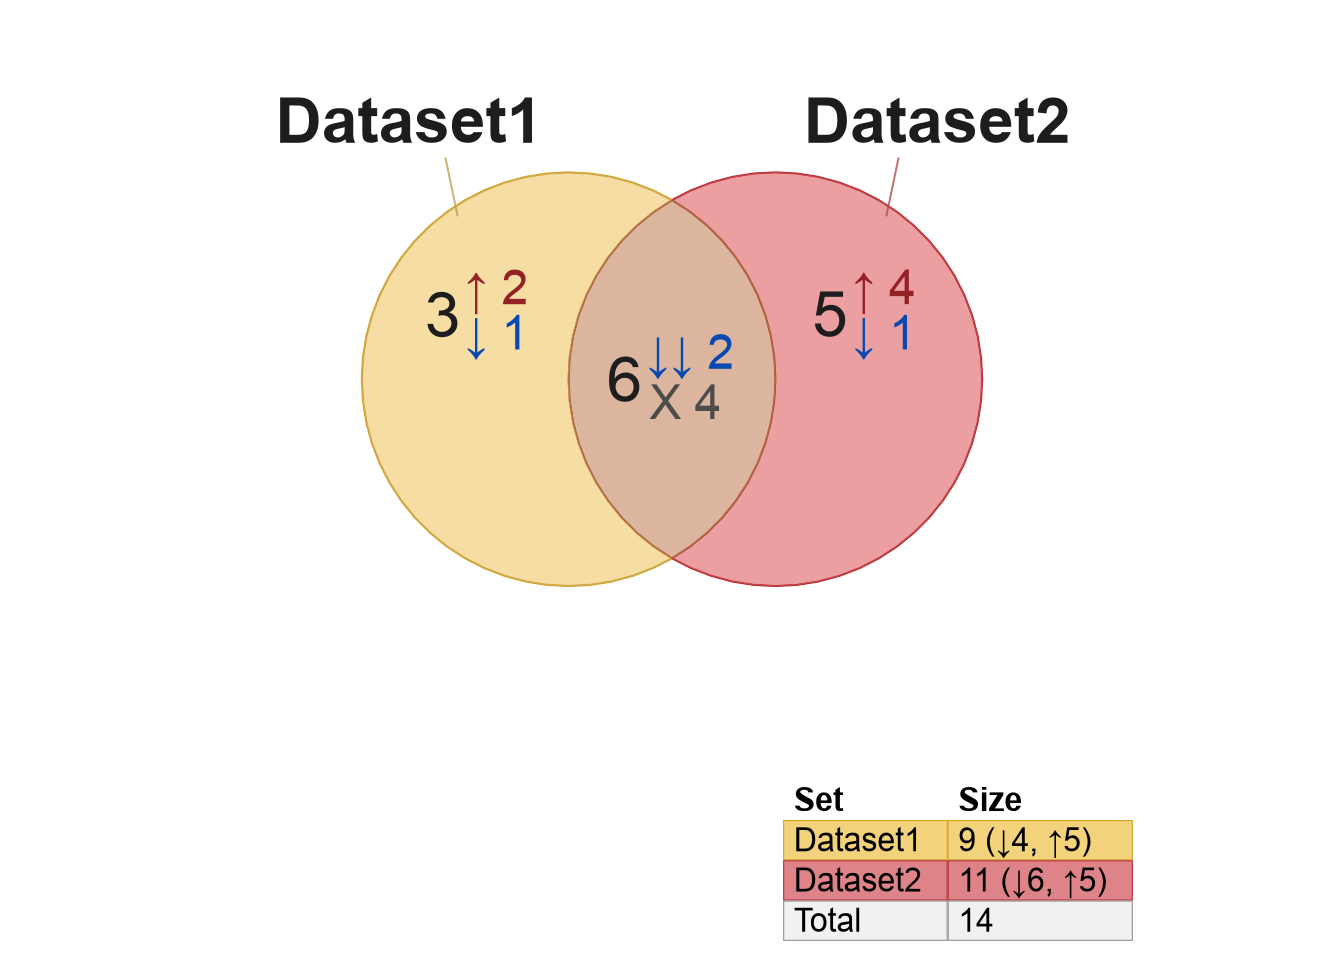
Figure 2.11: Venn diagram using a list of data frames to a setlist (left) and signed setlist (right).